ETFs Won Big in 2025: Where Advisors Are Leaving Mutual Funds Behind
2025 has been the biggest year in history for ETFs, following a record-breaking 2024, which followed a record-breaking 2023.
In all three years, net new assets for ETFs surpassed $1 trillion. It was evident that 2025 would be a big year for ETFs, as the vehicle gathered nearly $980 billion by October 31st.
Subscribe to the Fund Flow Report
As heads of distribution across the industry will tell you, “it’s not the asset gathering business, it’s the asset winning business.”
Meaning there’s a “loser” somewhere. In this case, it’s been mutual funds.
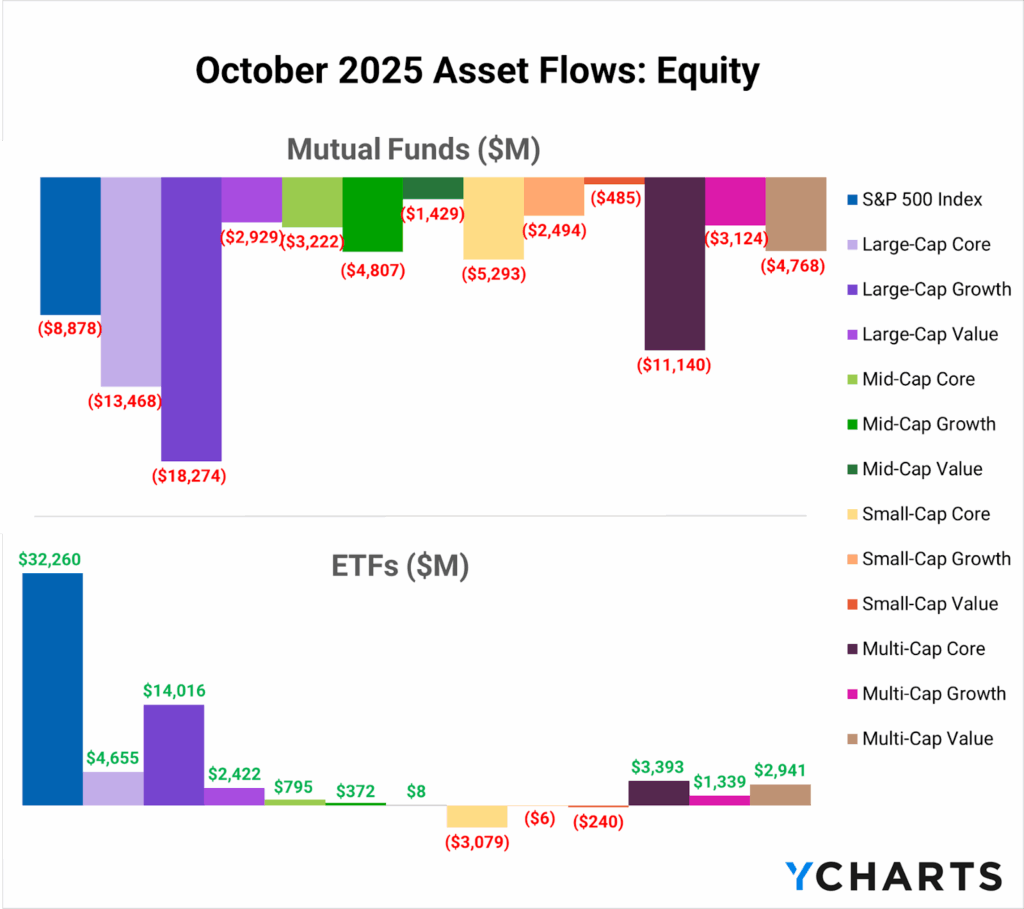
In October alone, across the equity universe, mutual funds experienced net outflows—a common refrain that has persisted through 2025 and over the past several years—as advisors continue to consolidate into ETF vehicles, motivated by tighter tracking, lower costs, and significantly better tax outcomes. (Review the biggest capital gains culprits here)
Add CapGainsValet to your YCharts account to streamline tax-planning conversations and eliminate last-minute surprises.However, on the heels of the SEC’s decision regarding ETF share classes, which aims to create parity in tax treatment across vehicles, relief may be coming to mutual funds.
As fund companies begin to consider which of their legacy funds to add ETF share classes to, or where they want to continue developing ETF products, we have compiled a definitive list of where the ETF wrapper has been most preferred over its mutual fund counterparts.
This will create clearer visibility into which categories are “ETF-first” and where advisors are explicitly abandoning the mutual fund structure. For advisors, these trends help validate allocation decisions, model updates, and client-facing explanations.
Table of Contents
Full Ranking of ETFs vs Mutual Funds in 2025
Across the entire fund universe, the scale of the wrapper shift becomes undeniable when flows are viewed side by side.
S&P 500 Index, Large-Cap Growth, and Large-Cap Core funds sit at the top of the leaderboard, and these three alone account for more than $700 billion in wrapper-shift differential.
| Peer Group | MF YTD | ETF YTD | Difference (ETF minus MF) |
|---|---|---|---|
| S&P 500 Index | -251.63B | 130.86B | 382.49B |
| Large-Cap Growth | -120.75B | 73.56B | 194.31B |
| Large-Cap Core | -80.69B | 55.78B | 136.47B |
| Multi-Cap Core | -54.44B | 43.13B | 97.57B |
| International Multi-Cap Core | -20.89B | 56.55B | 77.44B |
| Equity Income | -41.09B | 21.11B | 62.20B |
| Multi-Cap Value | -28.49B | 20.35B | 48.84B |
| Emerging Markets | -25.61B | 20.50B | 46.11B |
| Large-Cap Value | -32.24B | 8.55B | 40.79B |
| Short U.S. Treasury | 398M | 40.95B | 40.55B |
| Mid-Cap Growth | -35.28B | 3.77B | 39.05B |
| Mid-Cap Core | -17.31B | 13.30B | 30.61B |
| International Large-Cap Growth | -31.50B | -1.46B | 30.04B |
| Multi-Cap Growth | -16.56B | 11.45B | 28.01B |
| Small-Cap Core | -40.96B | -13.66B | 27.30B |
| High Yield | -4.69B | 18.96B | 23.65B |
| Core Plus Bond | -10.19B | 13.30B | 23.49B |
| Mid-Cap Value | -12.53B | -617M | 11.91B |
| International Multi-Cap Value | -6.91B | 4.90B | 11.81B |
| European Region | 781M | 11.42B | 10.64B |
| International Income | 8.73B | 17.54B | 8.81B |
| Ultra-Short Obligations Funds | 12.07B | 20.00B | 7.93B |
| Inflation Protected Bond | 5.75B | 9.80B | 4.05B |
| International Equity Income | 1.09B | 4.45B | 3.36B |
| Core Bond | 30.52B | 46.85B | 16.33B |
| International Large-Cap Core | 6.20B | 14.24B | 8.04B |
| Loan Participation | -3.90B | 8.55B | 12.45B |
| Short Investment Grade Debt Funds | 1.68B | 13.44B | 11.76B |
| Multi-Sector Income | 33.53B | 17.75B | -15.78B |
| General Bond | 13.15B | -419M | -13.57B |
| Equity Leverage | -182M | -13.01B | -12.83B |
| High Yield Municipal Debt | 6.99B | 3.79B | -3.20B |
| China Region | 155M | -2.88B | -3.04B |
| Emerging Mrkts Hard Currency Debt | 1.25B | -640M | -1.89B |
| Specialty Fixed Income | 1.16B | -259M | -1.42B |
| Emerging Markets Local Currency Debt | 2.63B | 1.35B | -1.28B |
| Pacific Region | -119M | -810M | -691M |
| India Region | -303M | -708M | -405M |
Subscribe to the Fund Flow Report
From an advisor’s perspective, these imbalances reflect a broader shift toward simplicity, transparency, and control.
ETFs allow advisors to manage concentration risk, harvest tax losses, and make intra-day allocation changes without navigating multiple share classes or embedded tax liabilities.
Similarly, for model-driven practices, this ranking validates a major evolution in portfolio construction.
The top ETF-advantaged categories all represent core model allocations, which explains why advisors transition these exposures first. As models continue to scale and centralize, flows will increasingly follow wrappers that create the least friction and the most operational efficiency. (Review the best performing ETFs here)
U.S. Equity: The Core of the Mutual Fund-to-ETF Migration
While the Top 10 ranking highlights the sheer scale of ETF dominance across the entire fund universe, domestic equity is where these shifts are most decisive.
Categories like the S&P 500 Index and Large-Cap Growth appear at the top of the broader leaderboard, but when isolating U.S. equities, the data reveals that advisors are systematically exiting mutual funds across nearly every domestic style box.
This is the segment where the wrapper migration is furthest along and where ETFs have become the default implementation vehicle for the majority of core exposures.
| Peer Group | MF YTD | ETF YTD | Difference (ETF minus MF) |
|---|---|---|---|
| S&P 500 Index | -251.63B | 130.86B | 382.49B |
| Large-Cap Growth | -120.75B | 73.56B | 194.31B |
| Large-Cap Core | -80.69B | 55.78B | 136.47B |
| Multi-Cap Core | -54.44B | 43.13B | 97.57B |
| Equity Income | -41.09B | 21.11B | 62.20B |
| Multi-Cap Value | -28.49B | 20.35B | 48.84B |
| Large-Cap Value | -32.24B | 8.55B | 40.79B |
| Mid-Cap Growth | -35.28B | 3.77B | 39.05B |
| Mid-Cap Core | -17.31B | 13.30B | 30.61B |
| Small-Cap Core | -40.96B | -13.66B | 27.30B |
| Small-Cap Growth | -21.32B | -2.97B | 18.35B |
| Multi-Cap Growth | -16.56B | 11.45B | 28.01B |
| Mid-Cap Value | -12.53B | -617M | 11.91B |
| Small-Cap Value | -2.89B | 805M | 3.69B |
| Equity Leverage | -182M | -13.01B | -12.83B |
Subscribe to the Fund Flow Report
Domestic equity positions are the ones most frequently touched during client acquisition, onboarding conversations, proposal creation, and transition plans, areas where YCharts streamlines workflows, helps advisors visualize ETF-based model implementations, and ultimately unlocks organic growth.
These same exposures are also adjusted during rebalances, tax transitions, and routine events, such as client deposits, RMD withdrawals, or liquidity needs.
ETFs support all of this motion with fewer frictions, tighter execution, and greater predictability. As a result, even categories not represented in the Top 10, such as Mid-Cap Growth and Mid-Cap Core, show substantial ETF advantages.
Bond ETFs Win on Liquidity, Flexibility, and Precision
The fixed income space has become one of 2025’s most consequential arenas for the wrapper transition.
Categories like Short U.S. Treasury, High Yield, and Core Plus Bond demonstrate enormous ETF advantages as 2025’s interest-rate environment demanded tools that react faster than traditional mutual funds.
| Peer Group | MF YTD | ETF YTD | Difference (ETF minus MF) |
|---|---|---|---|
| Short U.S. Treasury | 398M | 40.95B | 40.55B |
| High Yield | -4.69B | 18.96B | 23.65B |
| Core Plus Bond | -10.19B | 13.30B | 23.49B |
| Corporate Debt Funds BBB-Rated | -3.91B | 14.07B | 17.98B |
| Core Bond | 30.52B | 46.85B | 16.33B |
| Loan Participation | -3.90B | 8.55B | 12.45B |
| Short Investment Grade Debt Funds | 1.68B | 13.44B | 11.76B |
| Ultra-Short Obligations Funds | 12.07B | 20.00B | 7.93B |
| Inflation Protected Bond | 5.75B | 9.80B | 4.05B |
| Intermediate U.S. Government | 1.80B | 3.33B | 1.53B |
| General U.S. Treasury | 5.19B | 20.07B | 14.88B |
| International Income | 8.73B | 17.54B | 8.81B |
| U.S. Mortgage | -494M | 10.87B | 11.36B |
| Corporate Debt Funds A Rated | -6.20B | 338M | 6.54B |
| Convertible Securities | -715M | 57M | 771M |
| Flexible Income | -246M | 74M | 320M |
| General U.S. Government | -932M | -141M | 791M |
| Global Income | -1.44B | 1.98B | 3.42B |
| GNMA | -4.38B | 10M | 4.39B |
| Specialty Fixed Income | 1.16B | -259M | -1.42B |
| Emerging Mrkts Hard Currency Debt | 1.25B | -640M | -1.89B |
| Emerging Markets Local Currency Debt | 2.63B | 1.35B | -1.28B |
| High Yield Municipal Debt | 6.99B | 3.79B | -3.20B |
| General Bond | 13.15B | -419M | -13.57B |
| Multi-Sector Income | 33.53B | 17.75B | -15.78B |
| Short U.S. Government | -377M | 3.77B | 4.15B |
| Short-Intermediate U.S. Government | -105M | 189M | 294M |
Subscribe to the Fund Flow Report
As highlighted in our analysis of the rising adoption of active fixed-income ETFs, advisors are expanding their toolkit with structures that offer more tactical flexibility.
For many advisors, what truly set 2025 apart was the resurgence of fixed income as both an income driver and a portfolio stabilizer. Yields remained near decade highs, and active managers finally had a backdrop where security selection, duration management, and credit rotation mattered again.
When active bond strategies are delivered through an ETF wrapper, advisors benefit from the alpha potential of active management, as well as the liquidity and tax efficiency that ETFs offer.
This combination enabled advisors to construct bond sleeves that could respond more quickly to macro shifts, whether adjusting duration as the Fed pivoted, rotating into higher-quality credit to mitigate risk, or leaning into yields without compromising flexibility.
In 2025, fixed-income ETFs prevailed because they offered better tools for constructing modern portfolios in a volatile, yet opportunity-rich, bond market. (Review the best-performing bond ETFs here)
International ETFs Became Advisors’ Top Tool for Reducing U.S. Concentration Risk
After years of U.S.-centric positioning, 2025 marked a meaningful re-engagement with international markets.
Peer Groups such as International Multi-Cap Core and Emerging Markets posted substantial ETF advantages, reflecting advisors’ renewed focus on reducing U.S. concentration risk, mitigating overexposure to tech-dominated sectors, and rebuilding true global diversification.
| Category | MF YTD | ETF YTD | Difference (ETF minus MF) |
|---|---|---|---|
| International Multi-Cap Core | -20.89B | 56.55B | 77.44B |
| Emerging Markets | -25.61B | 20.50B | 46.11B |
| International Large-Cap Growth | -31.50B | -1.46B | 30.04B |
| International Multi-Cap Value | -6.91B | 4.90B | 11.81B |
| European Region | 781M | 11.42B | 10.64B |
| International Large-Cap Core | 6.20B | 14.24B | 8.04B |
| International Equity Income | 1.09B | 4.45B | 3.36B |
| International Small/Mid-Cap Value | -1.24B | 4.39B | 5.63B |
| Pacific Ex Japan | -545M | 1.12B | 1.66B |
| Latin American | -18M | 2.59B | 2.61B |
| International Large-Cap Value | 50M | 3.92B | 3.87B |
| International Small/Mid-Cap Core | -1.91B | 82M | 1.99B |
| Japanese | -121M | -132M | -11M |
| China Region | 155M | -2.88B | -3.04B |
| India Region | -303M | -708M | -405M |
| Pacific Region | -119M | -810M | -691M |
| International Small/Mid-Cap Growth | -5.31B | -5M | 5.30B |
| International Multi-Cap Growth | -9.60B | 277M | 9.88B |
Subscribe to the Fund Flow Report
With the Magnificent 7 still commanding an outsized share of U.S. benchmarks, advisors increasingly looked abroad for complementary return sources and broader sector balance, making international ETFs a natural allocation choice as part of this rotational shift.
While international ETFs may not always offer the same tax benefits as their U.S. counterparts, many advisors still prefer them due to their trading transparency, straightforward share structure, and consistent access to global markets.
International ETFs also offer more predictable rebalancing behavior within model portfolios, allowing advisors to fine-tune exposures across regions, styles, and market caps.
In a year marked by the pursuit of broader opportunity sets and enhanced diversification profiles, international ETFs emerged as one of the most effective tools for building portfolios that look beyond U.S. and tech dominance. (Review the best-performing international ETFs here)
As advisors reassess portfolios heading into year-end, the 2025 flow landscape makes one trend unmistakably clear: the ETF wrapper has become the preferred vehicle for expressing core equity, fixed income, and international allocations across the industry.
Whenever you’re ready, there are 3 ways YCharts can help you:
1. Want to test out YCharts for free?
Start a no-risk 7-Day Free Trial.
2. Sign up for a copy of our Fund Flows Report: to keep tabs on flows into ETFs and Mutual Funds:
Sign up for our free monthly Fund Flow Report:3. Get the Cap Gains Valet dataset added to your YCharts account:
Reach Out to Add CapGainsValet Metrics to Your AccountDisclaimer
©2025 YCharts, Inc. All Rights Reserved. YCharts, Inc. (“YCharts”) is not registered with the U.S. Securities and Exchange Commission (or with the securities regulatory authority or body of any state or any other jurisdiction) as an investment adviser, broker-dealer or in any other capacity, and does not purport to provide investment advice or make investment recommendations. This report has been generated through application of the analytical tools and data provided through ycharts.com and is intended solely to assist you or your investment or other adviser(s) in conducting investment research. You should not construe this report as an offer to buy or sell, as a solicitation of an offer to buy or sell, or as a recommendation to buy, sell, hold or trade, any security or other financial instrument. For further information regarding your use of this report, please go to: ycharts.com/about/disclosure
Next Article
Why the Dot-Com Comparison Falls Short in 2025Read More →