Inflation Surprises in April 2024: How U.S. Treasury Rates Reacted
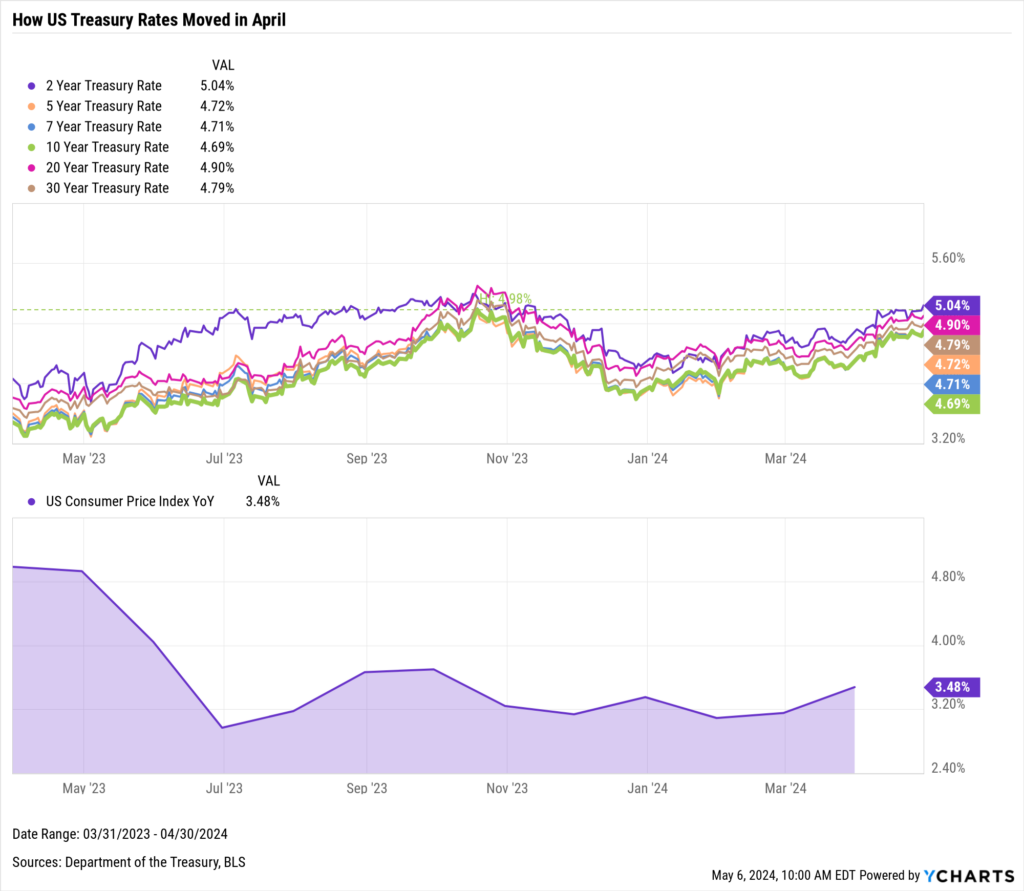
Longer-dated U.S. Treasury yields rose in April, reaching their highest levels in 2024. The surge was fueled by a hotter-than-expected March inflation report, where CPI came in at 3.5%, above the 3.4% expectation. Following the report, the 10-year Treasury yield soared above 4.6% for the first time since November 2023.
Download Visual | Modify in YCharts
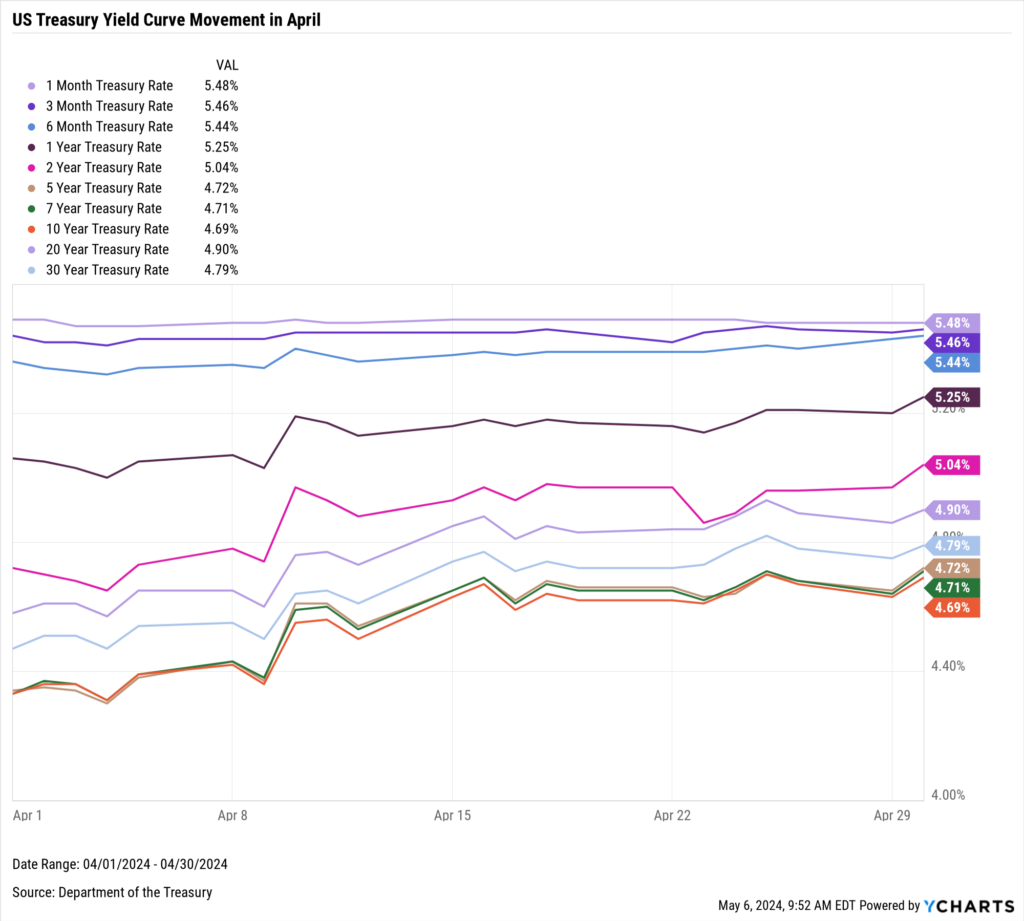
Elsewhere on the yield curve, 1-month, 3-month, and 6-month Treasury bill rates saw slight increases–particularly towards the end of April–ending the month around the 5.4% mark.
Longer maturities, such as the 1-year, 2-year, 5-year Treasury notes all the way up to the 10-year, 20-year, and 30-year Treasury bond rates, demonstrated more pronounced movements. Reflecting the market’s pessimism that inflation would ease to the Federal Reserve’s target of 2%, reducing the likelihood of multiple interest rate cuts in 2024.
You can read more about how interest rates affect investors and consumers here.
Download Visual | Modify in YCharts
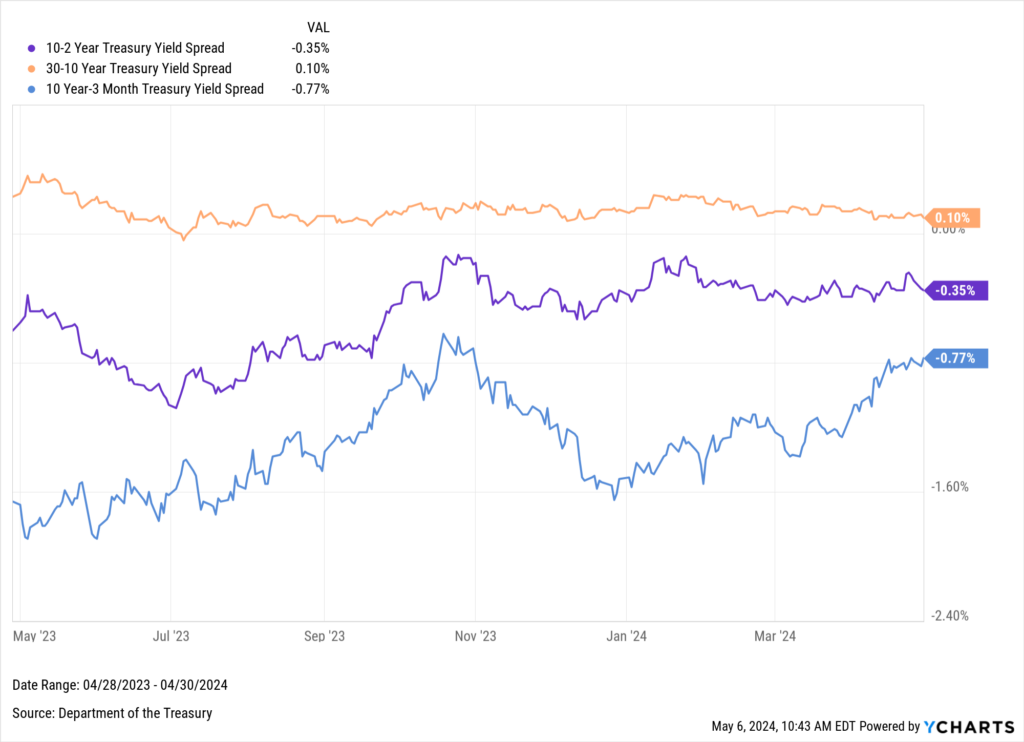
There were also sustained 10 year-3 month and 10-2-year yield curve inversions in April—scenarios often associated with anticipatory economic slowdowns. The 10-2 has been inverted for 22 months, which surpasses the 1978 inversion for the most prolonged inversion in history.
You can read more about yield curve inversions here.
Download Visual | Modify in YCharts
Below, you’ll find how each part of the US Treasury Yield moved in April and over the past year.
Jump to a section:
- Short-term Treasury Rate Movement
- Intermediate-term Treasury Rate Movement
- Long-term Treasury Rate Movement
Short-term Treasury Rate Movement in April
In April 2024, short-term U.S. Treasury rates demonstrated subtle movements. The 1-month, 3-month, and 6-month rates increased modestly, while the 1-year rate experienced a more significant rise.
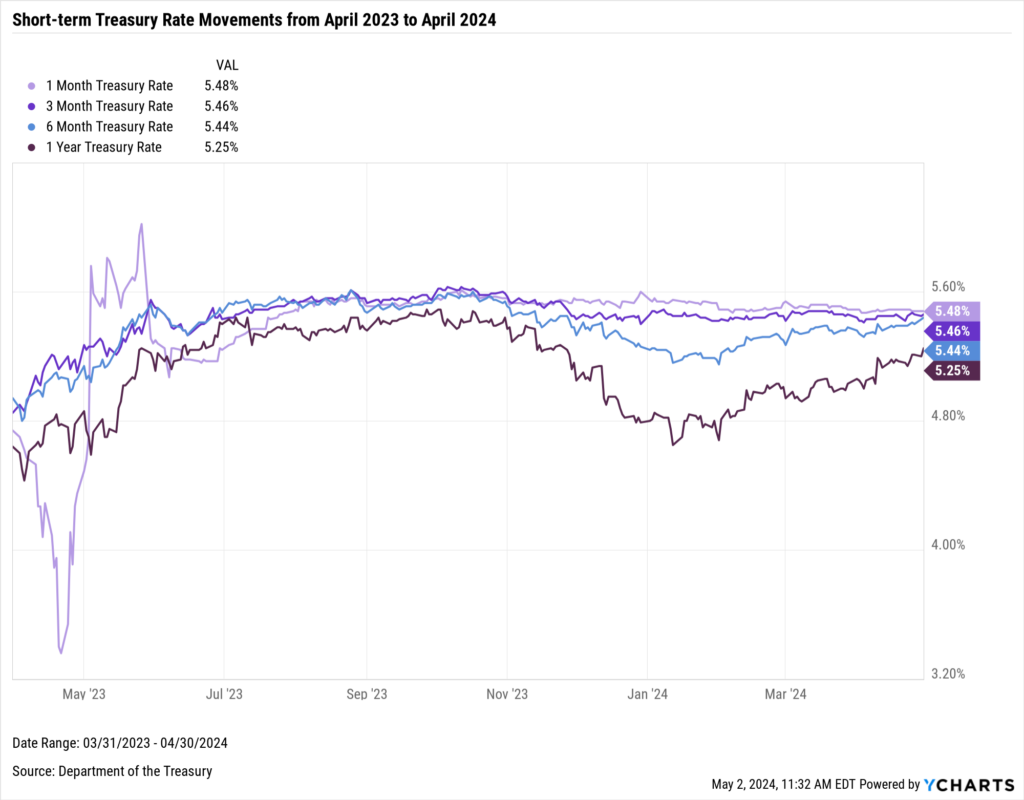
Download Visual | Modify in YCharts
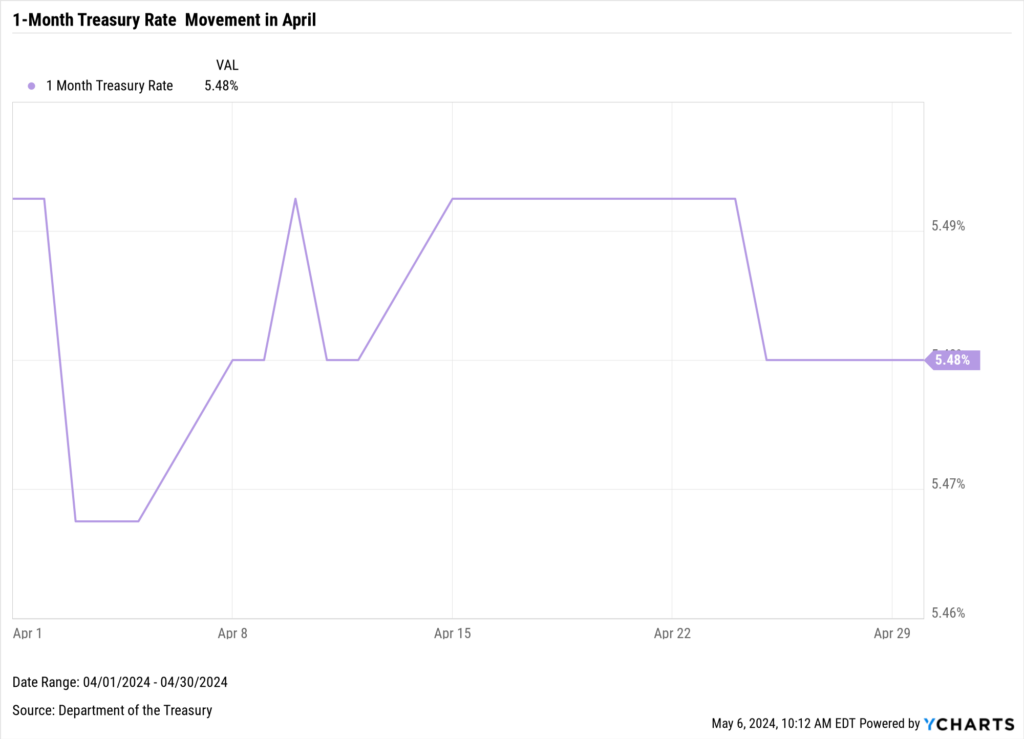
1-Month Treasury Rate Movement in April 2024
The 1-Month Treasury Rate started April at 5.49% and ended the month at 5.48%, down 1 basis point.
Download Visual | Modify in YCharts
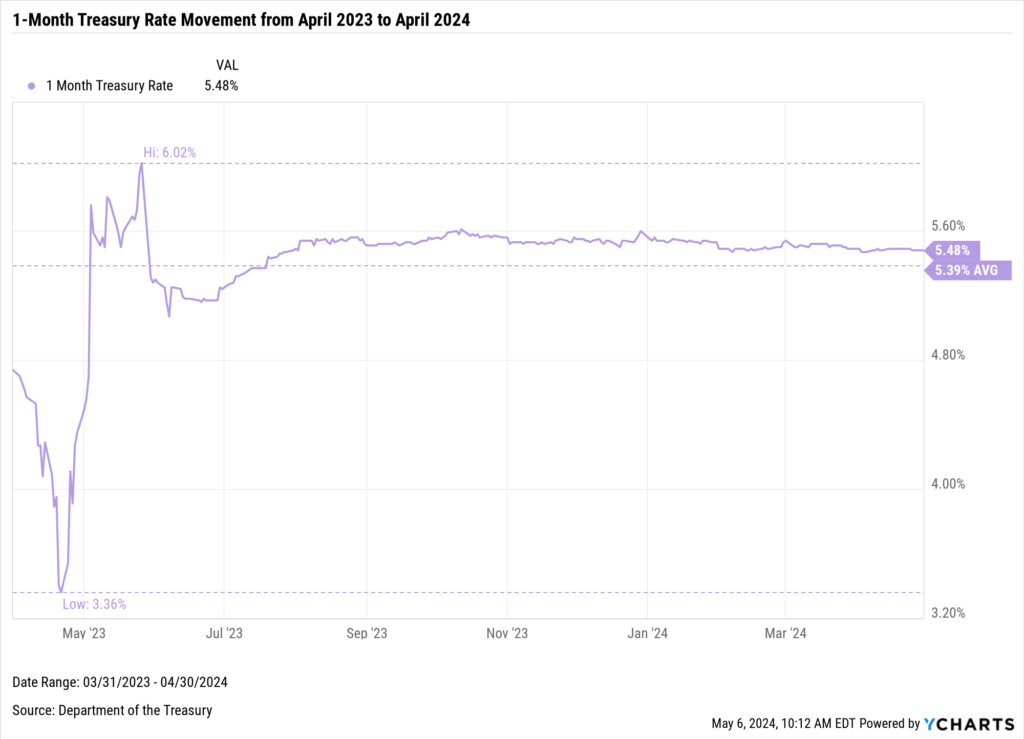
Between March 31, 2023 and April 30, 2024, the 1-Month Treasury Rate moved from 4.74% to 5.48%. The average during that time was 5.39%; the 1-Month peaked at 6.02% on May 26, 2023, and the low was 3.36% on April 21, 2023.
Download Visual | Modify in YCharts
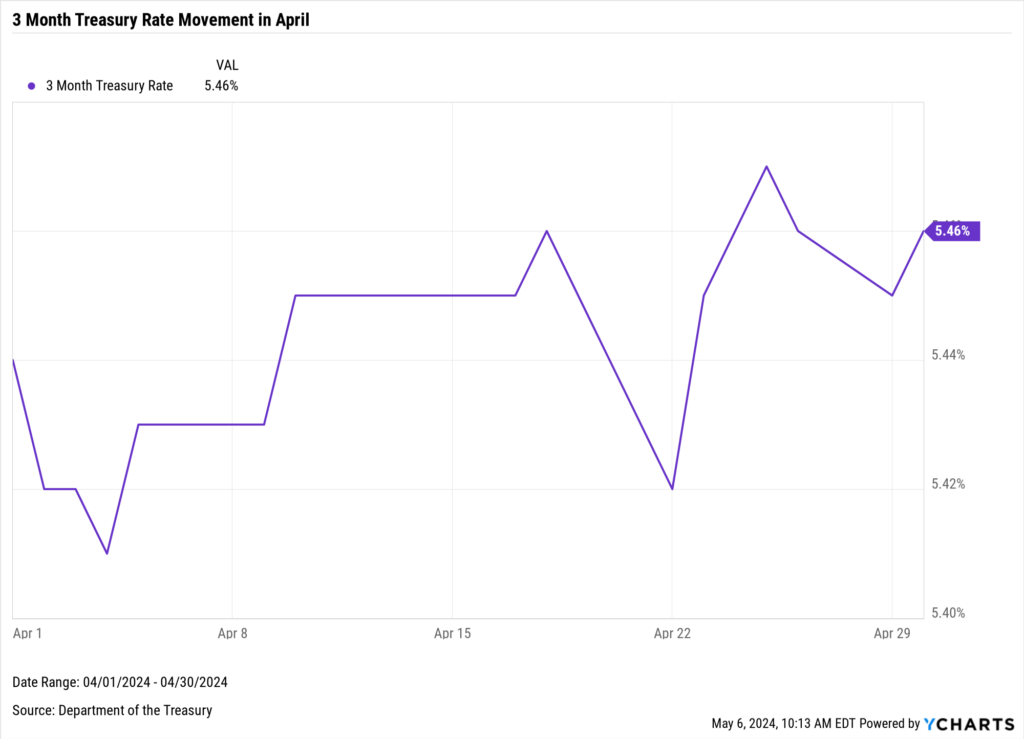
3-Month Treasury Rate Movement in April 2024
The 3-Month Treasury Rate started April at 5.44% and ended the month at 5.46%, up 2 basis points.
Download Visual | Modify in YCharts
Between March 31, 2023 and April 30, 2024, the 3-Month Treasury Rate moved from 4.85% to 5.46%. The average during that time was 5.44%; the 3-Month peaked at 5.63% on October 6, 2023, and the low was 4.85% on March 31, 2023.
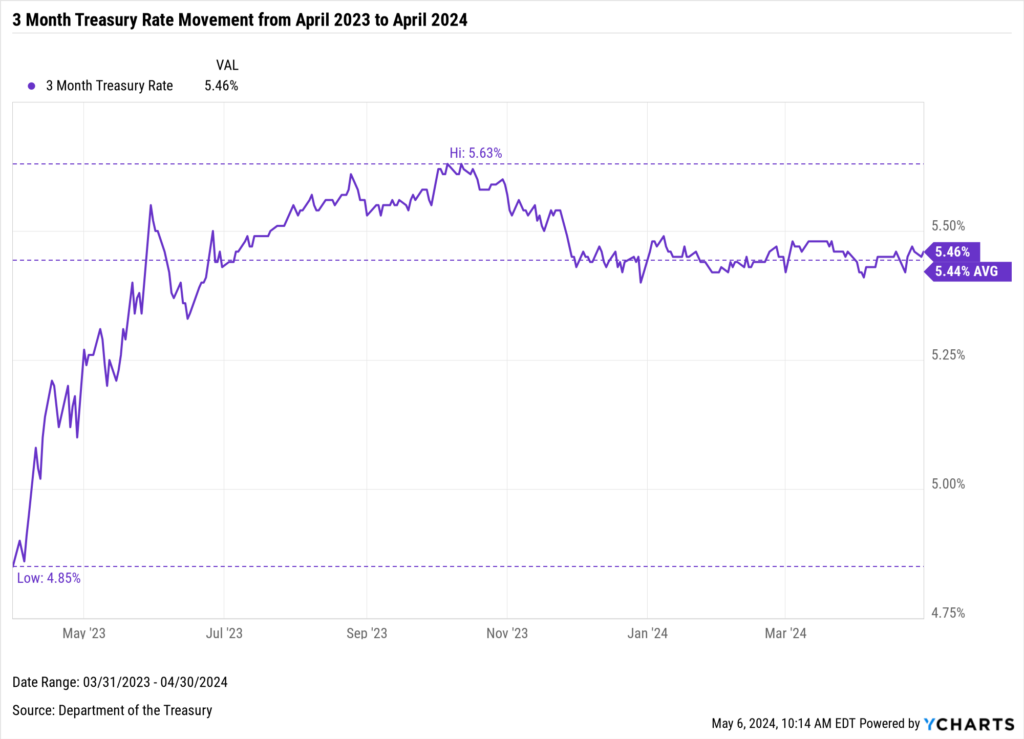
Download Visual | Modify in YCharts
6-Month Treasury Rate Movement in April 2024
The 6-Month Treasury Rate started April at 5.36% and ended the month at 5.44%, up 8 basis points.
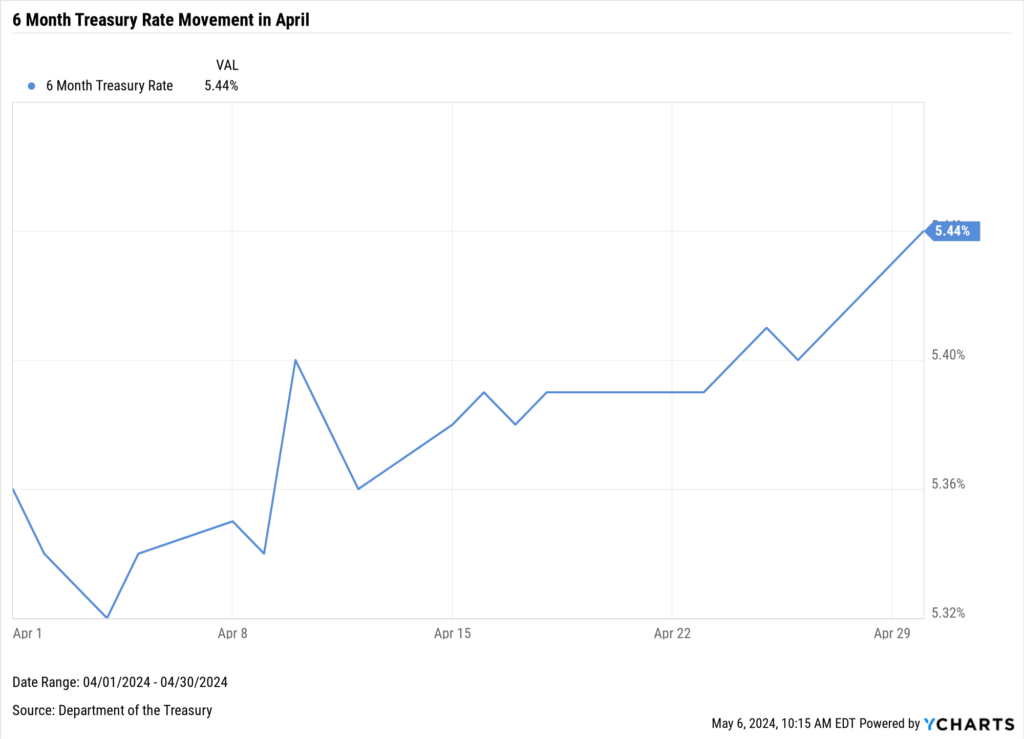
Download Visual | Modify in YCharts
Between March 31, 2023 and April 30, 2024, the 6-Month Treasury Rate moved from 4.94% to 5.37%. The average during that time was 5.37%; the 6-Month peaked at 5.61% on August 25, 2023, and the low was 4.8% on April 4, 2023.
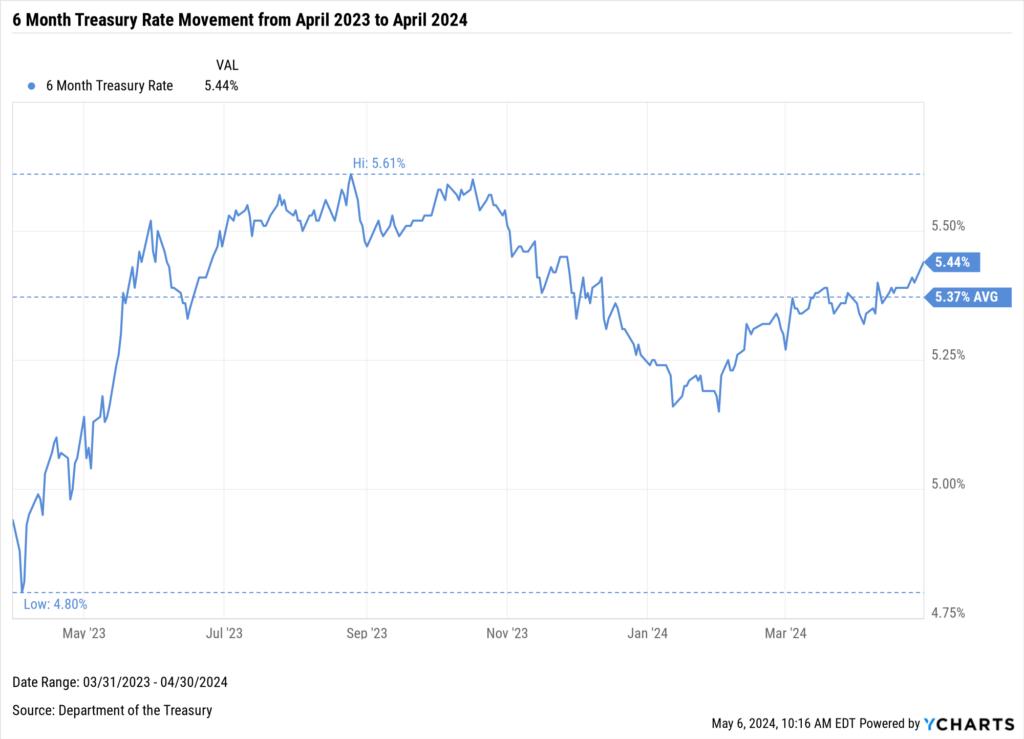
Download Visual | Modify in YCharts
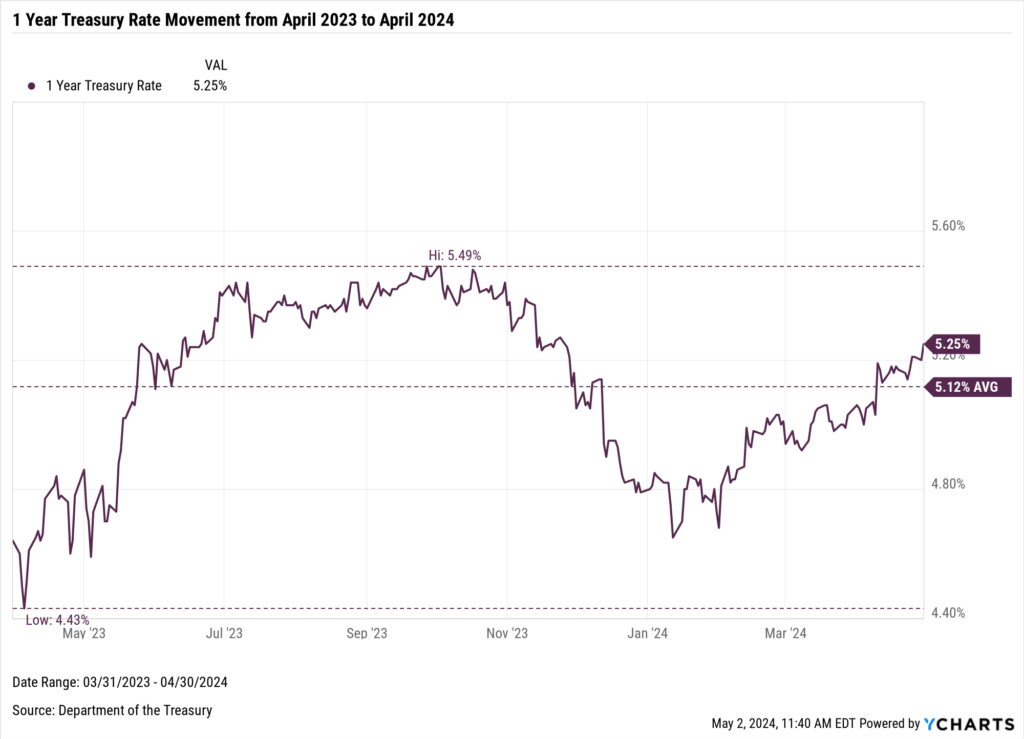
1-Year Treasury Rate Movement in April 2024
The 1-Year Treasury Rate started April at 5.06% and ended the month at 5.25%, up 19 basis points.
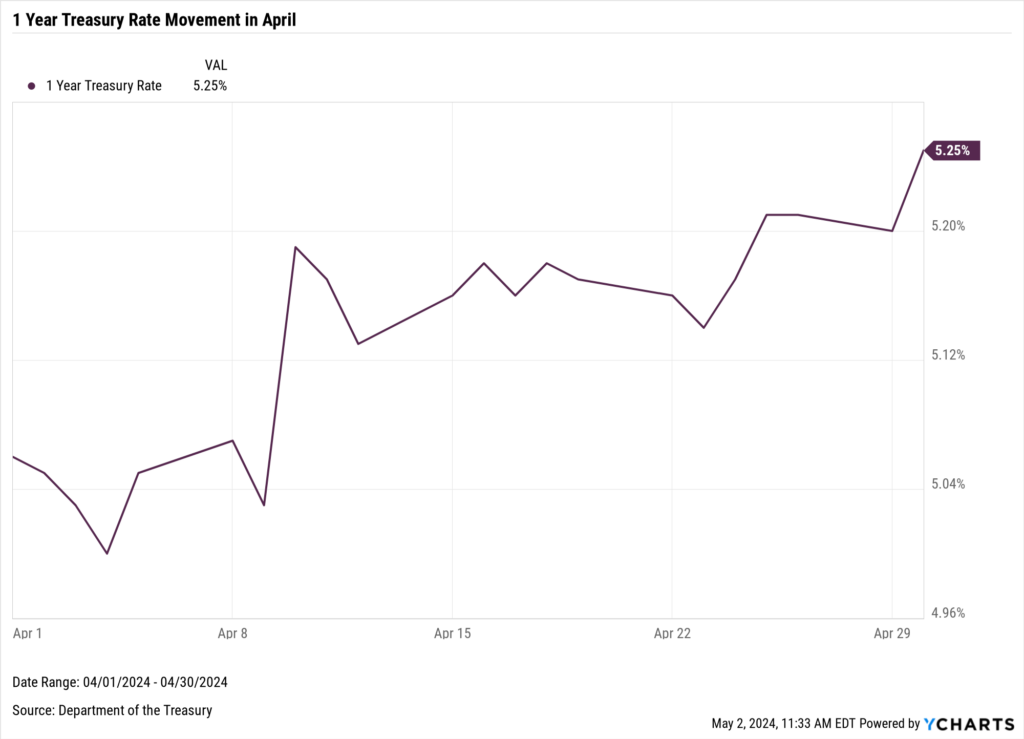
Download Visual | Modify in YCharts
Between March 31, 2023 and April 30, 2024, the 1-Year Treasury Rate moved from 4.64% to 5.25%. The average during that time was 5.12%; the 1-Year peaked at 5.49% on September 27, 2023, and the low was 4.43% on April 5, 2023.
Download Visual | Modify in YCharts
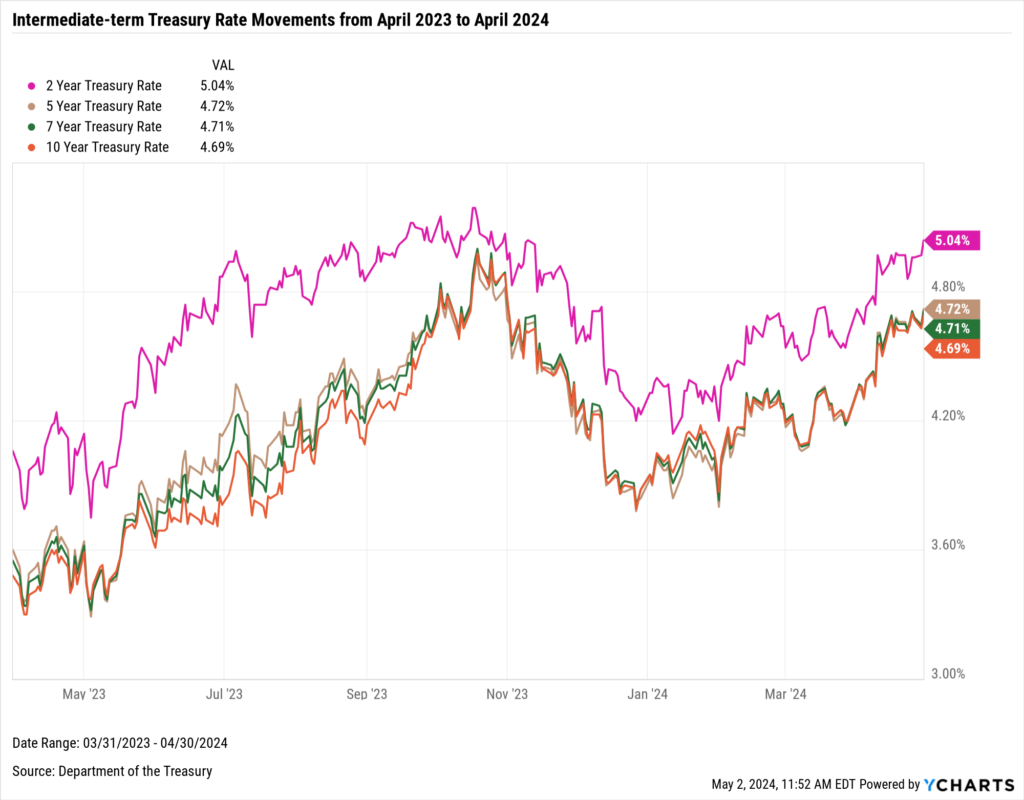
Intermediate-term Treasury Rate Movement in April
The rates for 2-year, 5-year, 7-year, and 10-year bonds increased significantly between April 2023 and April 2024. This increase was particularly noticeable towards the end of the period as more investors began anticipating a “higher for longer” interest rate environment due to the economy’s continued strength and persistent inflation.
Download Visual | Modify in YCharts
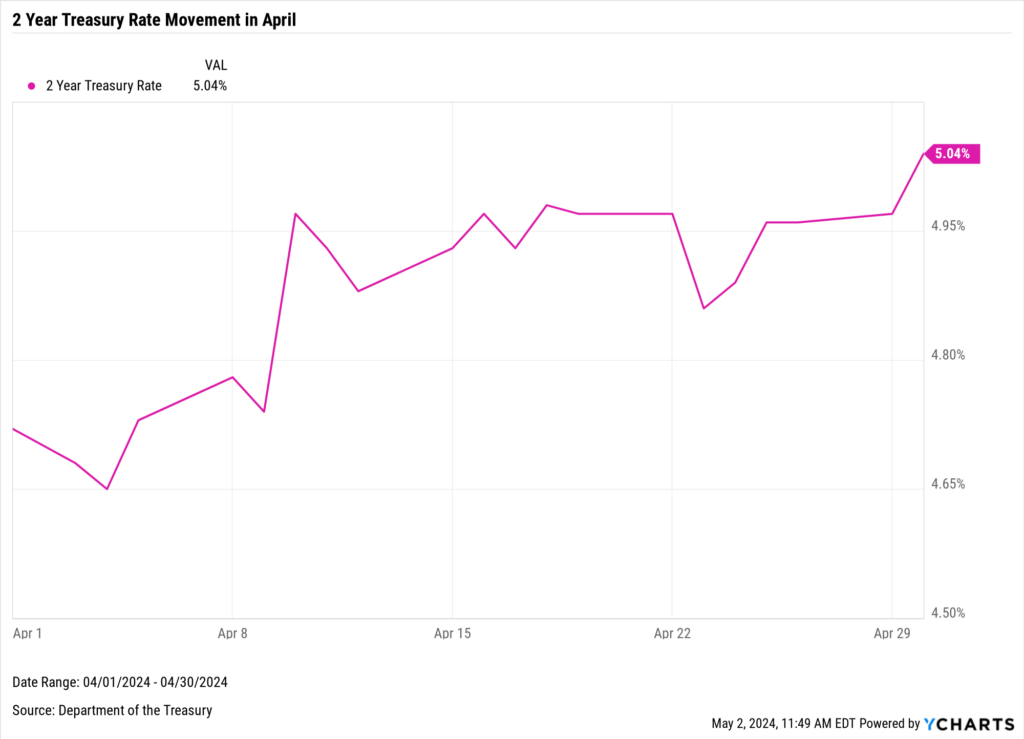
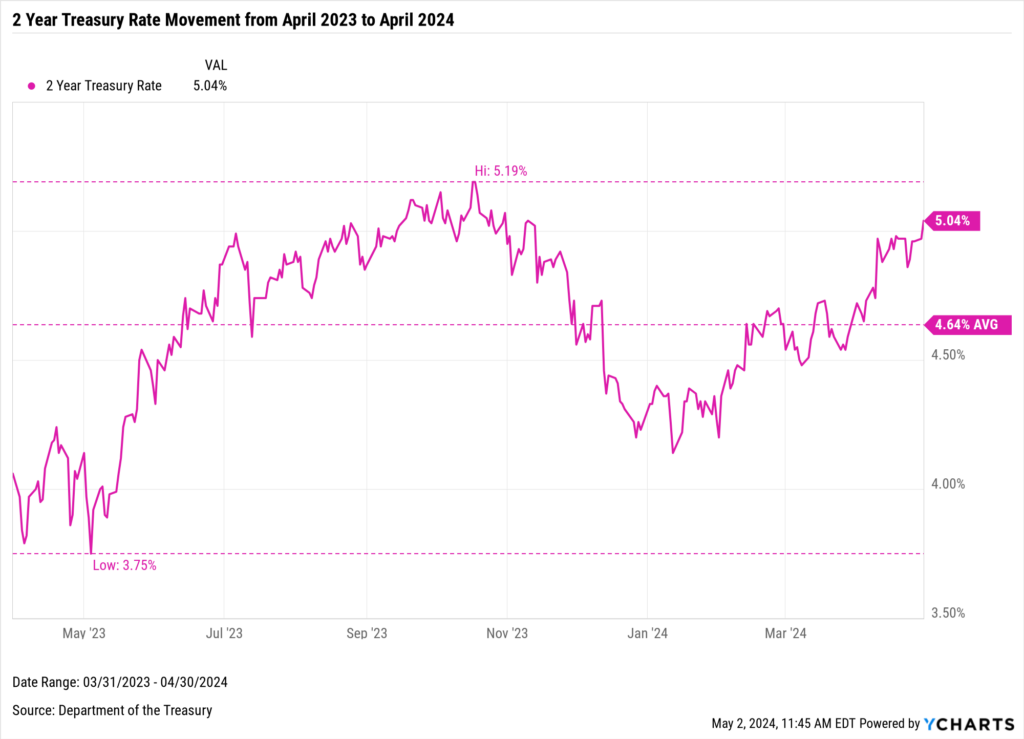
2-Year Treasury Rate Movement in April 2024
The 2-Year Treasury Rate started April at 4.72% and ended the month at 5.04%, up 32 basis points.
Download Visual | Modify in YCharts
Between March 31, 2023 and April 30, 2024, the 2-Year Treasury Rate moved from 4.06% to 5.04%. The average during that time was 4.64%; the 2-Year peaked at 5.19% on October 18, 2023, and the low was 3.75% on May 4, 2023.
Download Visual | Modify in YCharts
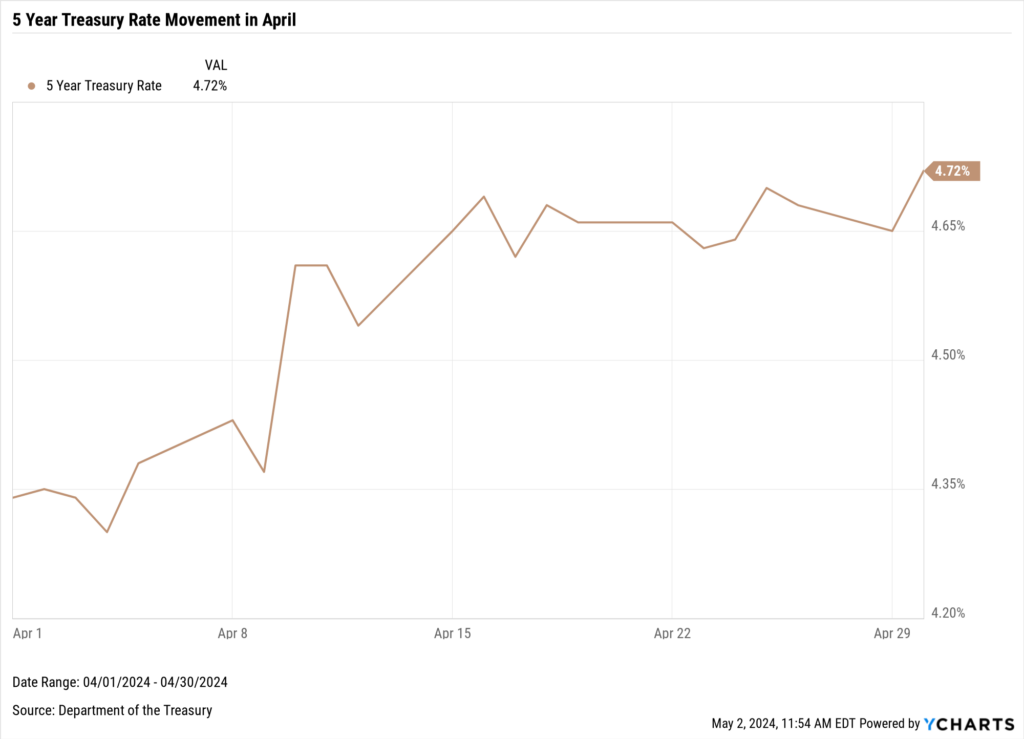
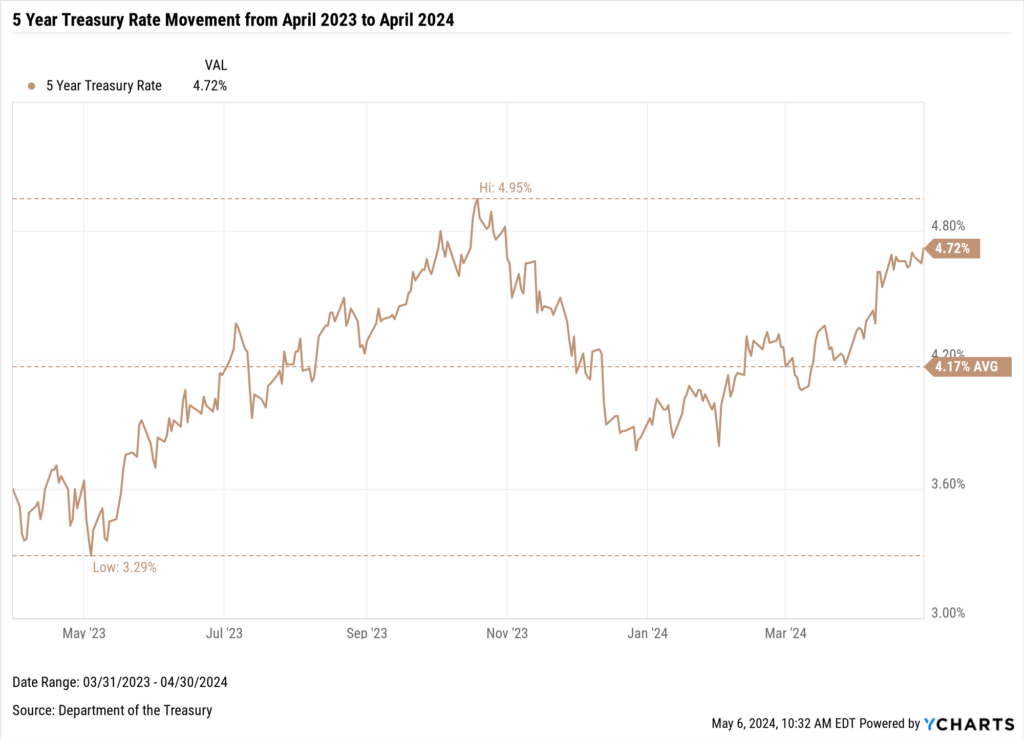
5-Year Treasury Rate Movement in April 2024
The 5-Year Treasury Rate started April at 4.34% and ended the month at 4.72%, up 38 basis points.
Download Visual | Modify in YCharts
Between March 31, 2023 and April 30, 2024, the 5-Year Treasury Rate moved from 3.6% to 4.17%. The average during that time was 4.17%; the 5-Year peaked at 4.95% on October 19, 2023, and the low was 3.29% on May 4, 2023.
Download Visual | Modify in YCharts
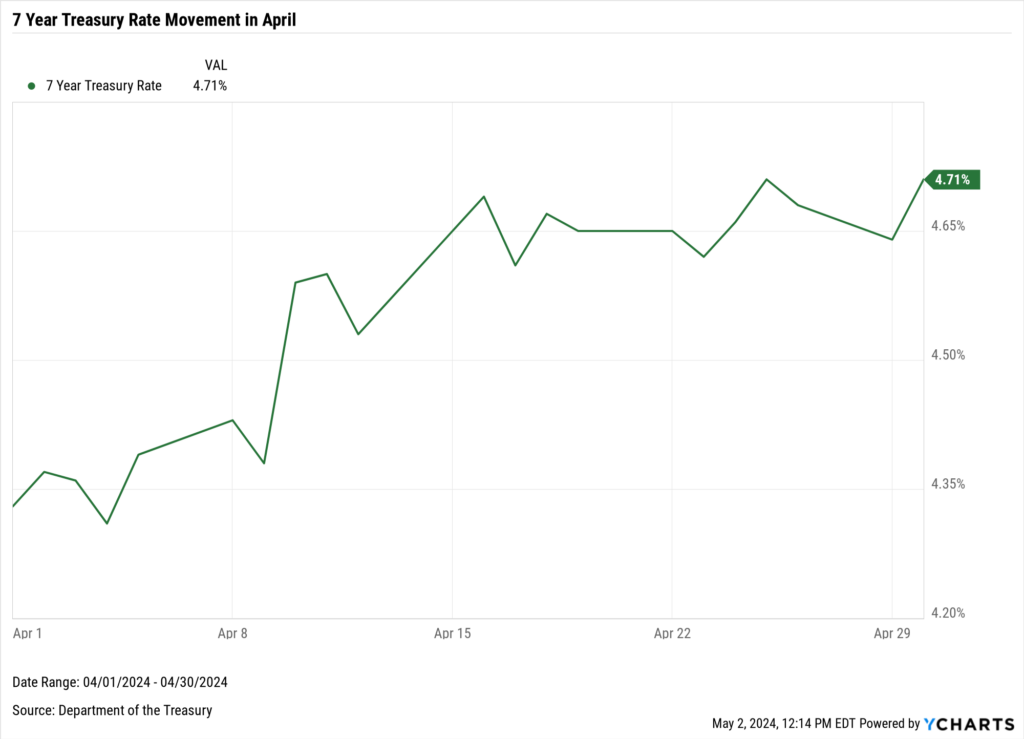
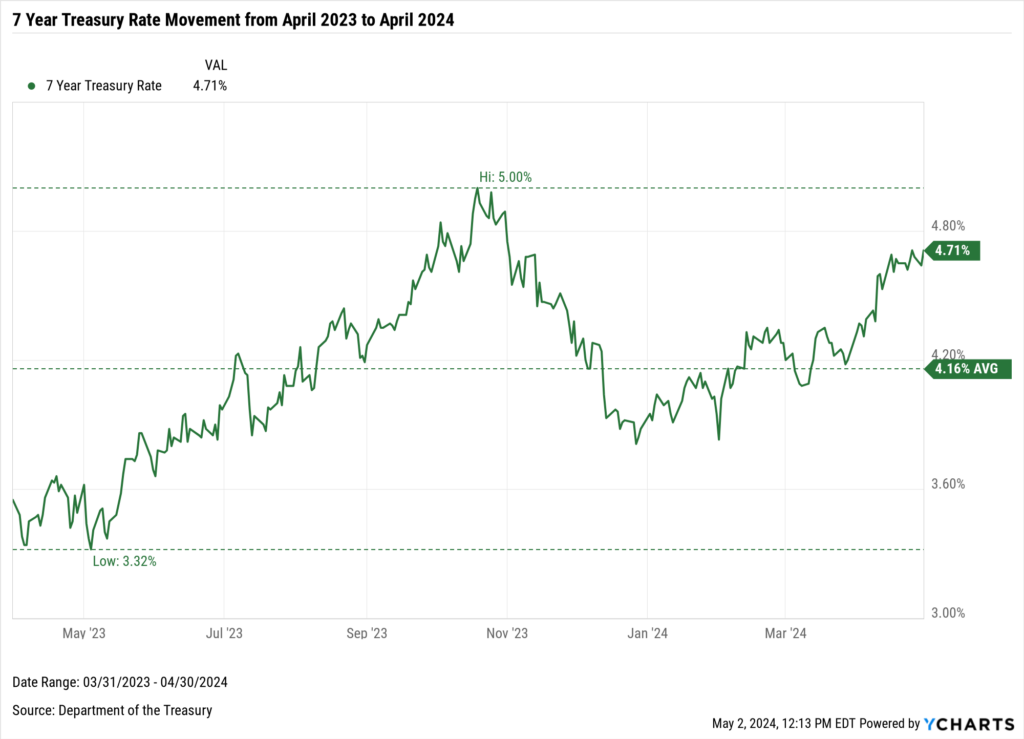
7 Year Treasury Rate Movement in April 2024
The 7-Year Treasury Rate started April at 4.33% and ended the month at 4.71%, up 38 basis points.
Download Visual | Modify in YCharts
Between March 31, 2023 and April 30, 2024, the 7-Year Treasury Rate moved from 3.55% to 4.71%. The average during that time was 4.16%; the 7-Year peaked at 5% on October 19, 2023, and the low was 3.32% on May 4, 2023.
Download Visual | Modify in YCharts
10 Year Treasury Rate Movement in April 2024
The 10-Year Treasury Rate started April at 4.33% and ended the month at 4.69%, up 36 basis points.
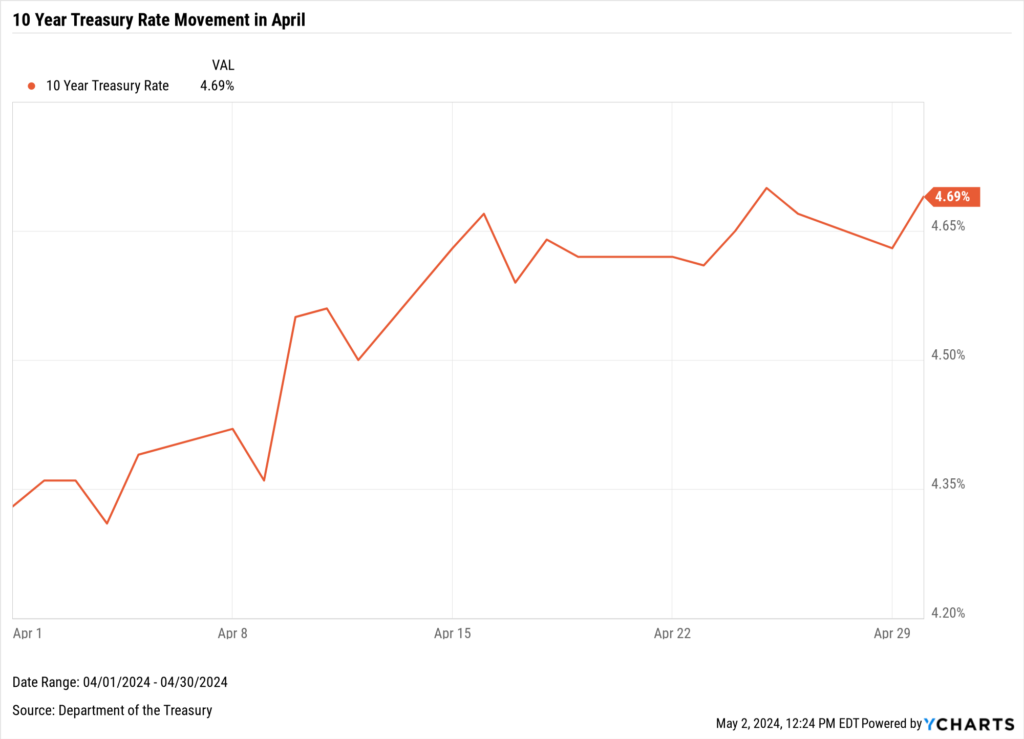
Download Visual | Modify in YCharts
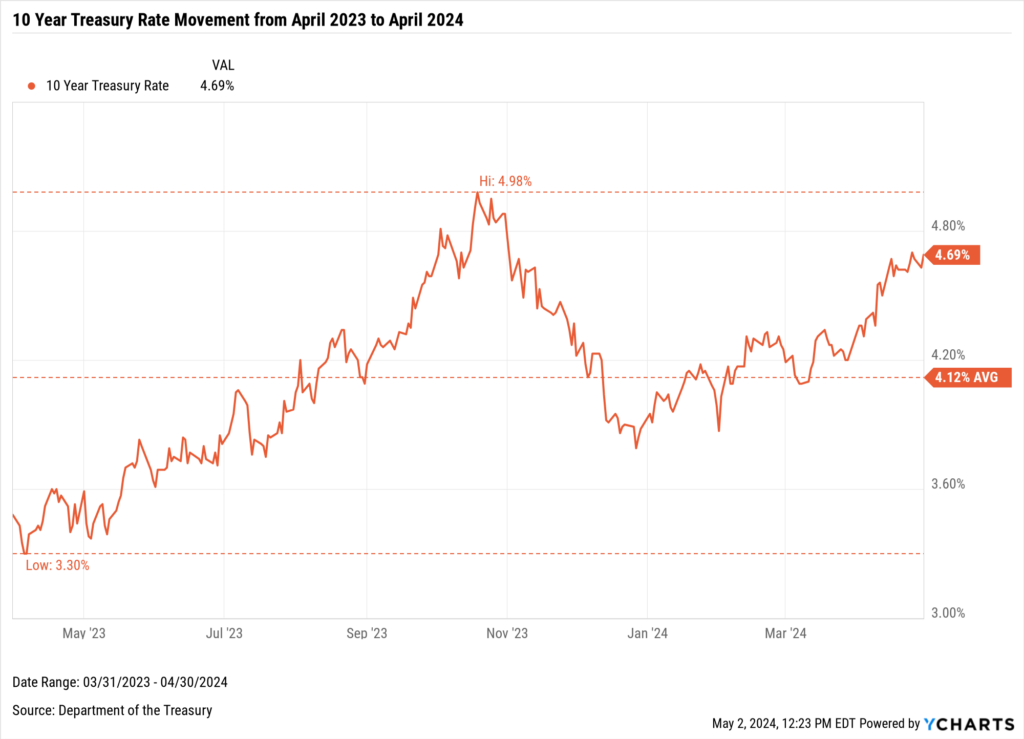
Between March 31, 2023 and April 30, 2024, the 10-Year Treasury Rate moved from 3.48% to 4.69%. The average during that time was 4.12%; the 10-Year peaked at 4.98% on October 19, 2023, and the low was 3.30% on April 5, 2023.
Download Visual | Modify in YCharts
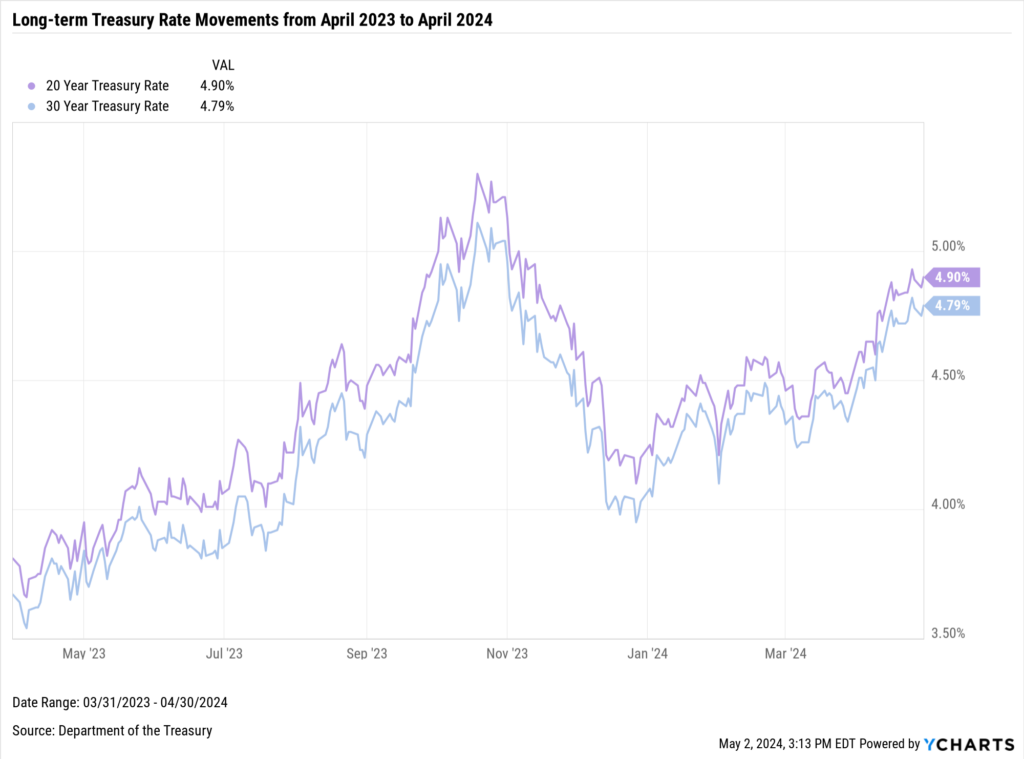
Long-term Treasury Rate Movement in April
Long-term U.S. Treasury rates for the 20-year and 30-year bonds showed notable increases from April 2023 to April 2024, driven by adjusted expectations for fewer rate cuts by the Federal Reserve due to a resilient economy and sticky inflation.
Download Visual | Modify in YCharts
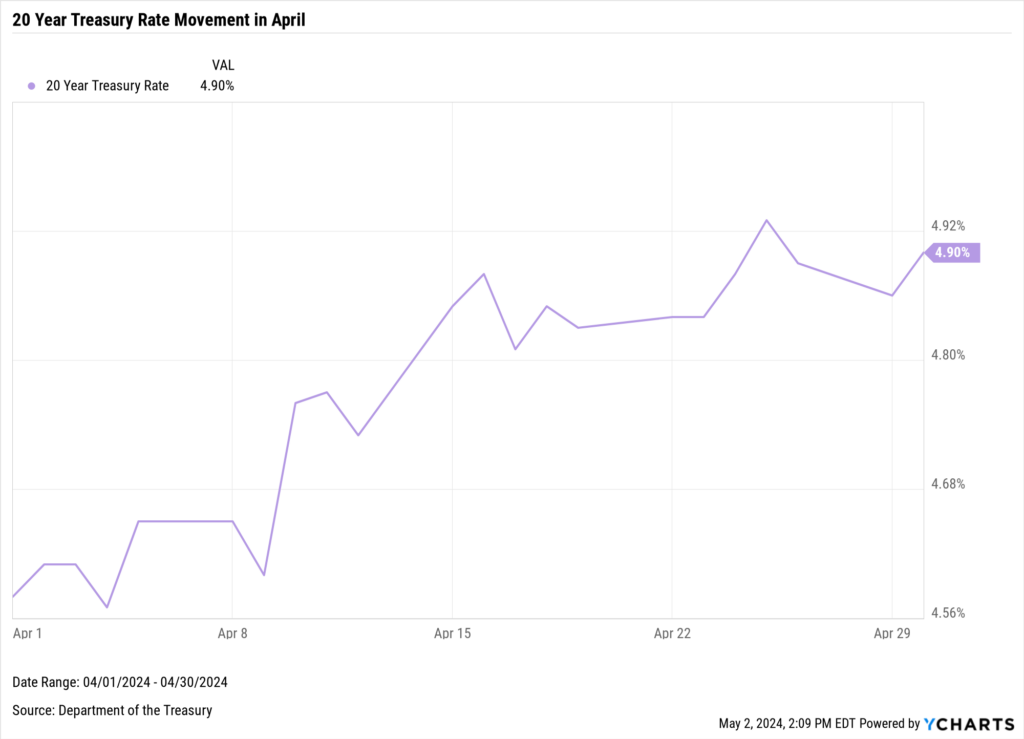
20-Year Treasury Rate Movement in April 2024
The 20-Year Treasury Rate started April at 4.58% and ended the month at 4.90%, up 32 basis points.
Download Visual | Modify in YCharts
Between March 31, 2023 and April 30, 2024 the 20-Year Treasury Rate moved from 3.81% to 4.9%. The average during that time was 4.42%; the 20 Year peaked at 5.3% on October 19, 2023, and the low was 3.66% on April 6, 2023.
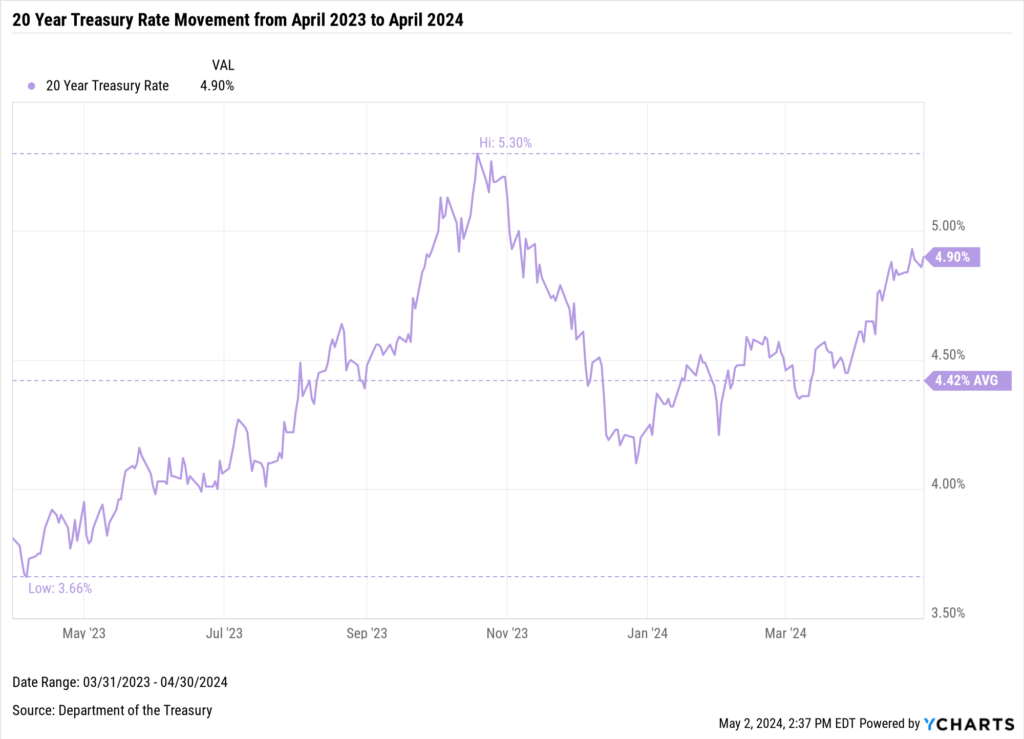
Download Visual | Modify in YCharts
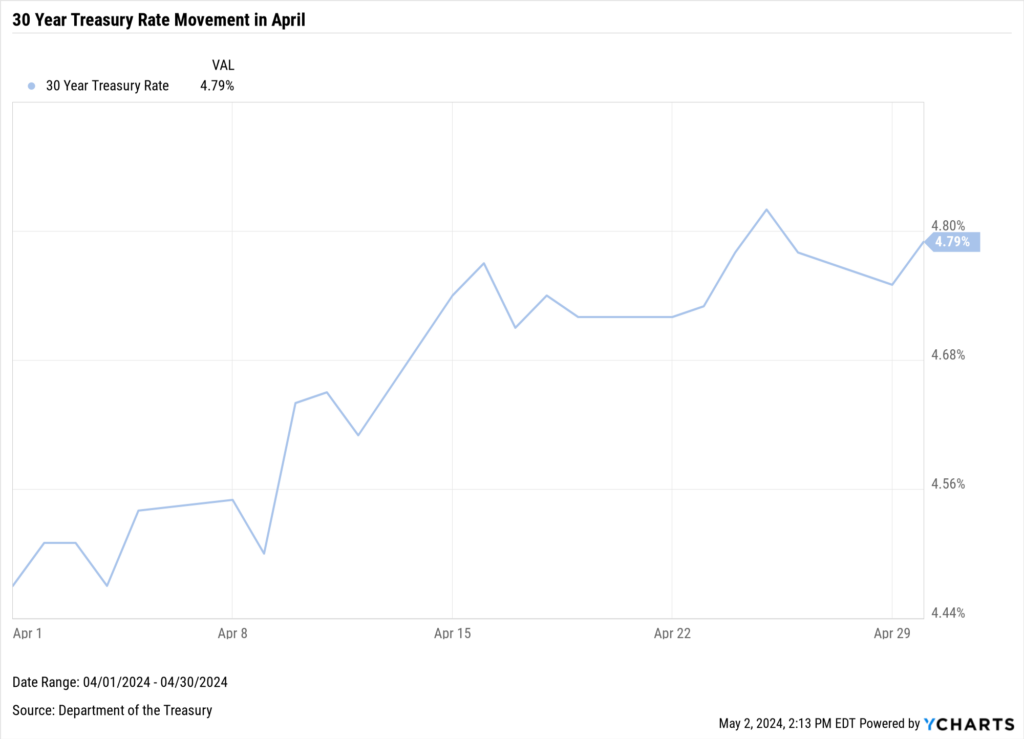
30-Year Treasury Rate Movement in April 2024
The 30-Year Treasury Rate started April at 4.47% and ended the month at 4.79%, up 32 basis points.
Download Visual | Modify in YCharts
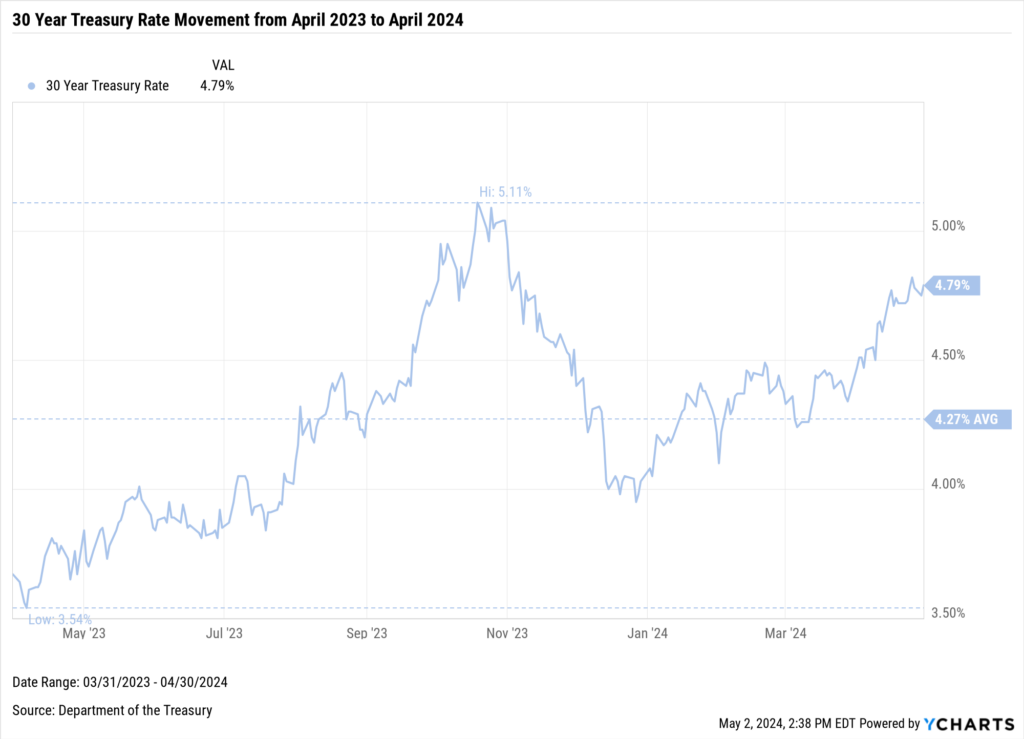
Between March 31, 2023 and April 30, 2024 the 20 Year Treasury Rate moved from 3.81% to 4.79%. The average during that time was 4.27%; the 20 Year peaked at 5.11% on October 19, 2023, and the low was 3.54% on April 6, 2023.
Download Visual | Modify in YCharts
In an environment where expectations for interest rate cuts are changing monthly, asset managers and advisors can leverage Treasury yield data to refine their strategies, better manage risk, and optimize portfolio allocations to align with the evolving economic environment.
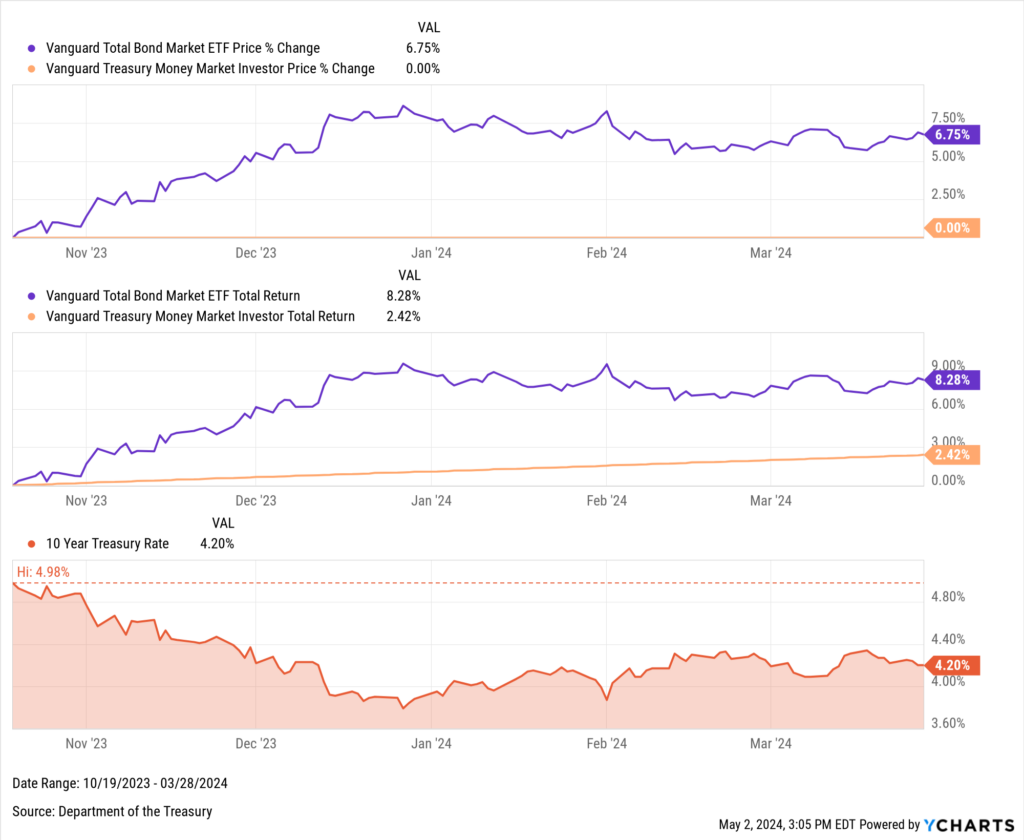
Using YCharts to Illustrate the Value of Moving Out on the Yield Curve
In March 2024, asset managers might’ve got a sign that investors were willing to take on more duration due to the $92B exodus from money market funds.
Leverage YCharts in meetings with advisors to demonstrate why your fund is best positioned to assist their clients in achieving their financial goals. You can get more insights on the potential benefits of extending duration here.
With rates across the yield curve higher than their twelve-month average, you can use a powerful visual to demonstrate the potential for price appreciation when rates peak (or near-peak).
The 10-year peaked in October 2023. From here, you can compare and highlight the potential for price appreciation of your fund with that of a competitor’s to help you win more AUM.
Download Visual | Add Your Fund to This Chart
Whenever you’re ready, there are 3 ways YCharts can help you:
1. Looking for a communication tool to show the impact of monthly market events?
Send us an email at hello@ycharts.com or call (866) 965-7552. You’ll be directly in touch with one of our Chicago-based team members.
2. Want to test out YCharts for free?
Start a no-risk 7-Day Free Trial.
3. Download a copy of the Monthly Market Wrap slide deck:
Disclaimer
©2024 YCharts, Inc. All Rights Reserved. YCharts, Inc. (“YCharts”) is not registered with the U.S. Securities and Exchange Commission (or with the securities regulatory authority or body of any state or any other jurisdiction) as an investment adviser, broker-dealer or in any other capacity, and does not purport to provide investment advice or make investment recommendations. This report has been generated through application of the analytical tools and data provided through ycharts.com and is intended solely to assist you or your investment or other adviser(s) in conducting investment research. You should not construe this report as an offer to buy or sell, as a solicitation of an offer to buy or sell, or as a recommendation to buy, sell, hold or trade, any security or other financial instrument. For further information regarding your use of this report, please go to: ycharts.com/about/disclosure
Next Article
Monthly Market Wrap: April 2024Read More →