Betting on Bonds: Capitalizing on Fixed Income After Rising Rates
In the wake of the Federal Reserve‘s latest interest rate hike in July, interest rates have surged to a range between 5.25% and 5.5%, their highest levels in over two decades.
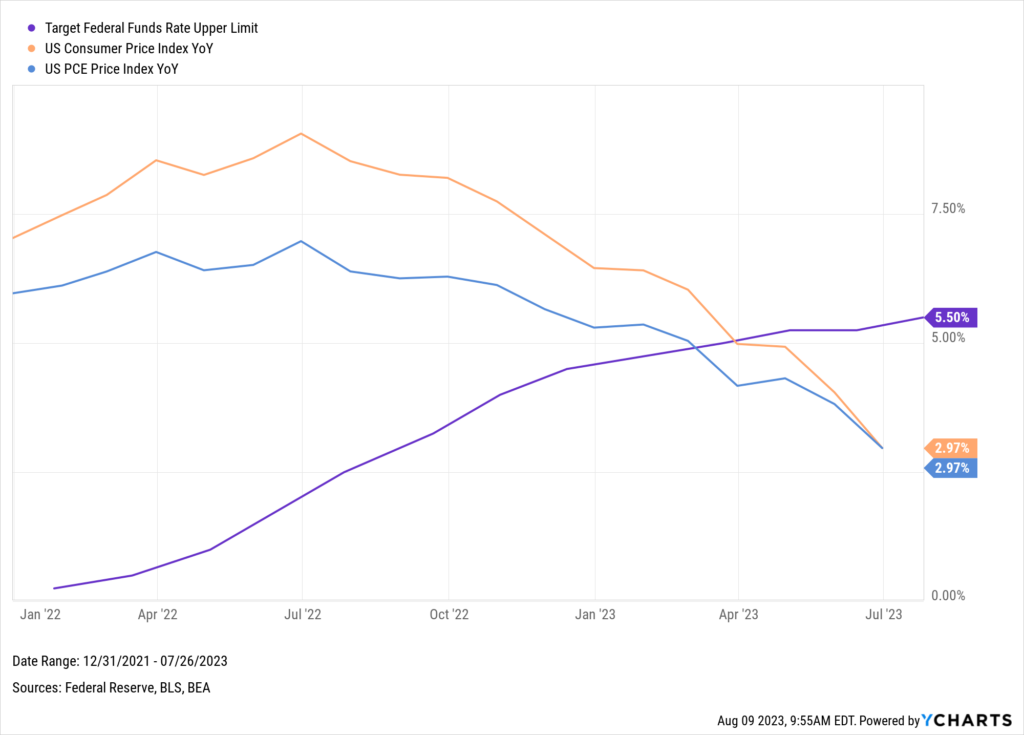
Download Visual | Modify in YCharts
Characteristically, the Fed’s future guidance was vague. However, the Fed Chair, Jerome Powell, was noncommittal regarding future rate changes— a departure from his statements throughout this cycle, where he’s all but guaranteed future hikes. Also, the Federal Open Market Committee (FOMC) shifted its economic outlook, announcing that they no longer anticipate a recession, stating that the economy is expanding at a “moderate” pace.
Despite the Federal Reserve’s acknowledgment of the immense task of reducing inflation to their 2% target, it seems increasingly clear we’re closer to the end of this cycle than the beginning.
(In light of this, we delve into which strategies have proven successful during previous rate hike cycles in our latest white paper: Managing Rising Rate Environments.)
Download the free White Paper to see our full findings:
And if pauses and cuts are on the horizon, an essential question arises: is now the time to shift our focus to fixed income?
Insights from the 2007 Rate Cut Cycle
Recent fund flow data indicates investors are anticipating a pause in rate hikes and are eager to secure higher yields and participate in the fixed-income market’s potential upswing.
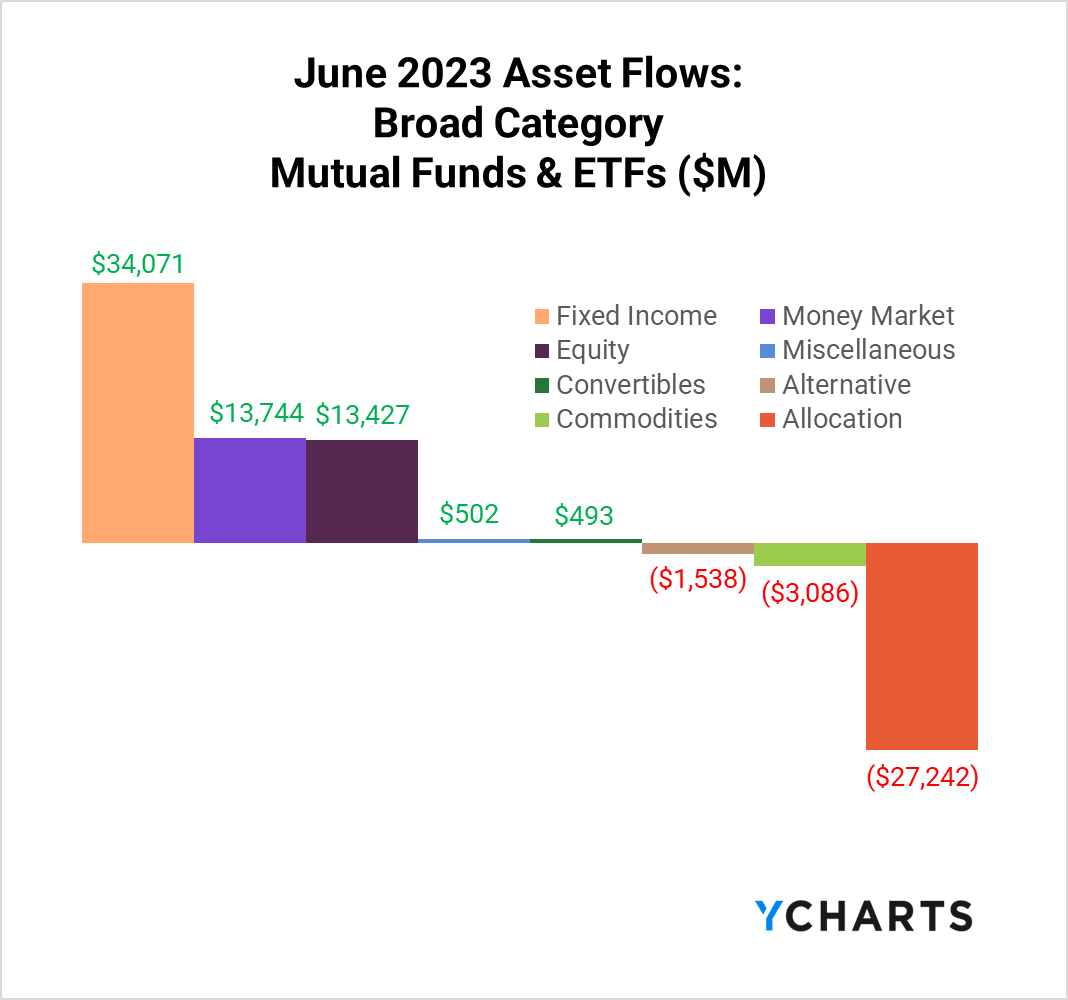
Download the Latest Fund Flow Data
The iShares Core U.S. Aggregate Bond ETF (AGG) offers compelling evidence to support this strategy. In the aftermath of the 2007 rate cut cycle, during the quantitative easing era—which saw rates drop from 5% to 0.5%—the AGG realized an impressive 54.45% surge from May 2006 until the next rate hike in December 2015.
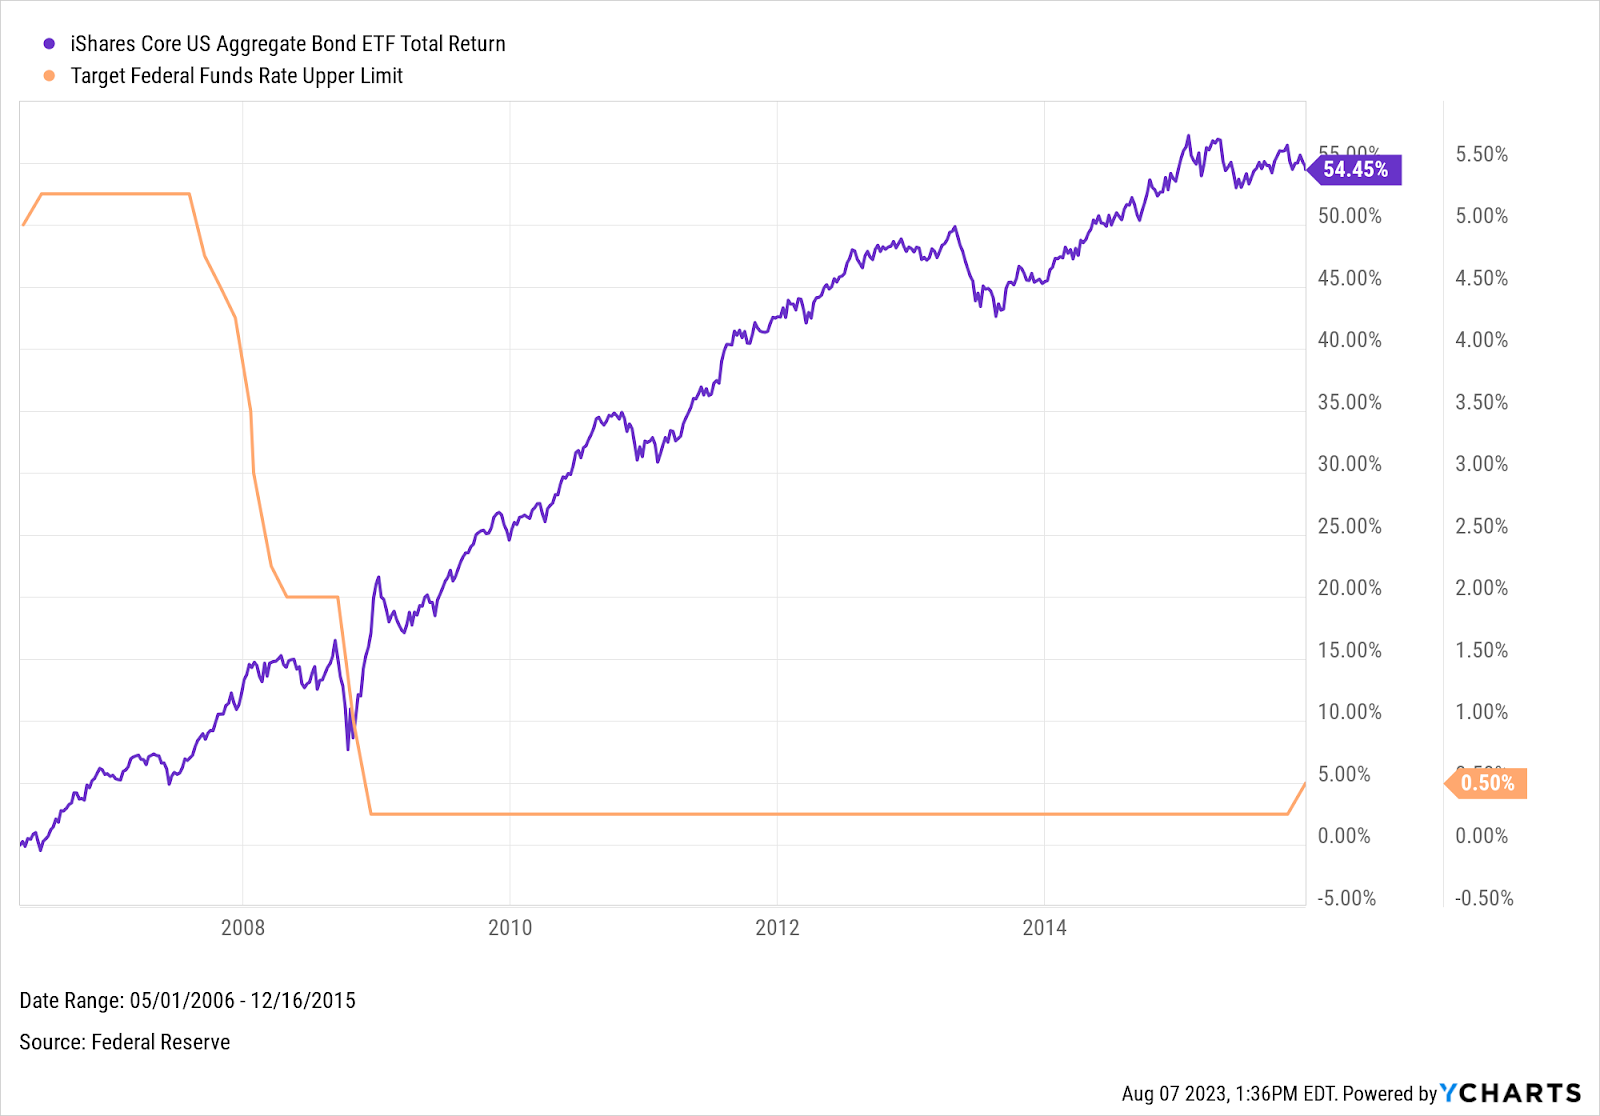
Download Visual | Modify in YCharts
Additionally, a pause or cut in rates instantaneously alters the duration risk an investor should take on.
iShares 1-3 Year Treasury Bond ETF (SHY) was critical in smoothing the investing ride as rates increased. But, compared to longer duration assets like iShares 20+ Year Treasury Bond ETF (TLT) during the last rate cut reveals a nearly 80-percentage point dispersion, favoring TLT.
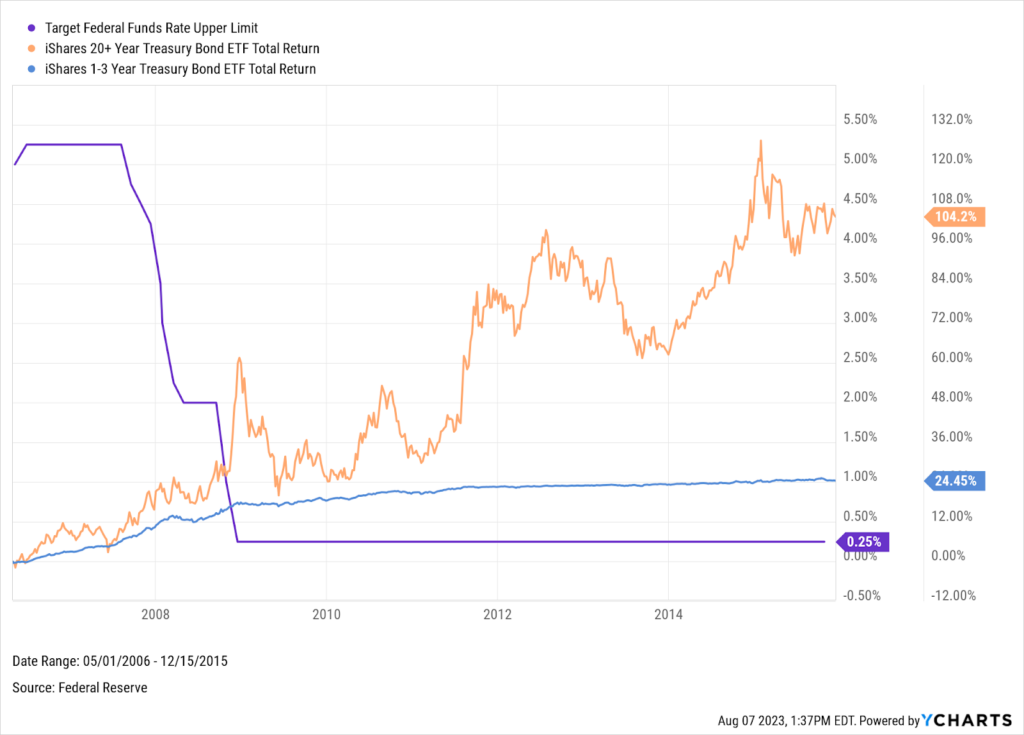
Download Visual | Modify in YCharts
Yield Considerations After A Rate Hike
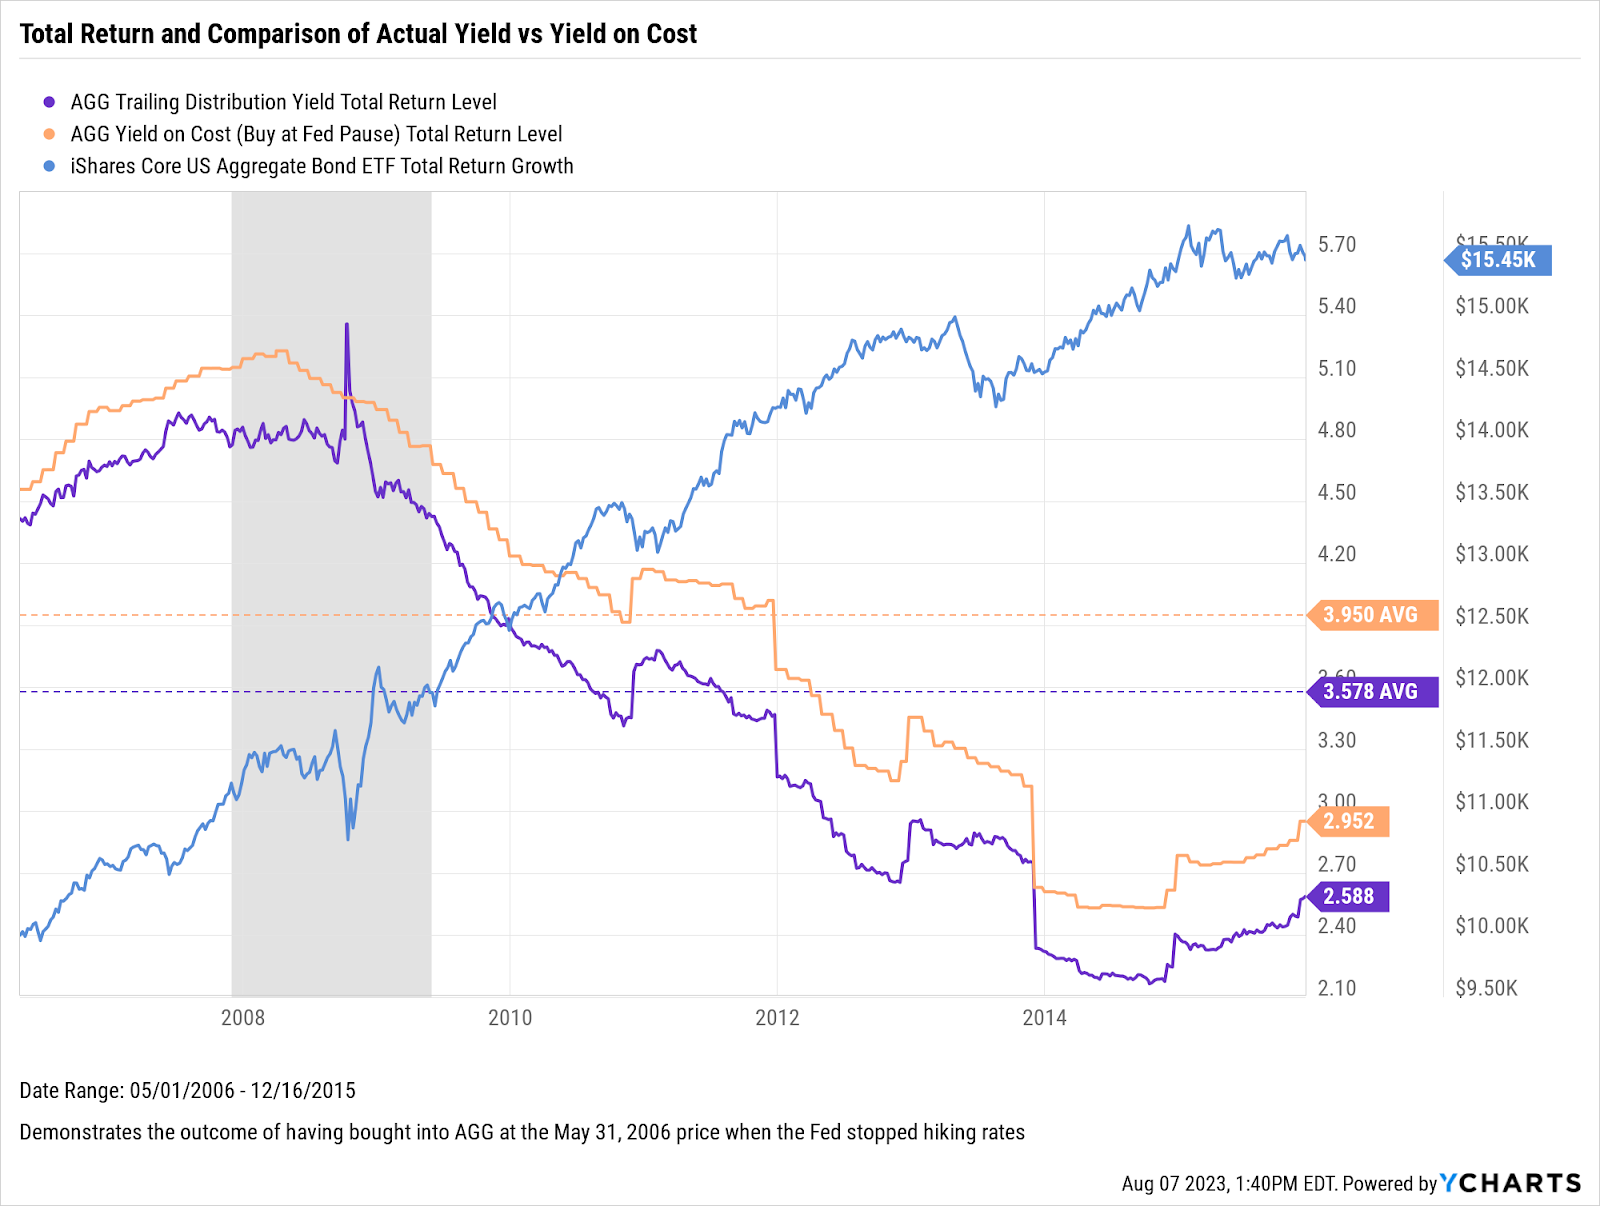
There’s more to consider than just the potential for price appreciation when investing in fixed income during a rate pause or cut. A key factor is a noteworthy divergence between actual and listed yields.
For instance, if an investor purchased AGG on May 31, 2006, at $97.98, when the Fed paused rates, the actual yield on the fund over time would exceed the quoted yield. This discrepancy effectively provides investors ‘more bang for their buck.’
Start a Free Trial to Create Custom Securities
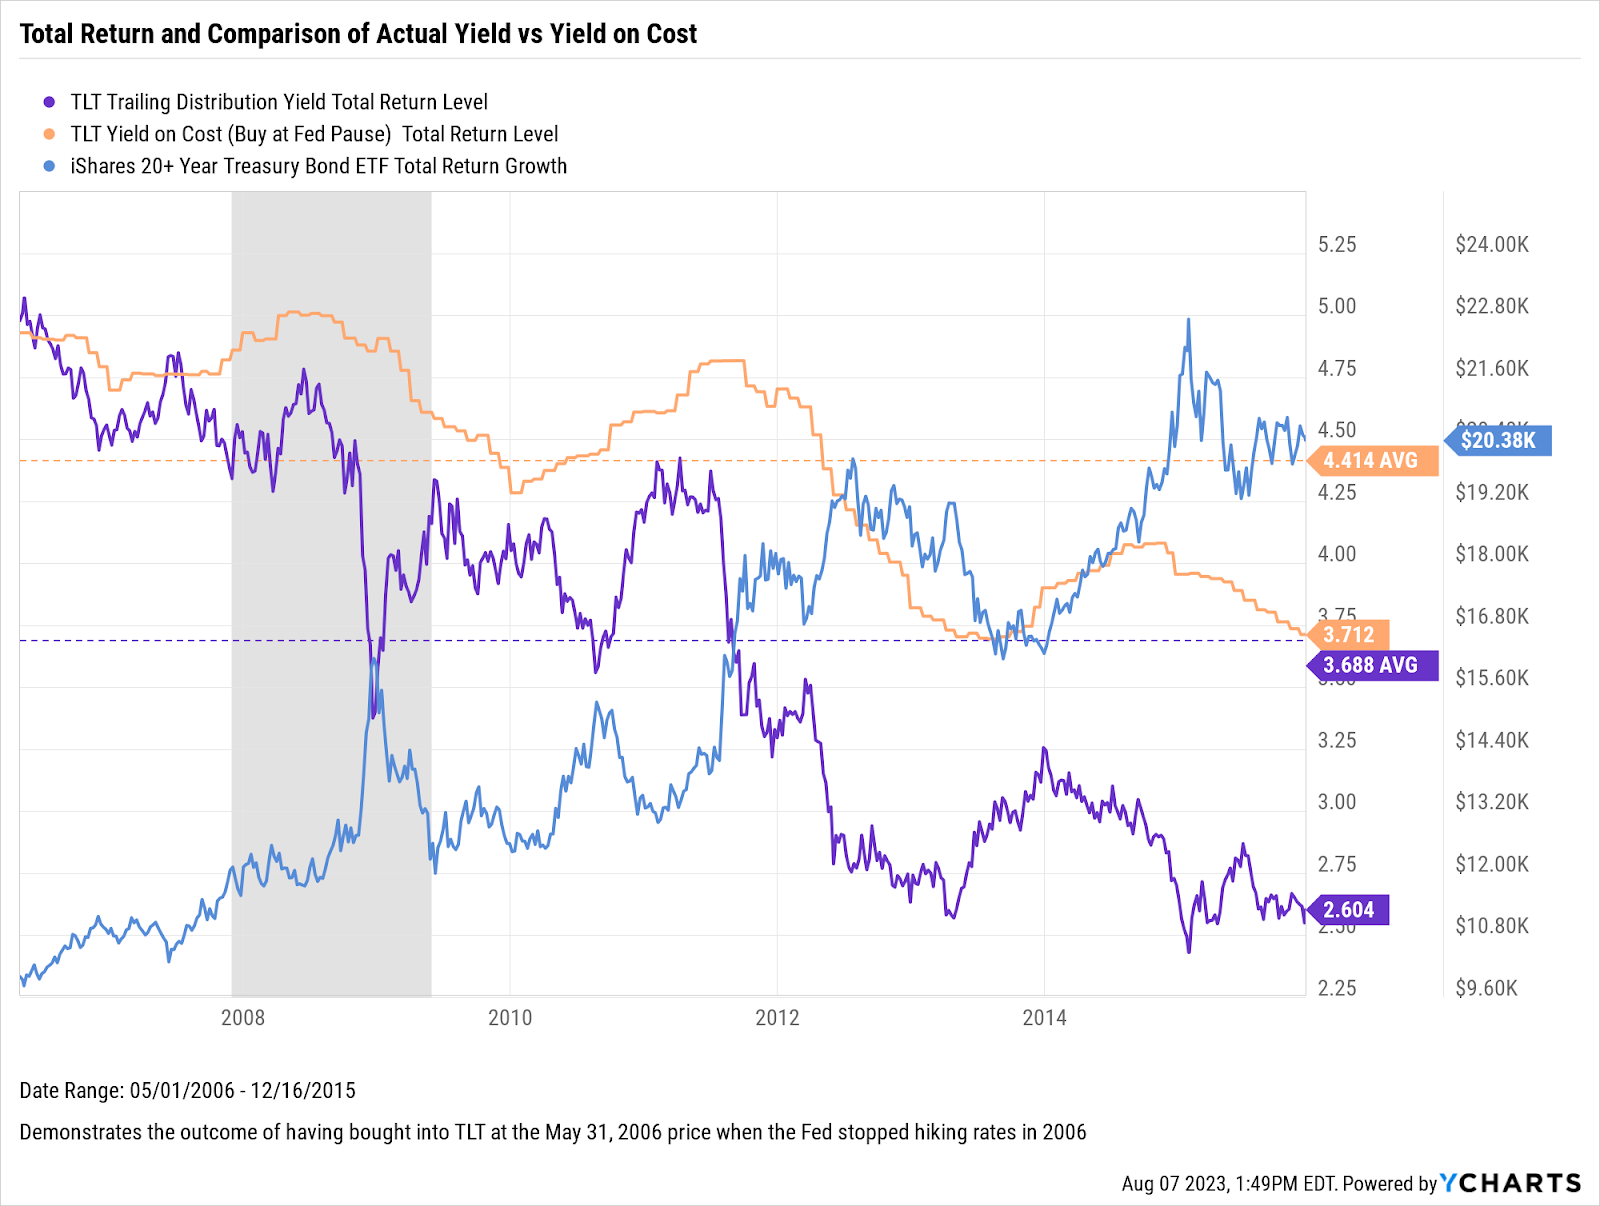
The story of actual yield versus listed yield becomes even more significant when we examine long-term Treasuries. Let’s consider an investor buying TLT on May 31, 2006, this time, there’s a nearly full point spread favoring the actual yield.
Start a Free Trial to Create Custom Securities
This underlines the essential role of timing when leveraging yield discrepancies for better returns.
Getting Clients to Move Money into Fixed Income
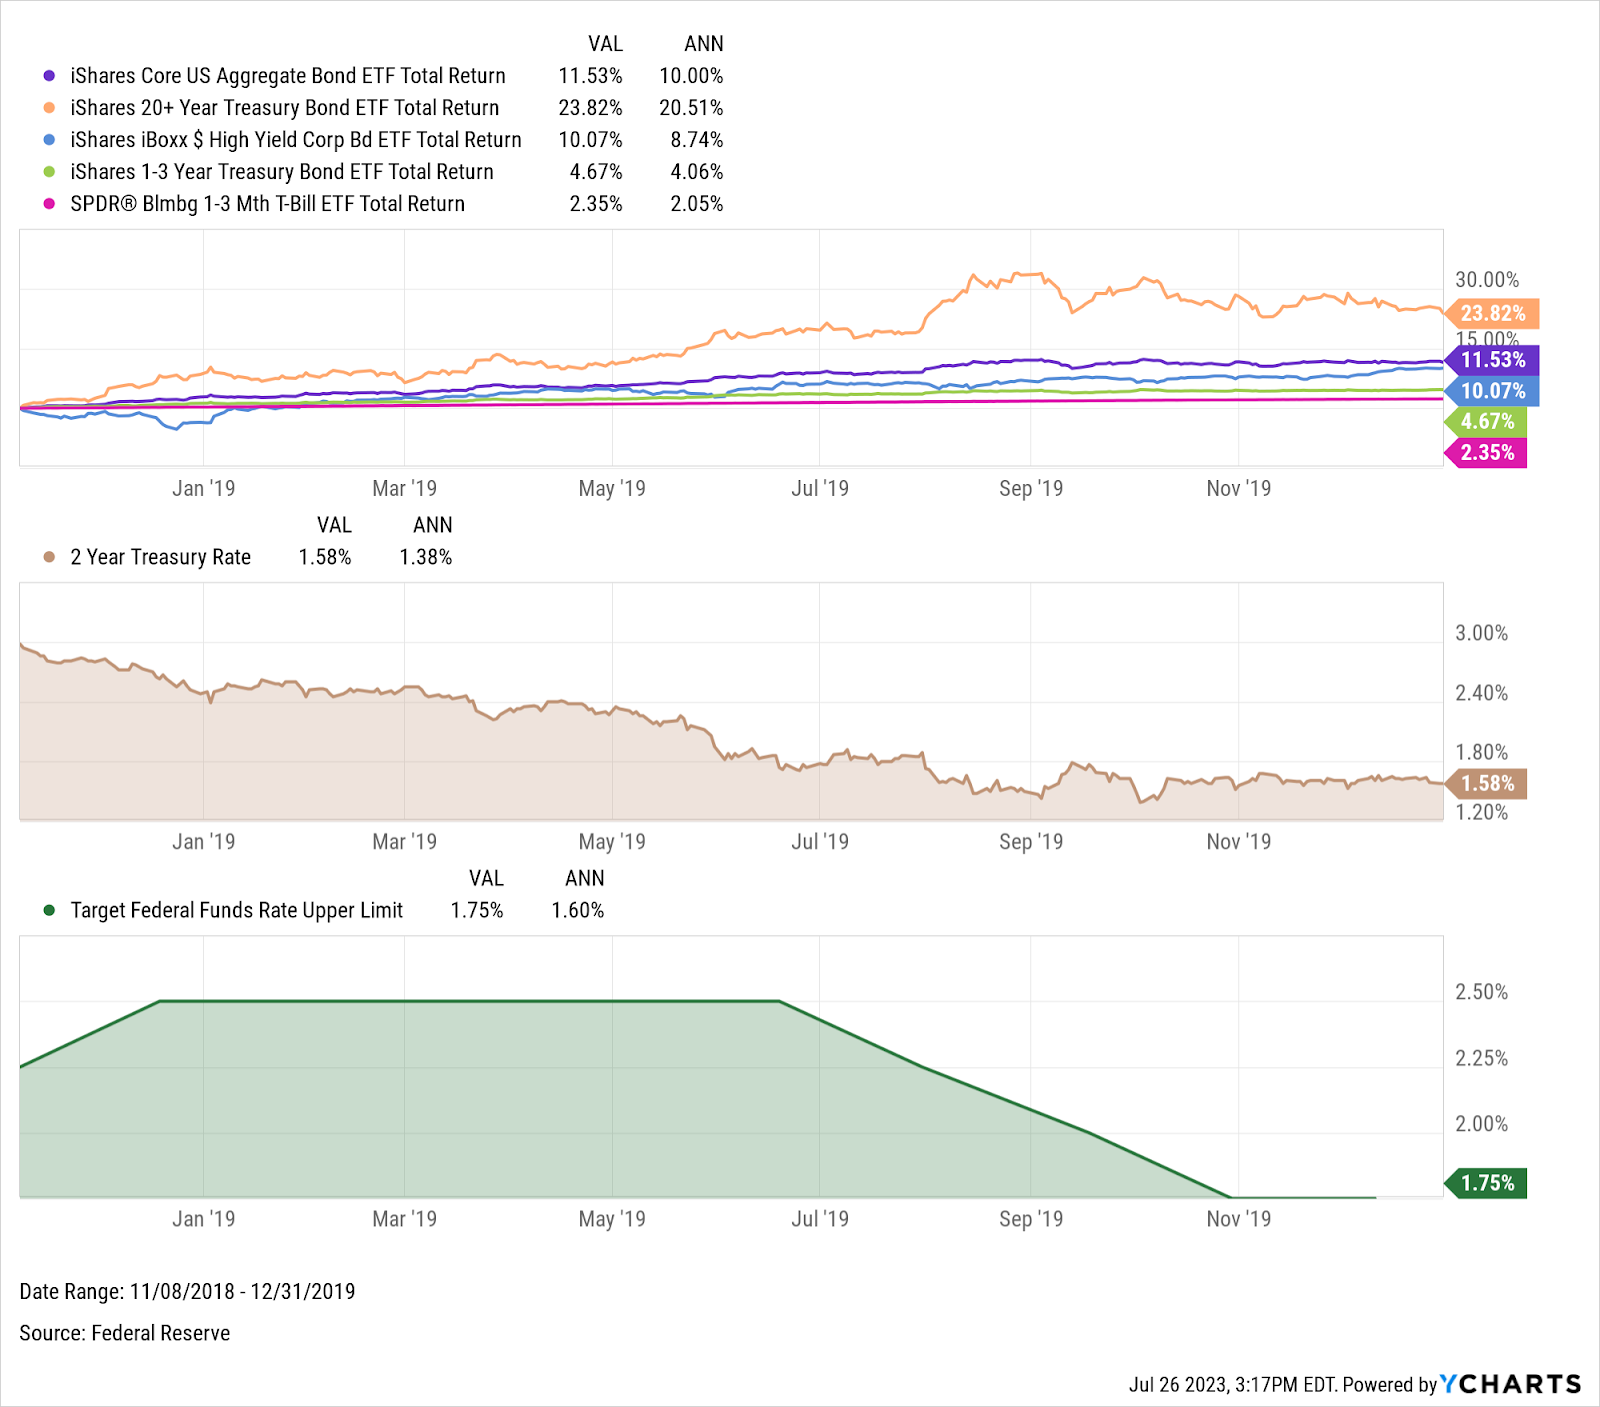
Speaking of timing, another one of history’s windows shows how critical it is regarding the total return of fixed-income investments. A closer look at the rate hike cycle that ended in 2019 suggests that the optimal entry point for investing in fixed income emerged toward the latter stages of that cycle.
Download Visual | Modify in YCharts
In this case, the 2-year Treasury yield peaked at 2.98% in November 2018. However, by July 2019—coinciding with the time of the first cut—the yield had already dropped to 1.72%. Demonstrating that a significant portion of the yield curve adjustment had already taken place even before the Fed made its first rate cut, underscoring the importance of early positioning in fixed-income assets.
When the Federal Reserve signals a pause or an imminent cut in interest rates, it’s often too late to fully capitalize on the yield compression in fixed-income securities. Therefore, investors aiming to maximize their returns from fixed income during these periods should consider positioning themselves before any projected pauses or cuts in interest rates.
Moreover, investing in the AGG during this period would have yielded a return of 11.53%. In contrast, an investor entering at the beginning of the rate cuts would have realized only a 2.28% return, reinforcing the importance of astute timing.
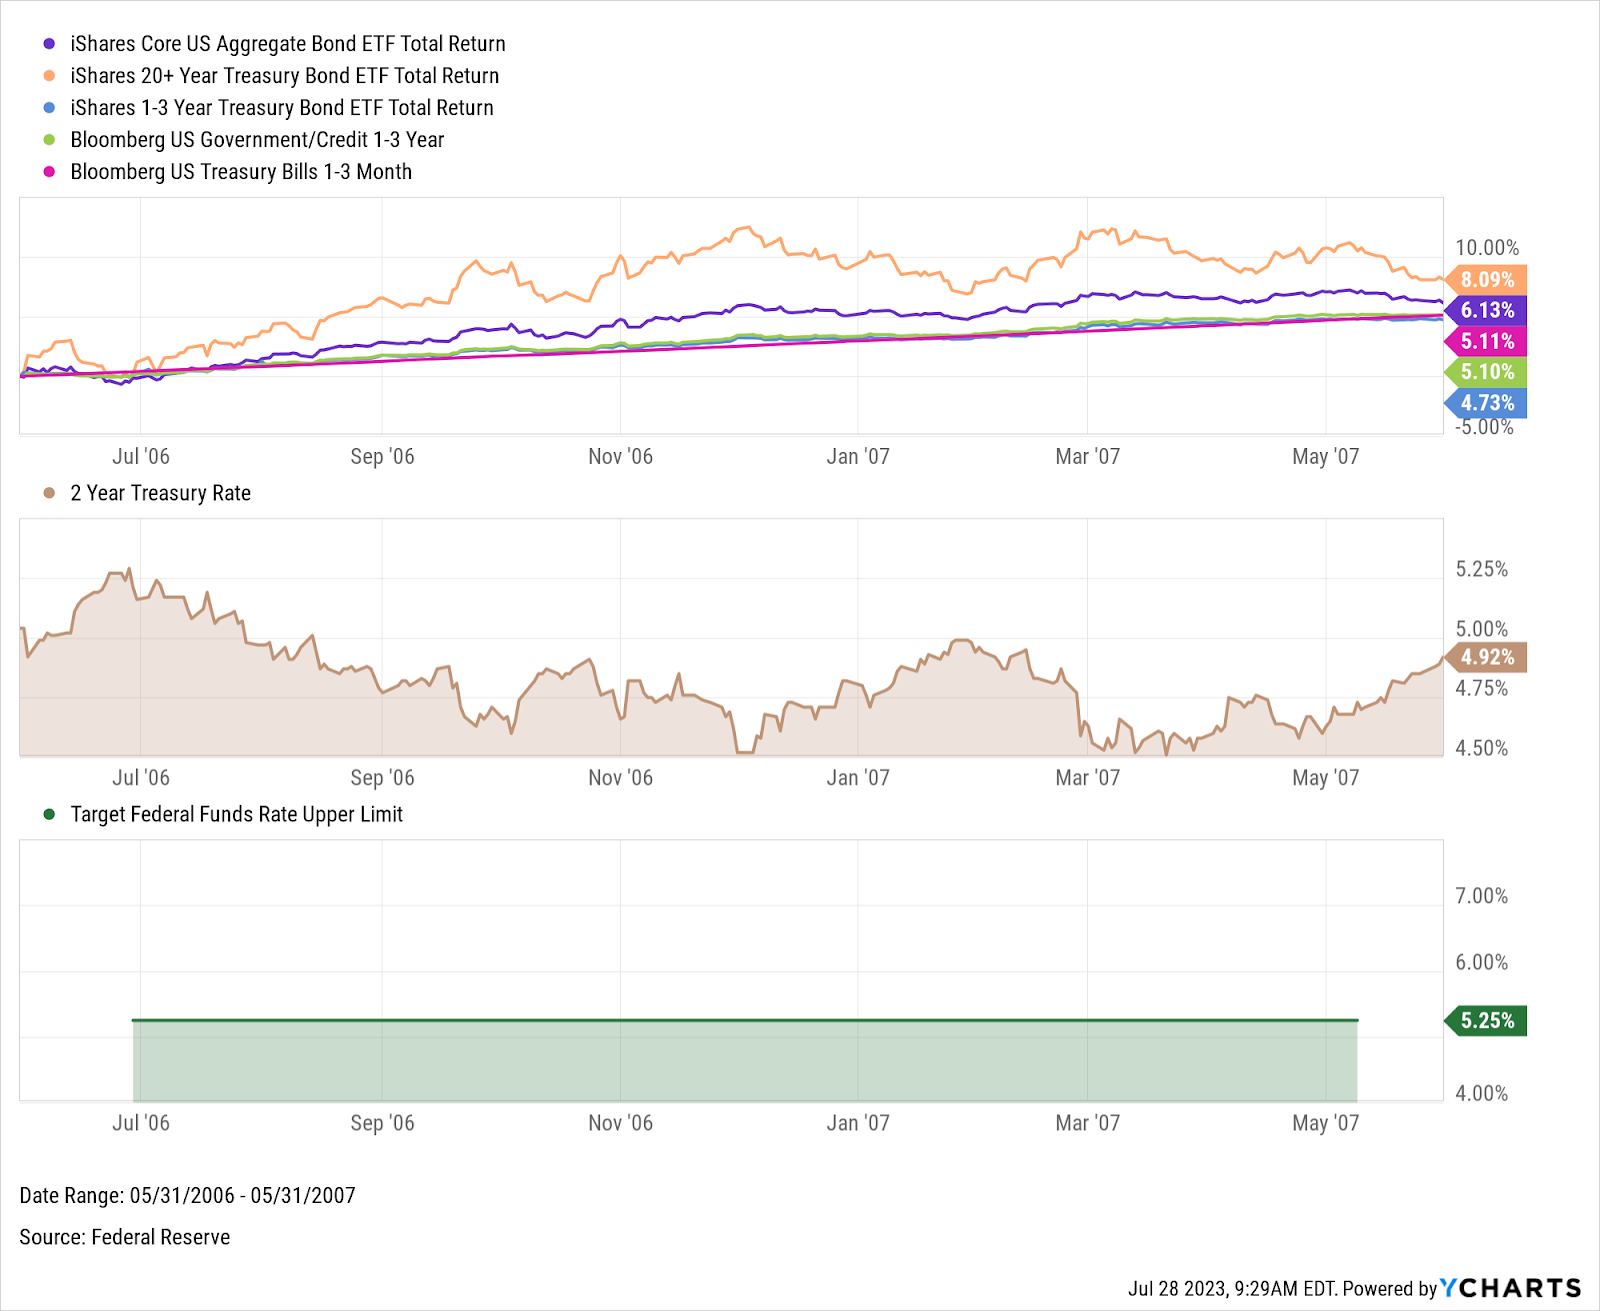
Even if the Fed elects to pause rate hikes instead of cutting them, historically, there’s still been an opportunity cost of keeping money on the sidelines. In the 2006-2007 period leading up to the Global Financial Crisis, the Fed held the federal funds rate steady at 5.25%. Although the 2-year Treasury yield fluctuated somewhat during this period, longer-duration assets surprisingly outperformed cash.
Download Visual | Modify in YCharts
For wholesalers and financial advisors, today might be the ideal opportunity for insightful dialogue with clients. It might be apt to take a closer look at the potential advantages within the fixed-income market.
For financial advisors, this could be the opportune moment to emphasize to clients the strategic importance of timing when considering fixed-income investments and the crucial role these can play within a balanced portfolio. Using Model Portfolios in combination with Fundamental Charts offers visual proof of how your strategy can assist clients in reaching their goals.
Wholesalers are uniquely positioned during this period to offer robust support to advisors, spotlighting the exciting prospects within the fixed-income space. If partnered advisors grapple with FOMO, wholesalers can leverage key tools such as Fund Screeners and Scenarios to research and position their strategies effectively against rival funds as advisors seek to rebalance into fixed-income funds.
Connect with YCharts
To get in touch, contact YCharts via email at hello@ycharts.com or by phone at (866) 965-7552
Interested in adding YCharts to your technology stack? Sign up for a 7-Day Free Trial.
Disclaimer
©2023 YCharts, Inc. All Rights Reserved. YCharts, Inc. (“YCharts”) is not registered with the U.S. Securities and Exchange Commission (or with the securities regulatory authority or body of any state or any other jurisdiction) as an investment adviser, broker-dealer or in any other capacity, and does not purport to provide investment advice or make investment recommendations. This report has been generated through application of the analytical tools and data provided through ycharts.com and is intended solely to assist you or your investment or other adviser(s) in conducting investment research. You should not construe this report as an offer to buy or sell, as a solicitation of an offer to buy or sell, or as a recommendation to buy, sell, hold or trade, any security or other financial instrument. For further information regarding your use of this report, please go to: ycharts.com/about/disclosure
Next Article
Monthly Market Wrap: July 2023Read More →