Monthly Market Wrap: July 2023
Welcome back to the Monthly Market Wrap from YCharts, where we break down the most important trends for advisors and their clients in this monthly market review. As always, feel free to download and share any visuals with clients and colleagues, or on social media.
Speaking of visuals: be sure to download our free Monthly Market Wrap slide deck, containing all charts featured in the Market Wrap + more.
Get the Monthly Market Wrap slide deck sent straight to your inbox. Download Here:July 2023 Market Summary
Stocks continued their steady climb higher in July as the NASDAQ rose 4.1%, the Dow Jones Industrial Average advanced 3.4%, and the S&P 500 tacked on another 3.2%. The NASDAQ is up 37.7% on the year, the S&P 500 20.7%, and the Dow 8.6%. Emerging Markets was the top performer in July at 6.3%, and the Russell 2000 Small Caps index was right behind at 6.1%.
All 11 US stock sectors posted positive returns for the second consecutive month. A double-digit percentage increase in oil prices in July sent the Energy sector 7.8% higher, followed by Communication Services at 5.7% and Financials at 4.8%.
Inflation came in below 3% for the first time in over two years, while July’s Core Inflation reading was below 5% for the first time since November 2021. New and Existing Home Sales both fell in July, but Existing Home Prices went in the opposite direction. Brent and WTI crude oil both jumped over 10% higher MoM in July, forcing retail gas prices higher as well.
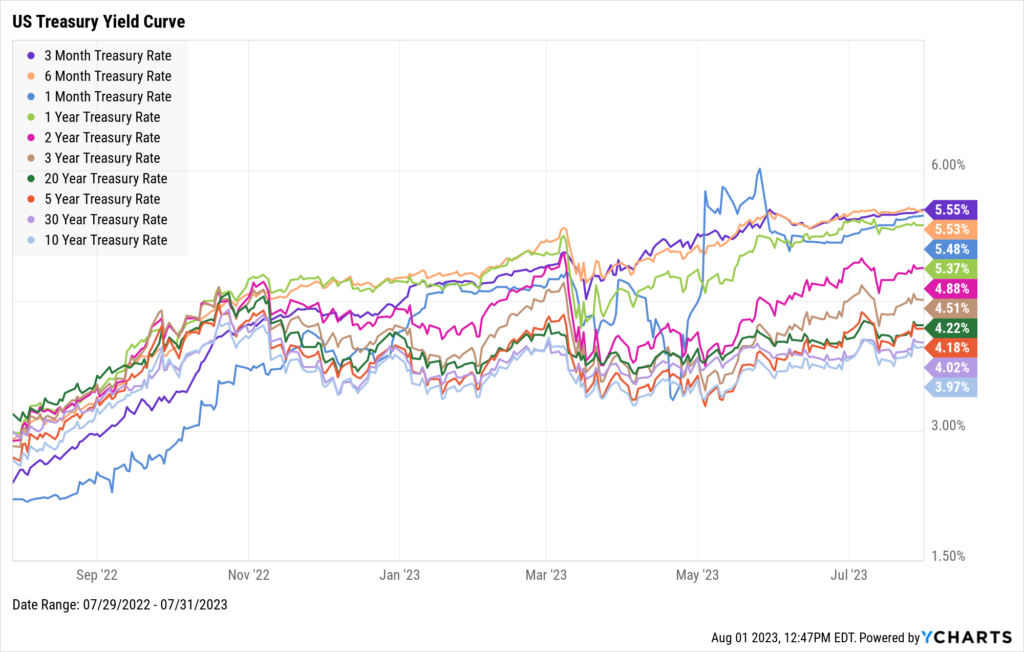
In stark contrast to last month, short and long-term US Treasury yields shot higher in July while the middle of the yield curve spectrum was largely unchanged. The 1-Month and 3-Month Treasury Bills increased by 24 and 12 basis points, respectively. The 10-Year and 20-Year both rose by 16 basis points, while the 30-Year notched 17 basis points higher. 2-Year, 3-Year, and 5-Year notes rose by no more than 5 basis points each, while the 1-Year fell by 3 bps.
Jump to Fixed Income Performance
Want access to full-year charts and data as well? Download our Monthly Market Wrap Slide Deck for more:Off the YCharts! The Nasdaq’s Special Rebalancing
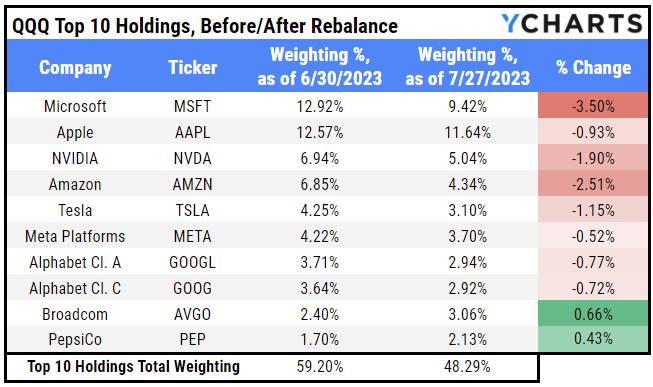
On July 24th, Nasdaq conducted a “special rebalancing” of its tech-concentrated and widely-tracked Nasdaq 100 index. The index is typically rebalanced each quarter, but according to Nasdaq, it can employ a special rebalance “to address overconcentration in the index by redistributing the weights.”
Invesco’s heavily-traded QQQ Trust (QQQ) tracks the Nasdaq 100. Of the ETF’s top 10 holdings, Microsoft (MSFT) and Amazon (AMZN) saw their weightings reduced the most as a result of the rebalancing, while Broadcom (AVGO) and PepsiCo (PEP) gained shares. Overall, these ten stocks now comprise 48.29% of “the Qs”, down from 59.20% as of 6/30/2023.
Equity Performance
Major Indexes
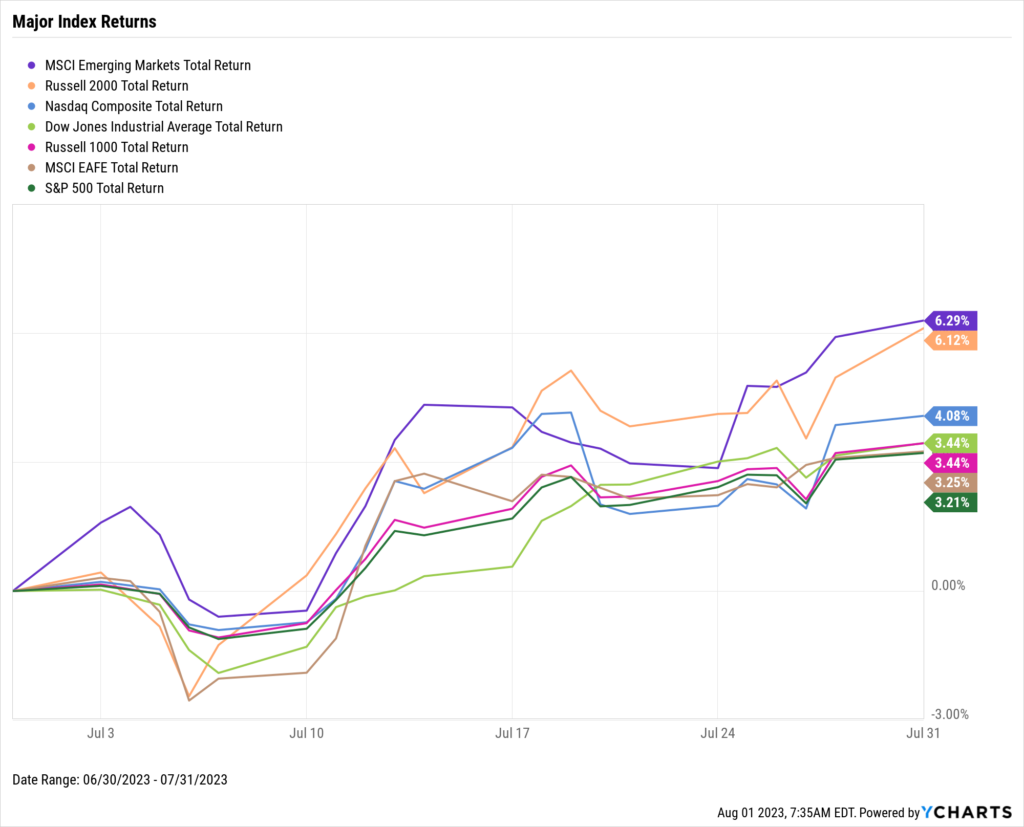
Download Visual | Modify in YCharts | View Below Table in YCharts
Value vs. Growth Performance, Trailing Twelve Months
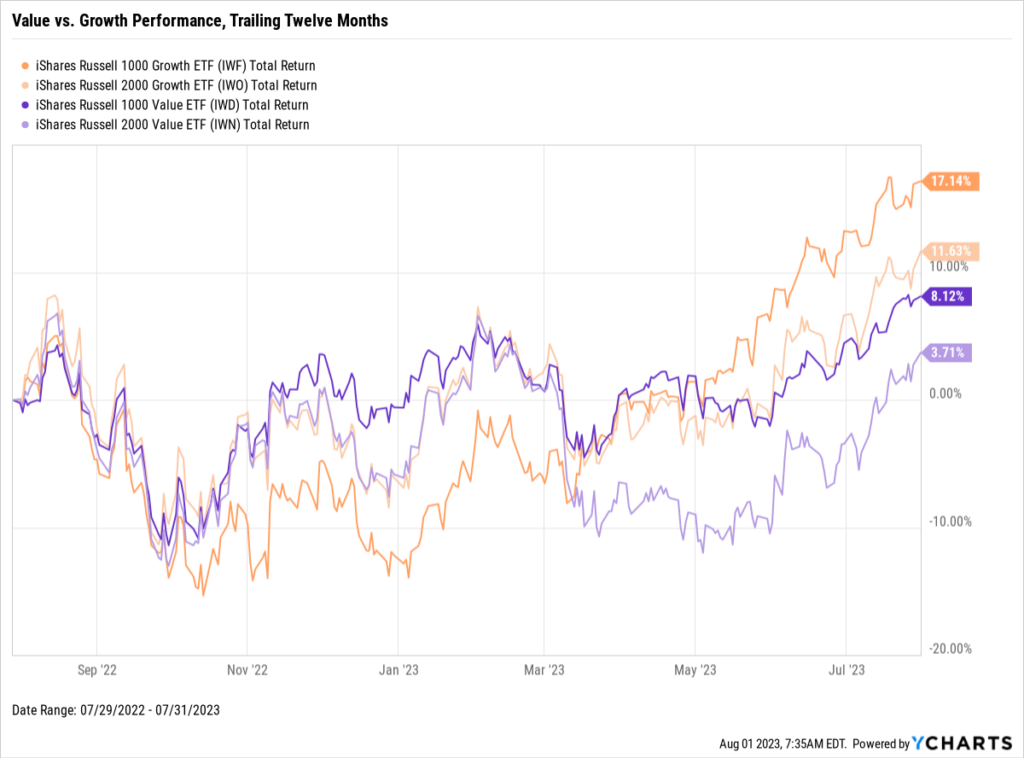
Download Visual | Modify in YCharts | View in Comp Tables
US Sector Movement
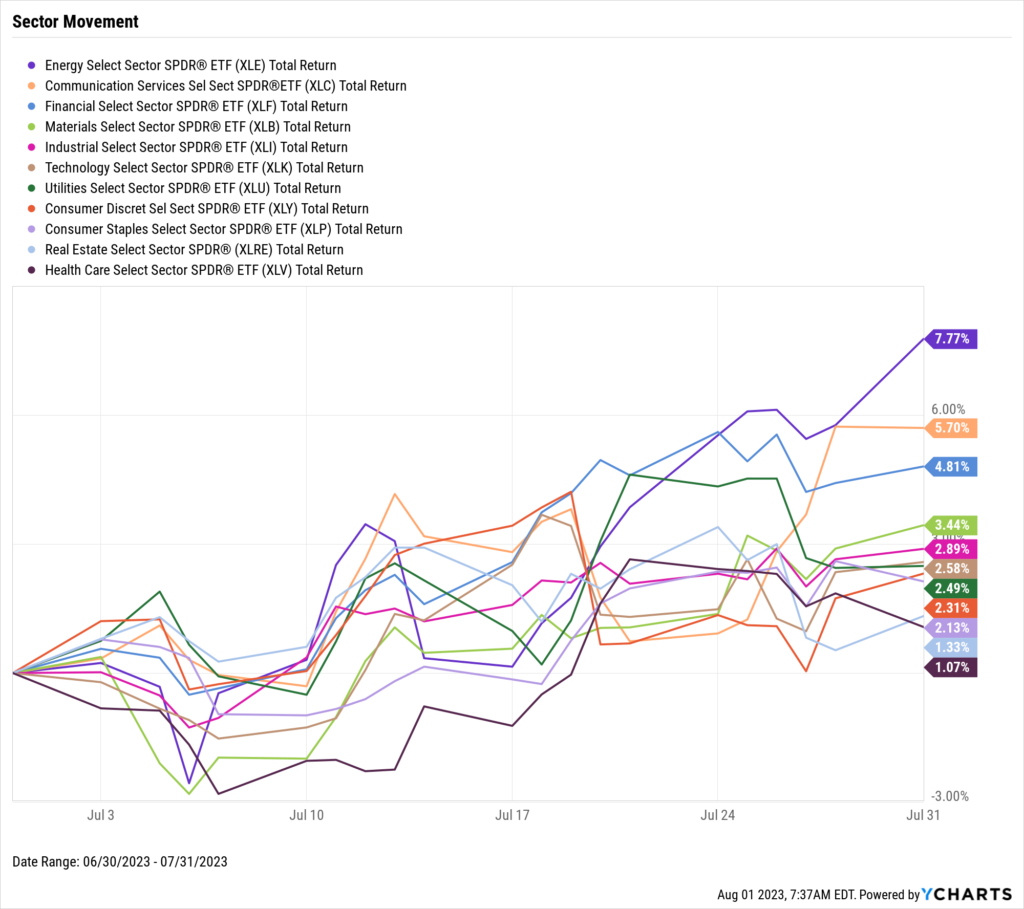
Download Visual | Modify in YCharts | View Below Table in YCharts
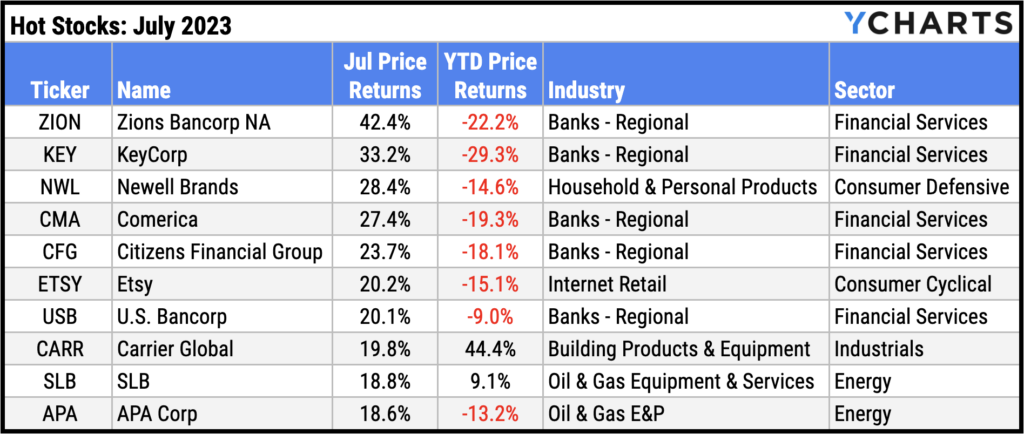
Hot Stocks: Top 10 S&P 500 Performers of July 2023
- Zions Bancorp NA (ZION): 42.4% gain in July
- KeyCorp (KEY): 33.2%
- Newell Brands (NWL): 28.4%
- Comerica (CMA): 27.4%
- Citizens Financial Group (CFG): 23.7%
- Etsy (ETSY): 20.2%
- U.S. Bancorp (USB): 20.1%
- Carrier Global (CARR): 19.8%
- SLB (SLB): 18.8%
- APA Corp (APA): 18.6%
Download Visual | Modify in YCharts
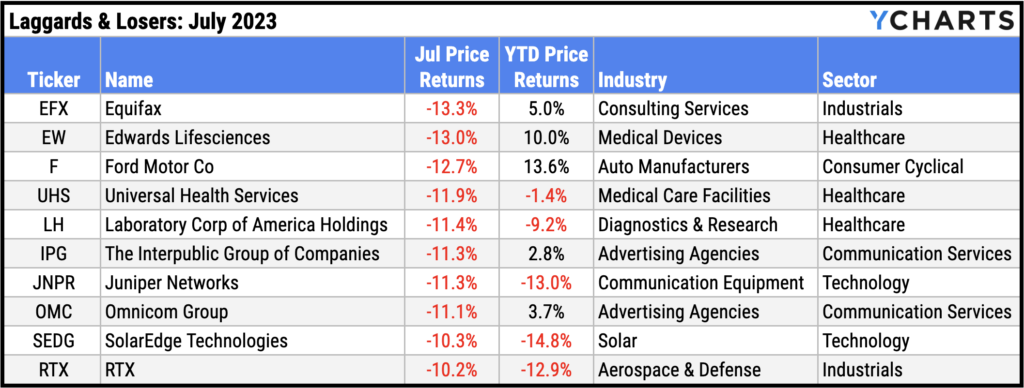
Laggards & Losers: 10 Worst S&P 500 Performers of July 2023
- Equifax (EFX): -13.3% decline in July
- Edwards Lifesciences (EW): -13.0%
- Ford Motor Co (F): -12.7%
- Universal Health Services (UHS): -11.9%
- Laboratory Corp of America Holdings (LH): -11.4%
- The Interpublic Group of Companies (IPG): -11.3%
- Juniper Networks (JNPR): -11.3%
- Omnicom Group (OMC): -11.1%
- SolarEdge Technologies (SEDG): -10.3%
- RTX (RTX): -10.2%
Download Visual | Modify in YCharts
Featured Market & Advisor News
Survey Shows A Move Away From Professional Financial Advice (FA-Mag)
The Magnificent Seven Stocks: Mid-Year Review (YCharts)
401(k)s a better recruiting tool than cash, study says (InvestmentNews)
Winners & Losers from the Dot Com Bubble Rate Hike Cycle (YCharts)
30M People Joined Threads Overnight. Will Advisors Get on Board? (WealthManagement.com)
Economic Update – Reviewing Q2 2023 (YCharts)
Economic Data
Employment
June’s unemployment rate came in at 3.6%, one-tenth of a percentage point lower MoM. The labor force participation rate remained unchanged at 62.6% for the fourth straight month. 209,000 jobs were added to the economy in June, falling a bit short of expectations. Economists forecasted 240,000 nonfarm payrolls for June.
Consumers and Inflation
US Inflation fell below 3% for the first time since March 2021, clocking in at 2.97%. Core Inflation fell below 5% for the first time since November 2021, coming in at 4.83% for June. The US Consumer Price Index rose a slight 0.18% in June, though MoM US Personal Spending grew at a higher rate of 0.55%. Additionally, the Federal Reserve resumed hiking the Target Federal Funds Rate at its July 26th meeting, raising the benchmark interest rate by 25 basis points to 5.50%. This marked the 11th rate hike in the last 12 Fed meetings.
Production and Sales
The US ISM Manufacturing PMI leveled off slightly in July, rising 0.4 points to 46.4. However, the key manufacturing index remains firmly in contraction territory. US Retail and Food Services Sales rose 0.19% MoM, and the YoY US Producer Price Index rose only 0.13% in June, its smallest monthly change since August 2020.
Housing
US New Single-Family Home Sales contracted 2.5% in June, while US Existing Home Sales sank 3.3%. Despite the down month for home sales, the Median Sales Price of Existing Homes climbed 3.5% to $410,200. Mortgage rate increases were largely negligible in July; 15-Year and 30-Year Mortgage Rates closed out the month at 6.11% and 6.81%, respectively.
Commodities
The price of Gold increased by $40 an ounce in July, up from $1,912.30 to $1,954.30. Oil prices climbed all throughout July; the price of WTI per barrel surged 11.5% to $78.81 and Brent rose 10.8% to $82.53. Higher oil prices caused the average price of regular gas to rise 18 cents per gallon in July to $3.87 at month’s end.
Cryptocurrencies
Following a strong June for crypto, the price of Bitcoin pulled back by 3.9% to $29,277.76 as of July 31st. However, Ethereum posted a slight 0.5% gain, ending July at $1,861.87. Bitcoin is up 75.9% YTD, and Ethereum is 55.0% higher on the year.
Fixed Income
US Treasury Yield Curve
1 Month Treasury Rate: 5.48%
3 Month Treasury Rate: 5.55%
6 Month Treasury Rate: 5.53%
1 Year Treasury Rate: 5.37%
2 Year Treasury Rate: 4.88%
3 Year Treasury Rate: 4.51%
5 Year Treasury Rate: 4.18%
10 Year Treasury Rate: 3.97%
20 Year Treasury Rate: 4.22%
30 Year Treasury Rate: 4.02%
Download Visual | Modify in YCharts
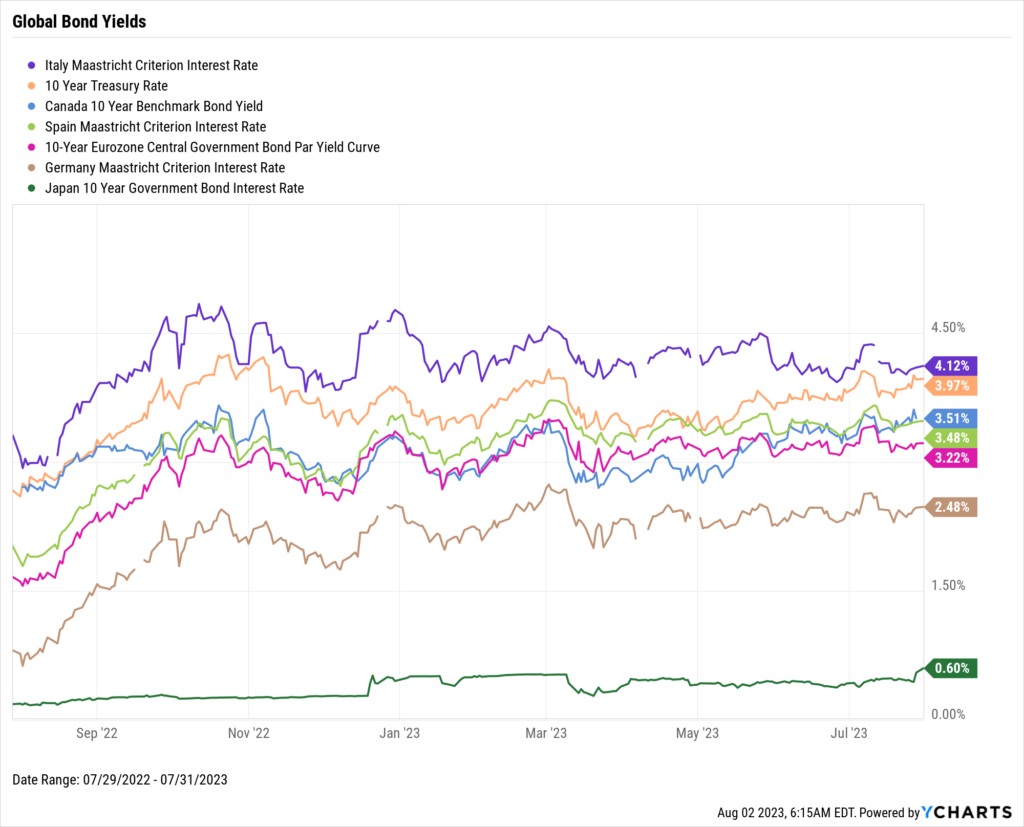
Global Bonds
Italy Long Term Bond Interest Rate: 4.12%
10 Year Treasury Rate: 3.97%
Canada 10 Year Benchmark Bond Yield: 3.51%
Spain Long Term Bond Interest Rate: 3.48%
10-Year Eurozone Central Government Bond Par Yield: 3.22%
Germany Long Term Bond Interest Rate: 2.48%
Japan 10 Year Government Bond Interest Rate: 0.43%
Download Visual | Modify in YCharts
Have a great August! 📈
Get the Monthly Market Wrap slide deck sent straight to your inbox. Download Here:Next Article
How to Tailor Financial Advice with the Scenarios ToolRead More →