Economic Update — Reviewing Q2 2023
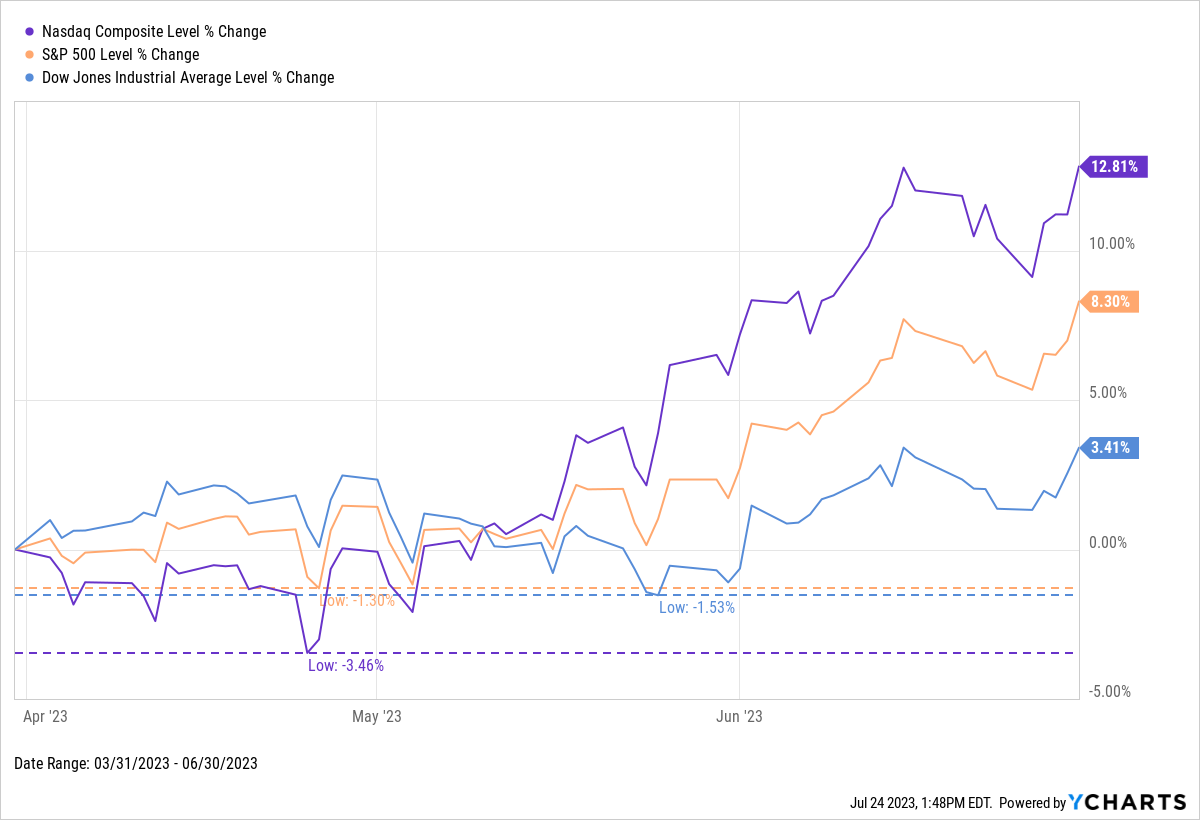
The first half of the year is officially in the rearview mirror, and so far, stocks have posted an impressive performance. The NASDAQ led the way with a 12.81% surge in the quarter, the S&P 500 rose 8.3%, and the Dow Jones saw a 3.41% gain.
The continued rise in stocks in the quarter marked the start of a new bull market, with the S&P 500 now up 24.42% from its October 12, 2022 low.
Download Visual | Modify in YCharts
Below is a sneak peek of insights from the YCharts Q2 2023 Economic Summary Deck. The deck, published quarterly, arms advisors and investors with key insights from the previous quarter to help you make smarter investment decisions going forward. Visuals can also be copied from the deck for your preferred use.
Download the free Economic Summary Deck:The Effect of Skyrocketing Mortgage Rates on the Market
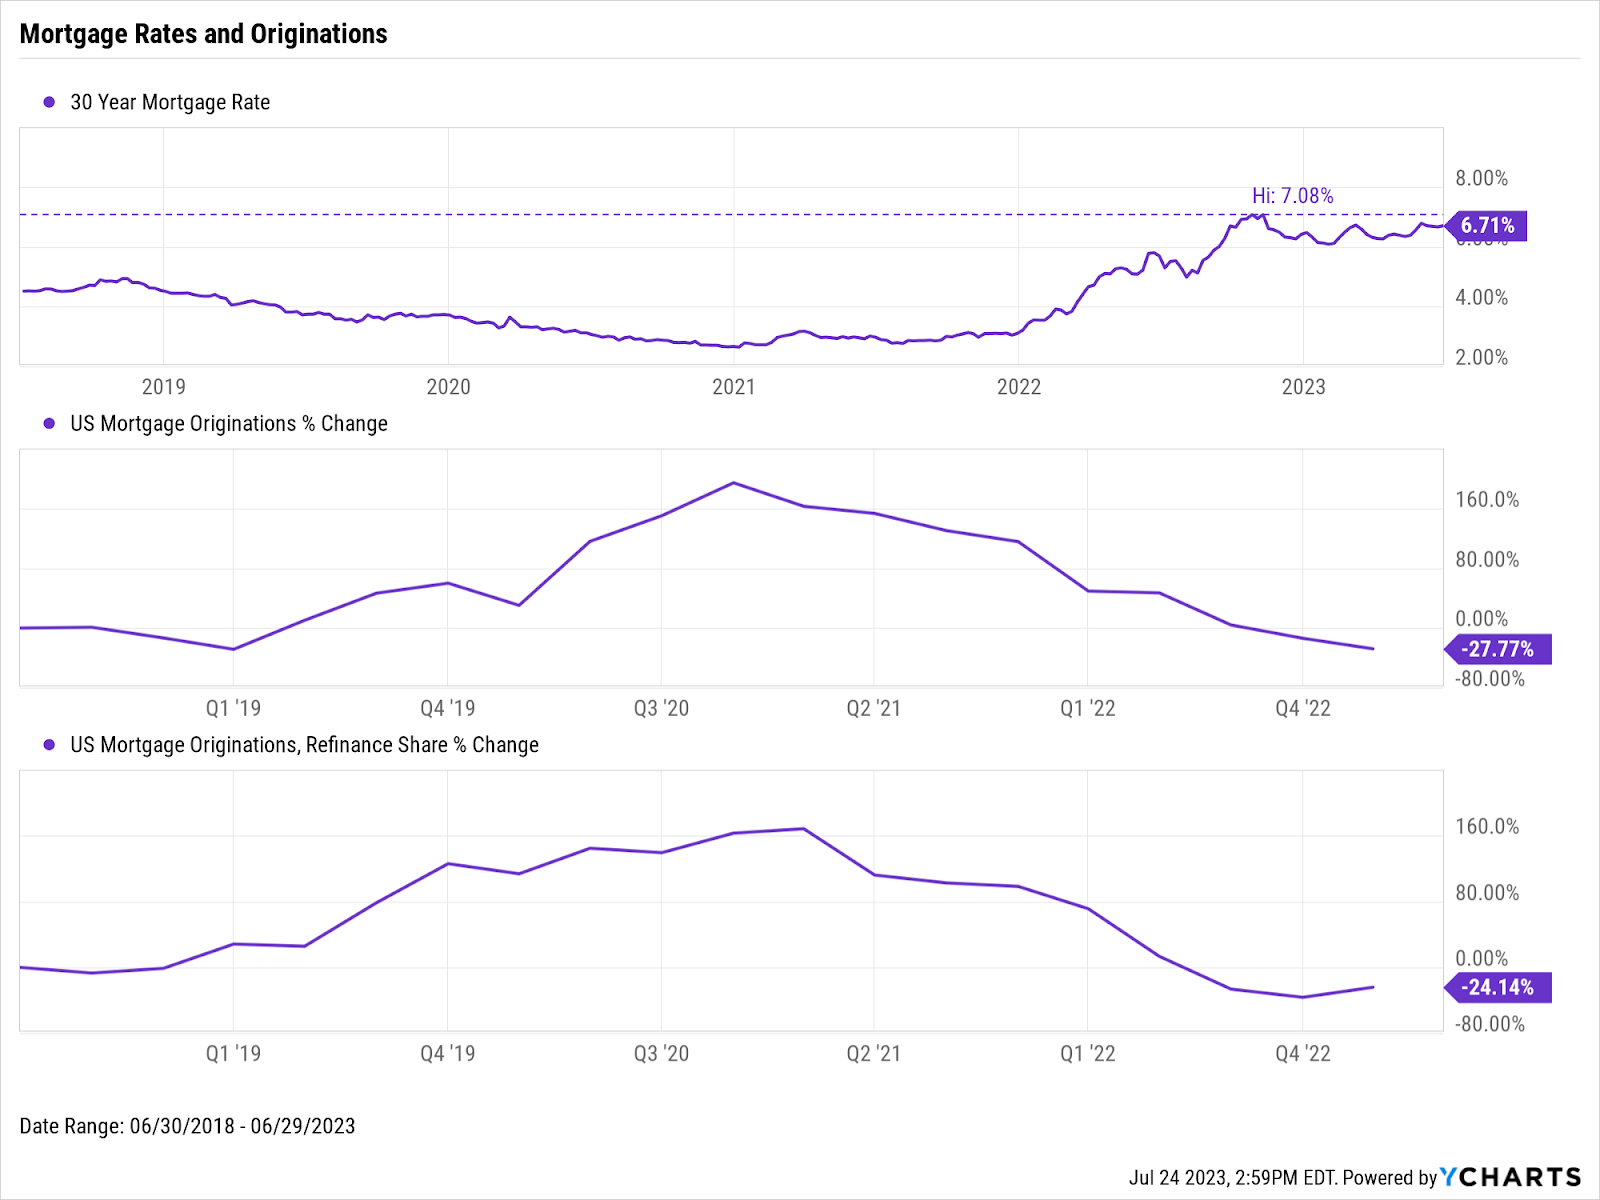
The ongoing cycle of interest rate hikes by the Federal Reserve has triggered significant ripple effects throughout the real estate market. This impact has been felt not only in commercial office spaces but also in the residential mortgage sector. 2021 was marked by 30-year mortgage rates falling to their lowest in decades. However, that situation quickly reversed.
Mortgage rates have skyrocketed, with the 30-year rate peaking at 7% at the conclusion of 2022 before descending slightly to 6.71% by the end of Q2 2023. This abrupt increase has led to a significant downturn in mortgage originations and refinances.
Download Visual | Modify in YCharts
Nevertheless, there’s a silver lining in the housing market. According to data from the National Association of Home Builders (NAHB) and Wells Fargo, current and near-future predictions suggest a rebound in home sales, which are recovering from a dip seen in the final quarter of 2022. This resurgence carries significant weight, as the real estate sector represents a vital component of the economy that the Federal Reserve closely monitors when making rate decisions.

Download Visual | Modify in YCharts
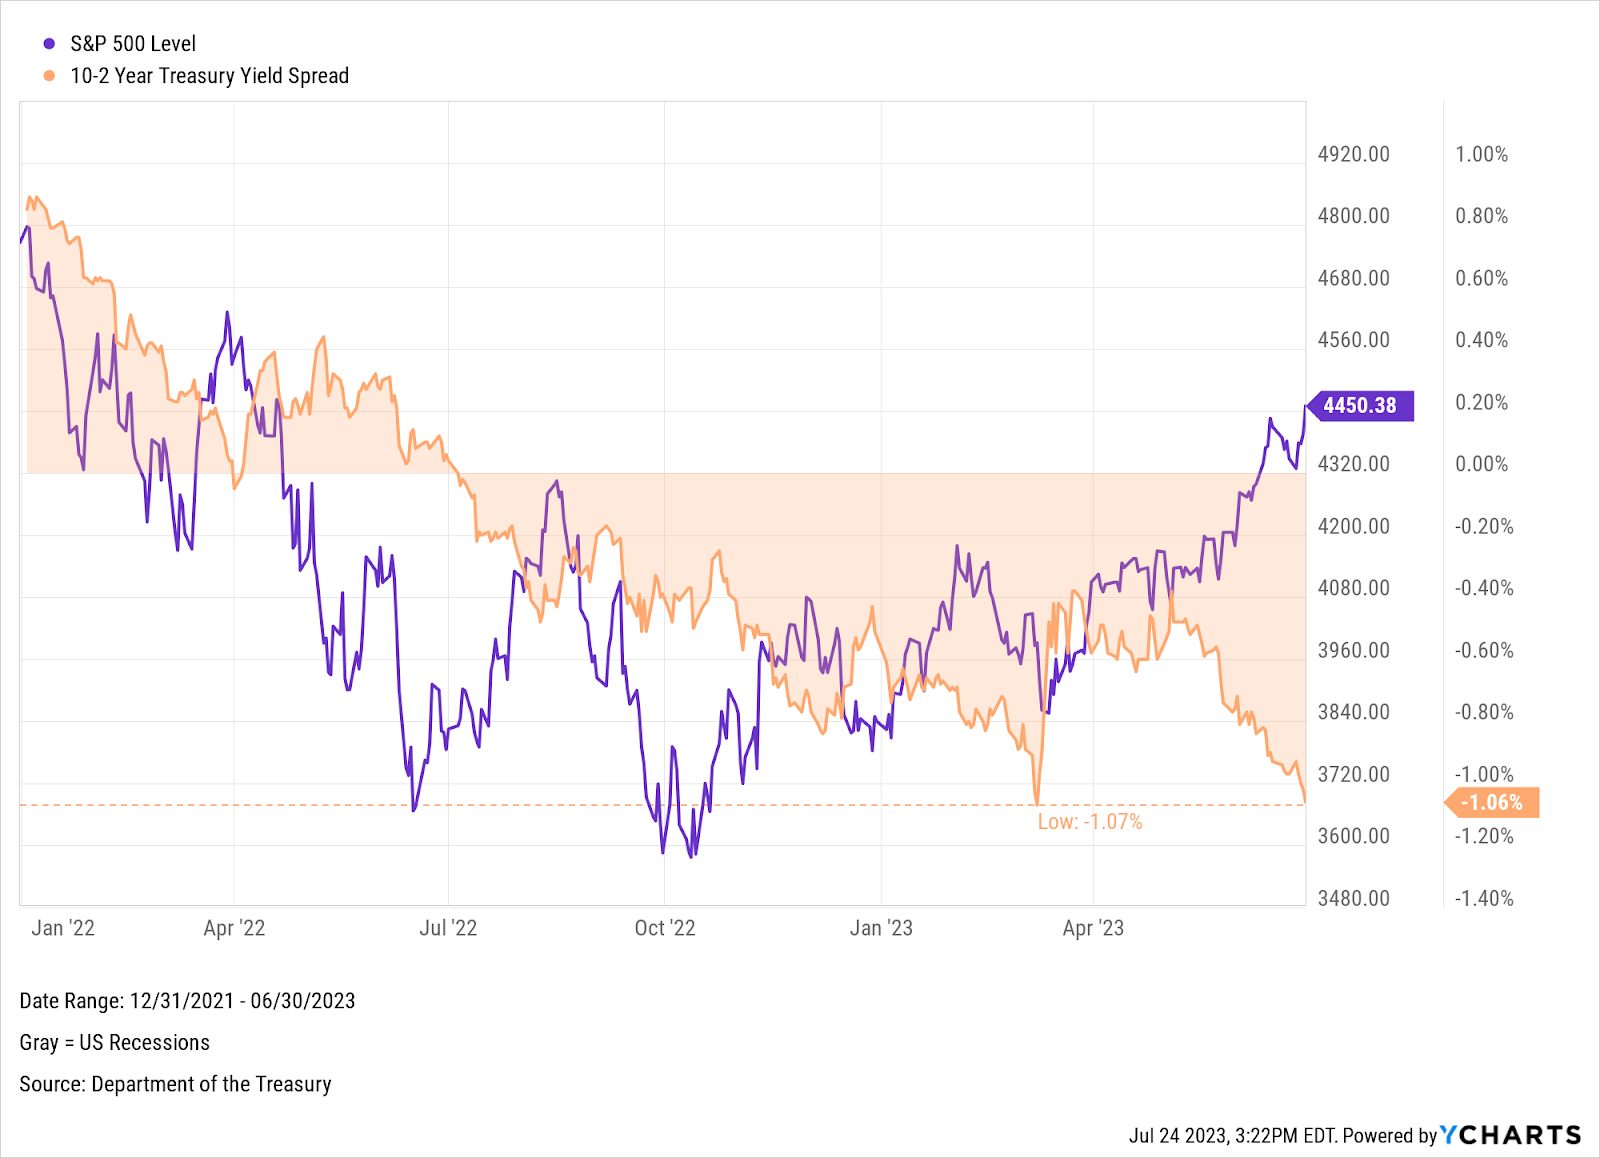
The 10-2 Treasury Yield Spread Inversion and Escalating Recession Concerns
Since July 2022, the 10-2 Treasury Yield Spread has been inverted. Historically, a negative 10-2 Spread has been a leading indicator of a recession. In Q1, that 10-2 Spread sank to -1.07%, its deepest level in over forty years. And on the final day of Q2, the 10-2 revisited that same low.
Download Visual | Modify in YCharts
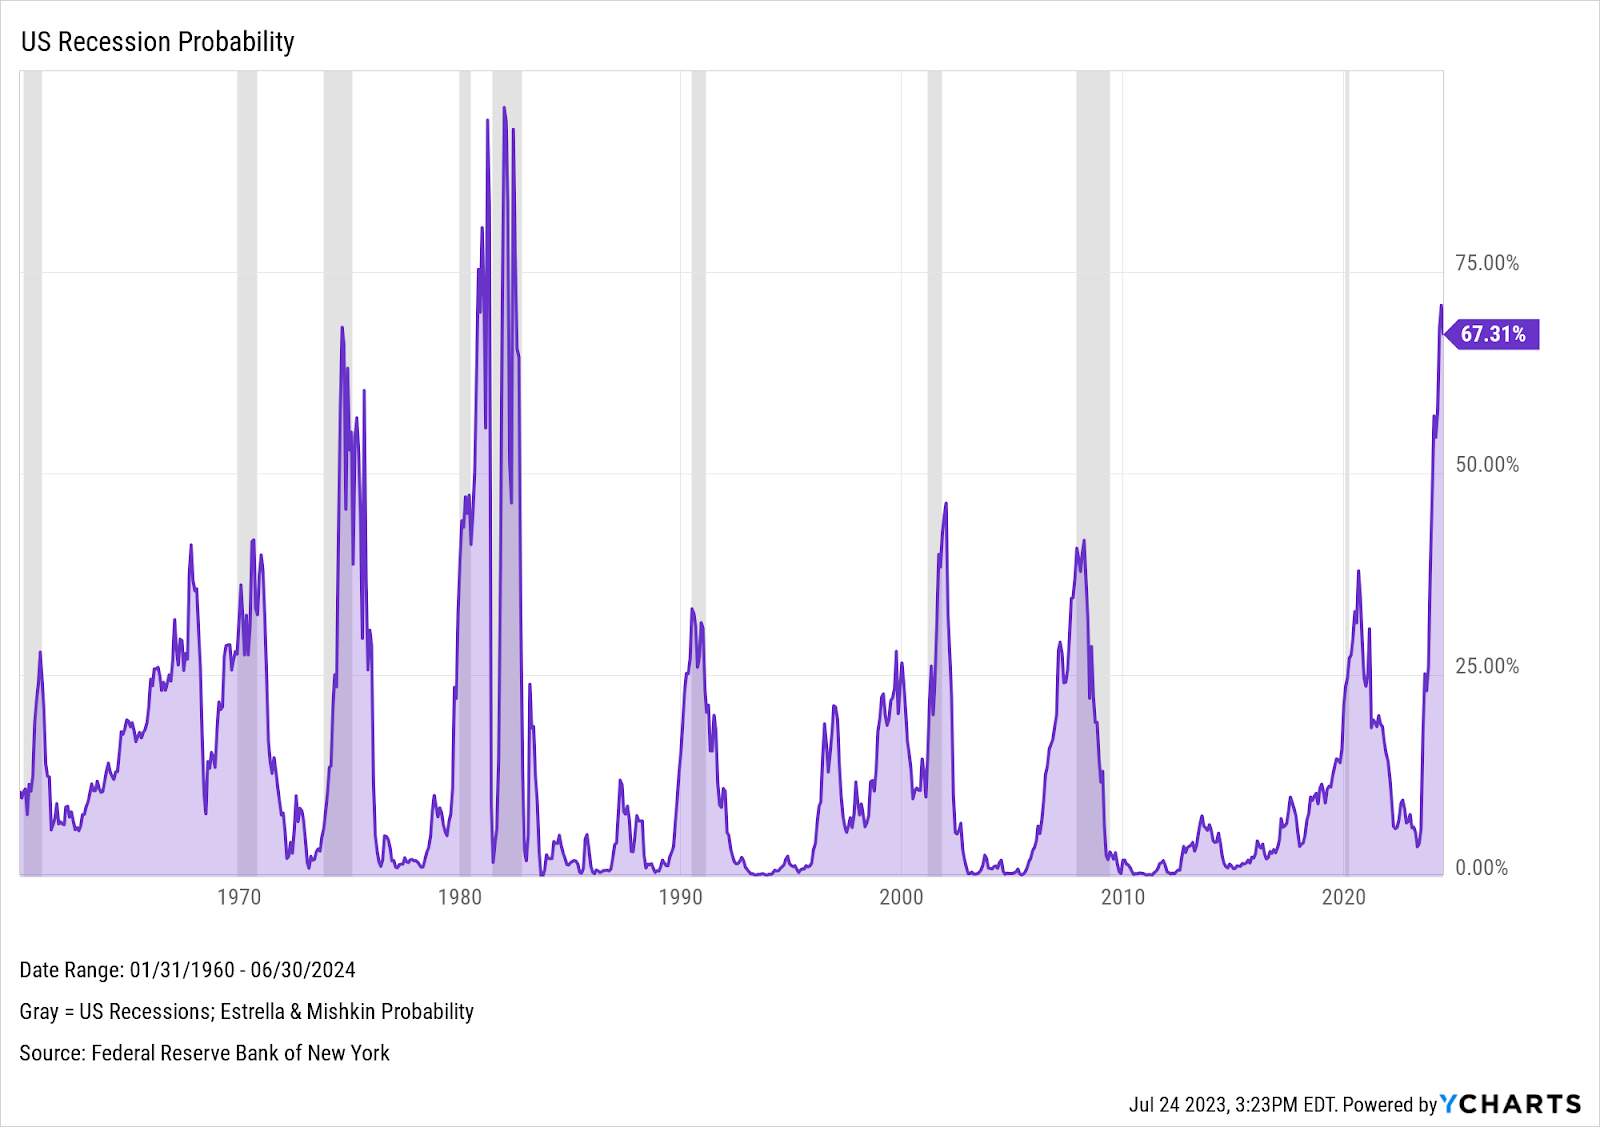
This persistent inversion of the Yield Curve has triggered a dramatic spike in US Recession Probability indicators. The one-year US Recession Probability (based on the Estrella & Mishkin model) stands at 67.3%, a level not seen since the early 1980s. Despite the prevailing positivity in the equity markets, a recurring question hangs over the economy as we close out the second quarter: Is a recession on the horizon, or will the economy prove resilient?
Download Visual | Modify in YCharts
YCharts clients: download the whole deck in the Support Center. Not a current client? Reach out to get access, or enter your email below to receive a free version of the deck:
Download the free Economic Summary Deck:Connect with YCharts
To get in touch, contact YCharts via email at hello@ycharts.com or by phone at (866) 965-7552
Interested in adding YCharts to your technology stack? Sign up for a 7-Day Free Trial.
Disclaimer
©2023 YCharts, Inc. All Rights Reserved. YCharts, Inc. (“YCharts”) is not registered with the U.S. Securities and Exchange Commission (or with the securities regulatory authority or body of any state or any other jurisdiction) as an investment adviser, broker-dealer or in any other capacity, and does not purport to provide investment advice or make investment recommendations. This report has been generated through application of the analytical tools and data provided through ycharts.com and is intended solely to assist you or your investment or other adviser(s) in conducting investment research. You should not construe this report as an offer to buy or sell, as a solicitation of an offer to buy or sell, or as a recommendation to buy, sell, hold or trade, any security or other financial instrument. For further information regarding your use of this report, please go to: ycharts.com/about/disclosure
Next Article
Q2 2023 Fund Flows: Equity Outflows, Money Market Influx, and Recession JittersRead More →