Taking Advantage of the Bull Market: A Playbook for Advisors & Wholesalers
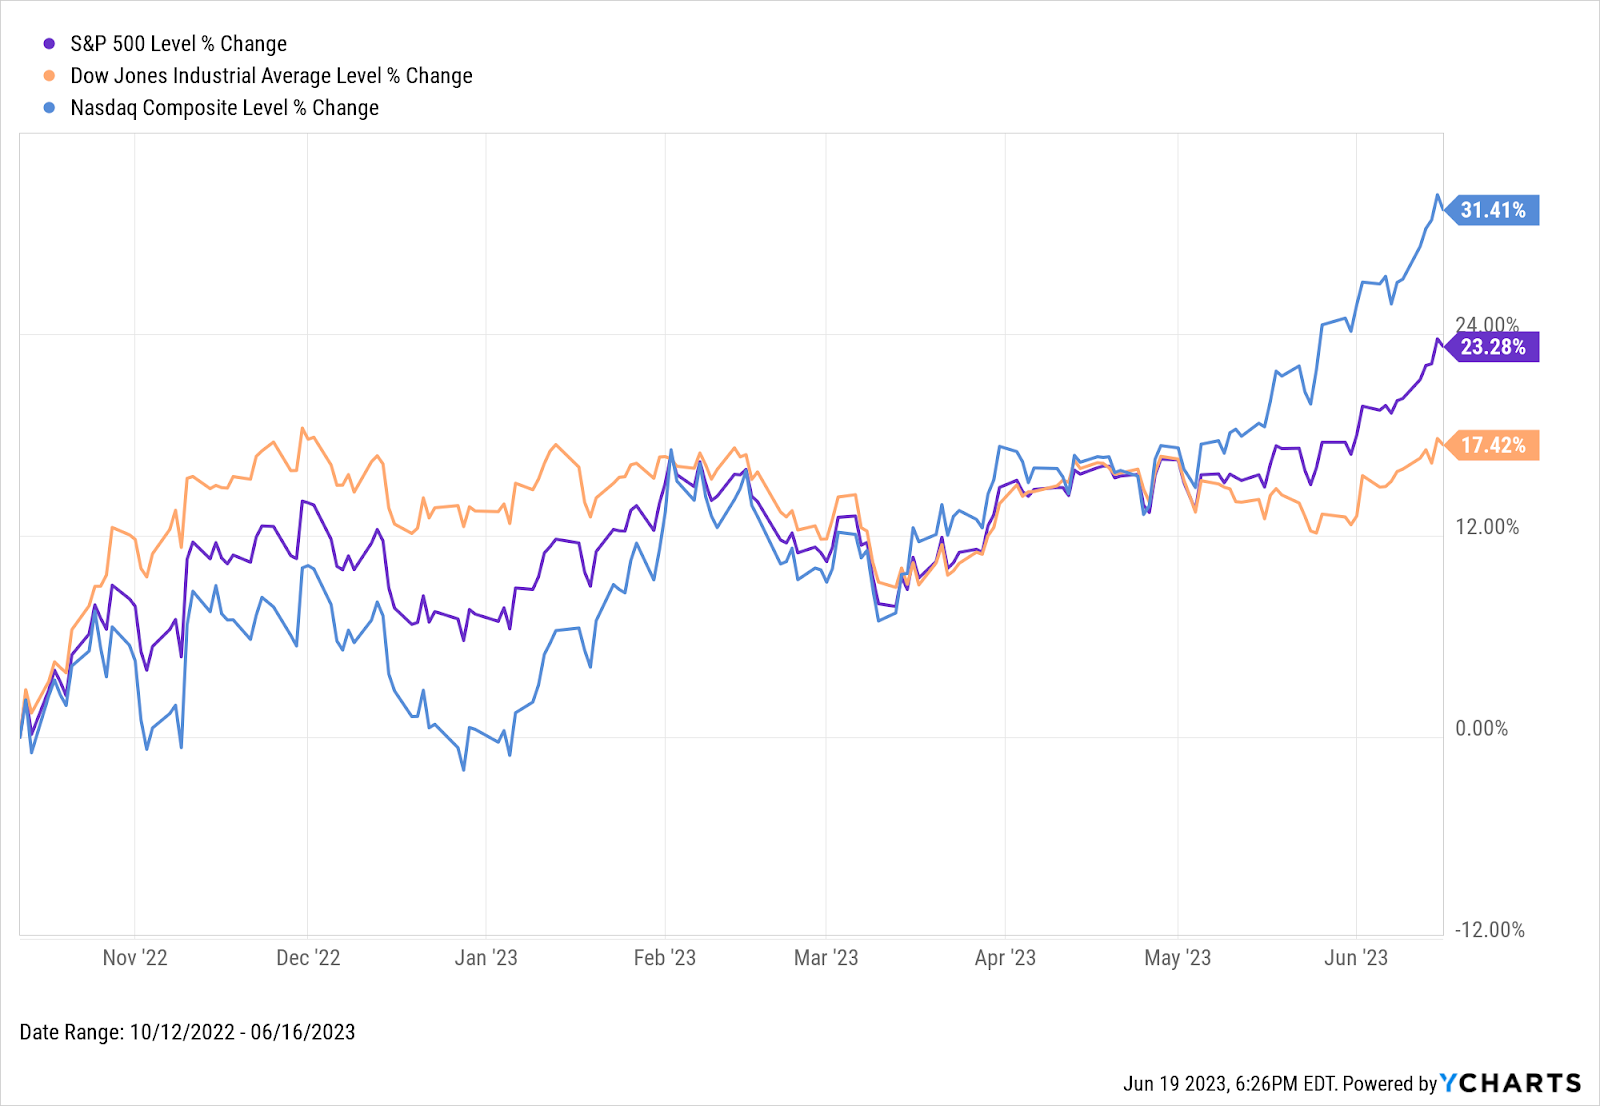
Following an up-and-down start to 2023, the stock market has officially exited bear market territory and entered a new bull phase. As of June 16th, the S&P 500 is up 14.9% year-to-date, and 23.3% higher from its October 12, 2022 low of 3577.03.
Market analysts are now updating their end-of-year projections for the S&P 500 in light of this shift, signaling the roars of the bears transitioning into an echoing stampede of bulls.
Download Visual | Modify in YCharts
For financial advisors, this new bull market presents a golden opportunity to draw in potential clients and motivate existing ones who might have retreated from the market after a bleak 2022 or were spooked by the choppy market climate of Q1 2023. For wholesalers, it’s an opportunity to educate advisors of the opportunity cost of remaining in money markets funds. This promising market outlook could be the key to re-igniting client interest and participation in the market.
How Long Was the Last Bear Market?
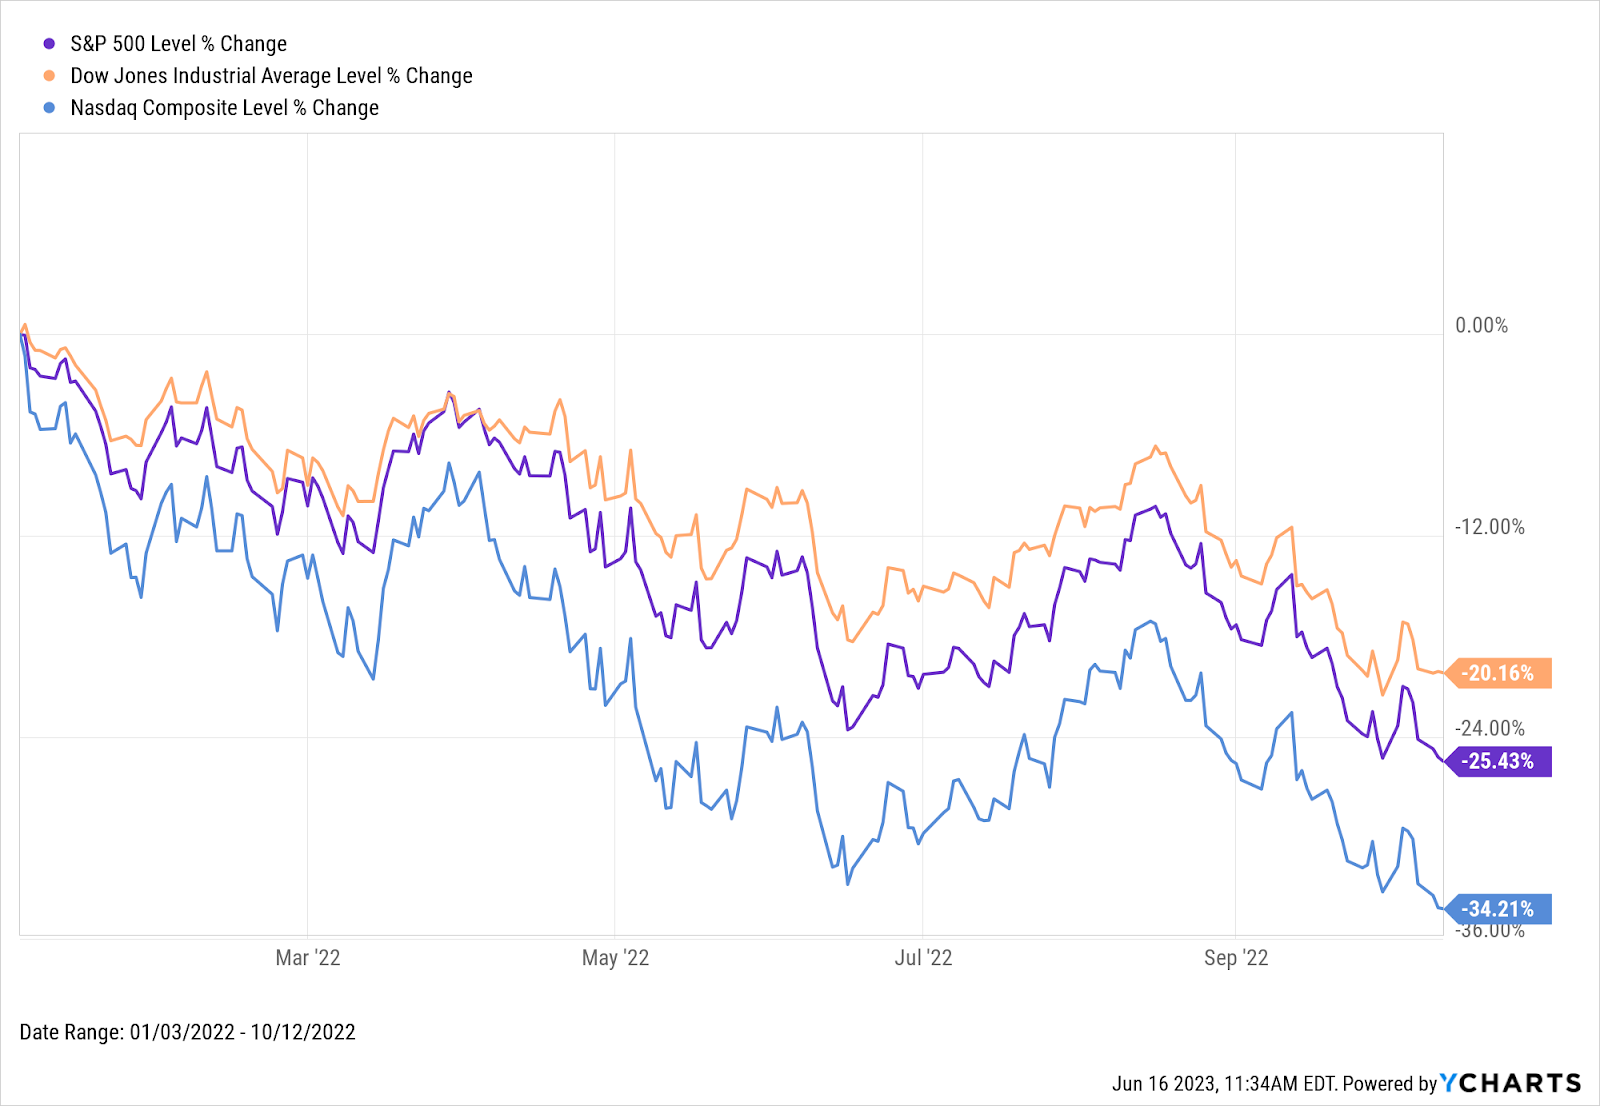
The most recent bear market that we experienced stretched 282 days, from January 3, 2022, to October 12, 2022.
During this period, the S&P 500 tumbled 25.4%. Inflation surged as high as 9%, prompting the Federal Reserve to enact the most aggressive rate hike cycle in forty years, taking rates from 0% to 5%. The aftershock of these hikes reverberated through the market, punctuated by several high-profile bank failures.
Download Visual | Modify in YCharts
What Could Be In Store for This Bull Market?
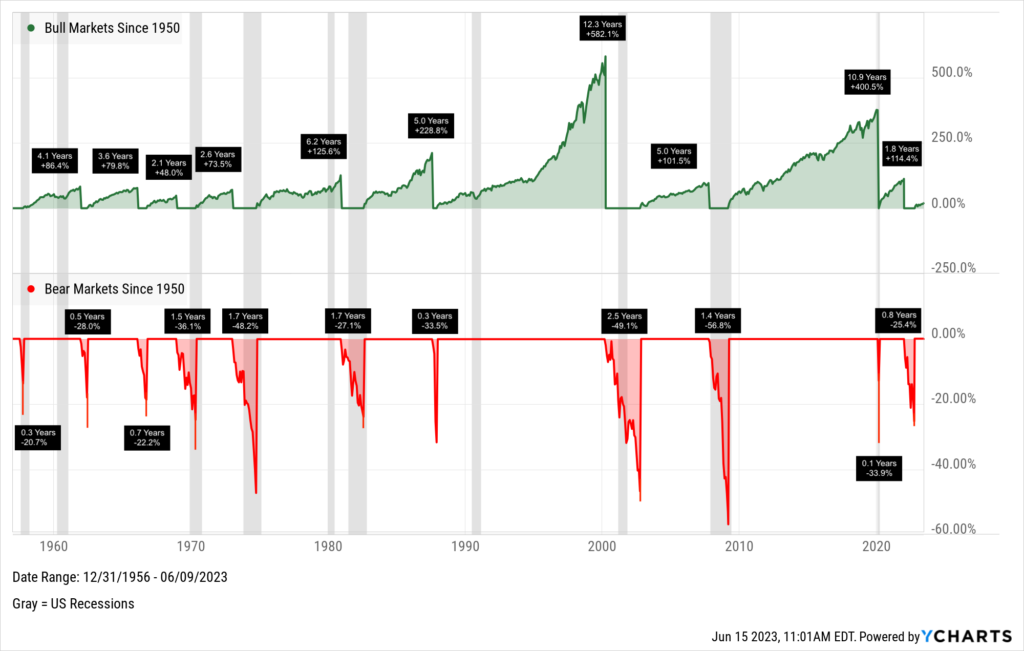
Since 1950, the average bull market has lasted 1,964 days, or 5.38 years. The longest one unfolded from December 4, 1987 to March 24, 2000 (4,494 days), during which the market posted a phenomenal 582.1% gain.
Download Visual | Talk to Us to Learn How to Recreate This Chart
S&P 500 Bull Markets since 1950
S&P 500 Bear Markets since 1950
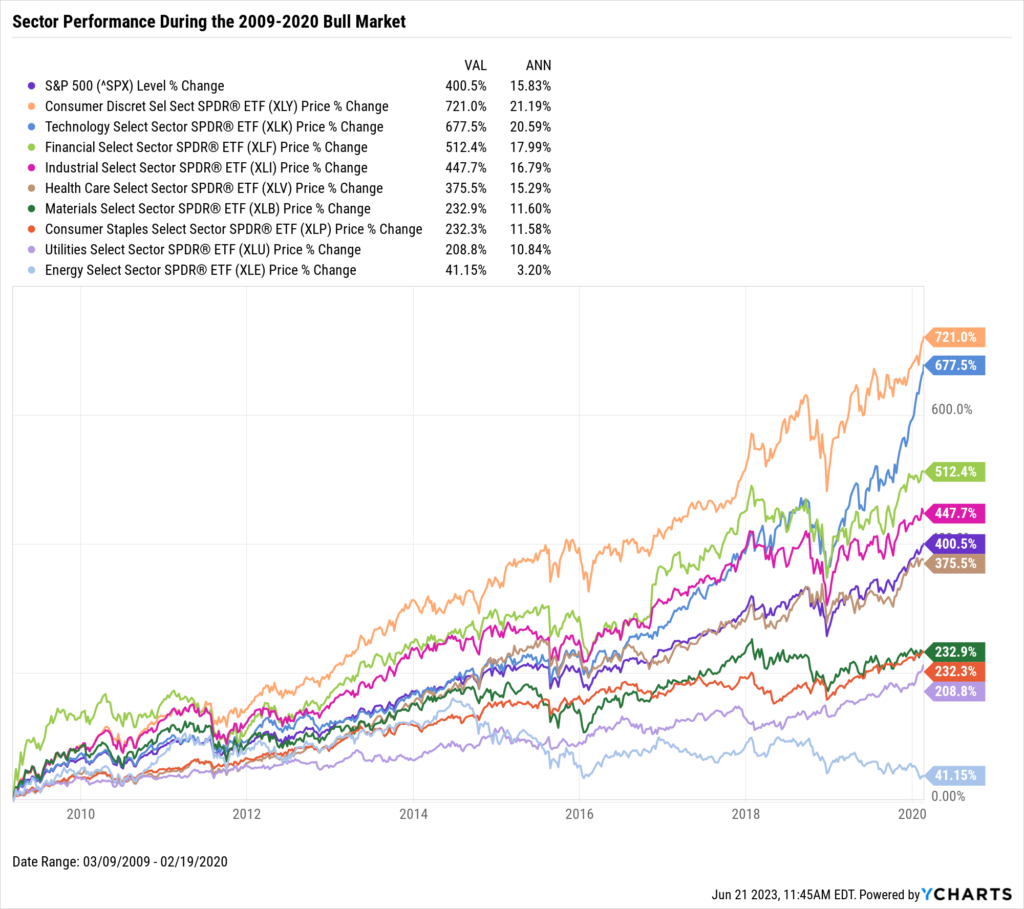
In various past bull cycles, specific sectors have often played pivotal roles in propelling the market upwards. For example, during the bull market run from March 9, 2009 to February 19, 2020 (3,999 days, the second-longest on record), Technology, Consumer Discretionary, Financial, and Industrial sectors outperformed the S&P 500. Notably, the Consumer Discretionary and Technology sectors soared 721% and 677%, respectively.
Download Visual | Modify in YCharts
Fast forward to the newfound bull market, and the Technology sector has been leading the charge in the early stages. This rebound has been fueled by breakthroughs in Artificial Intelligence (AI) and strong quarterly reports from the sector’s biggest names like Apple (APPL) and NVIDIA (NVDA), the latter of which is up a whopping 192% year-to-date. Moreover, the Communication Services and Consumer Discretionary sectors have also contributed to the upward market trajectory, boasting double-digit gains so far in 2023.
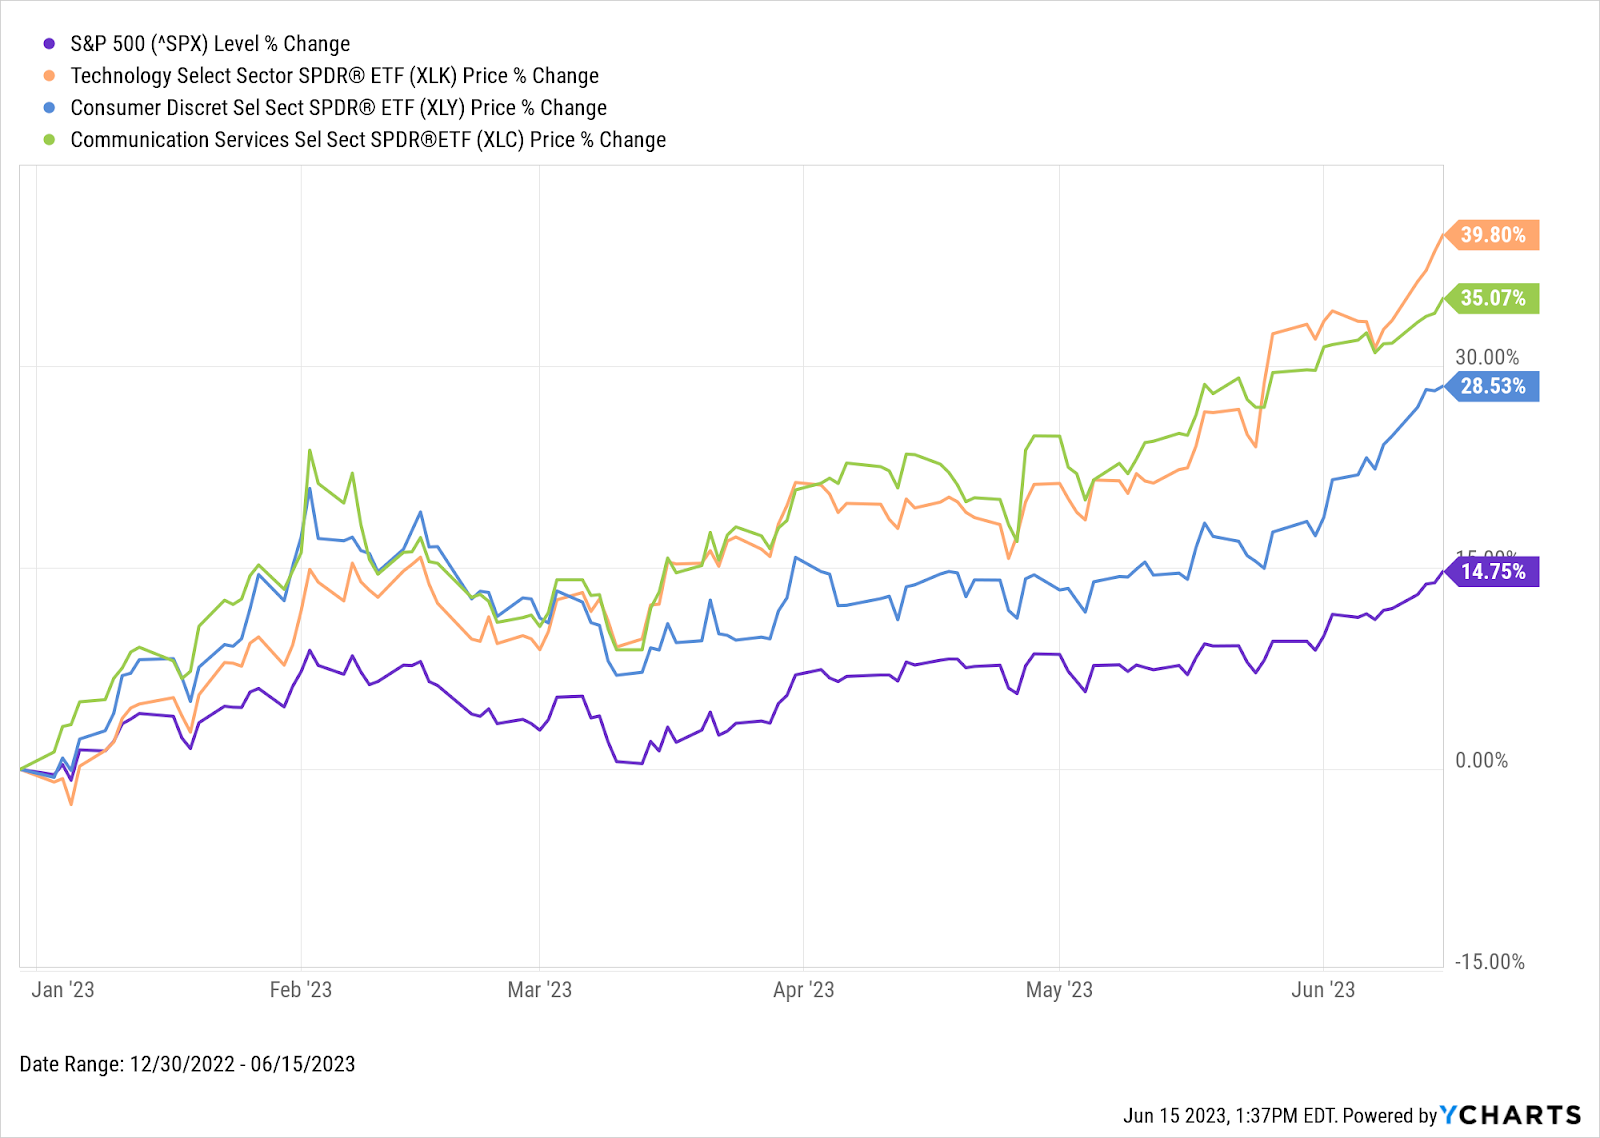
Download Visual | Modify in YCharts
Early signs are pointing to these sectors spearheading the bull run, helped largely in part by the “Magnificent Seven” of Microsoft (MSFT), Amazon (AMZN), Meta Platforms (META), Tesla (TSLA), and Alphabet (GOOG, GOOGL) in addition to Apple and NVIDIA.
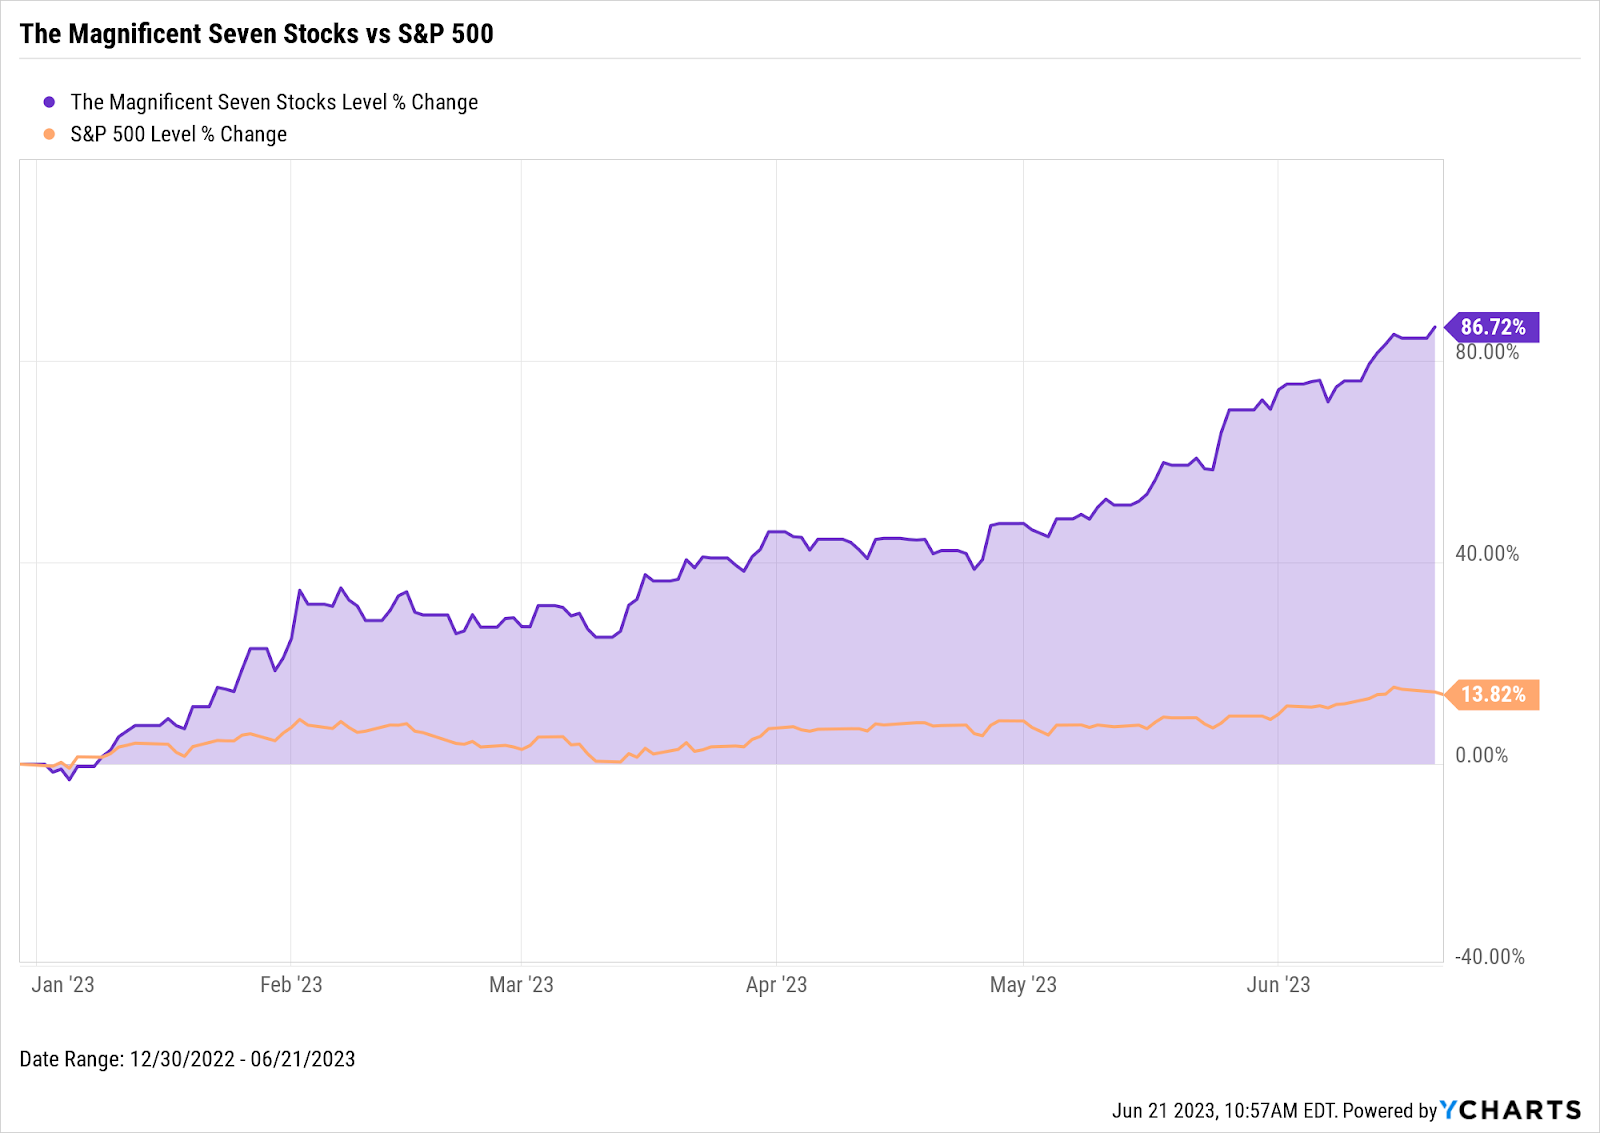
Download Visual | Learn More About Model Portfolios
This new bull market isn’t limited to just stocks, either. Core Fixed Income (AGG) is up nearly 3% since the October low, and nearly 5% when factoring in reinvested yield.
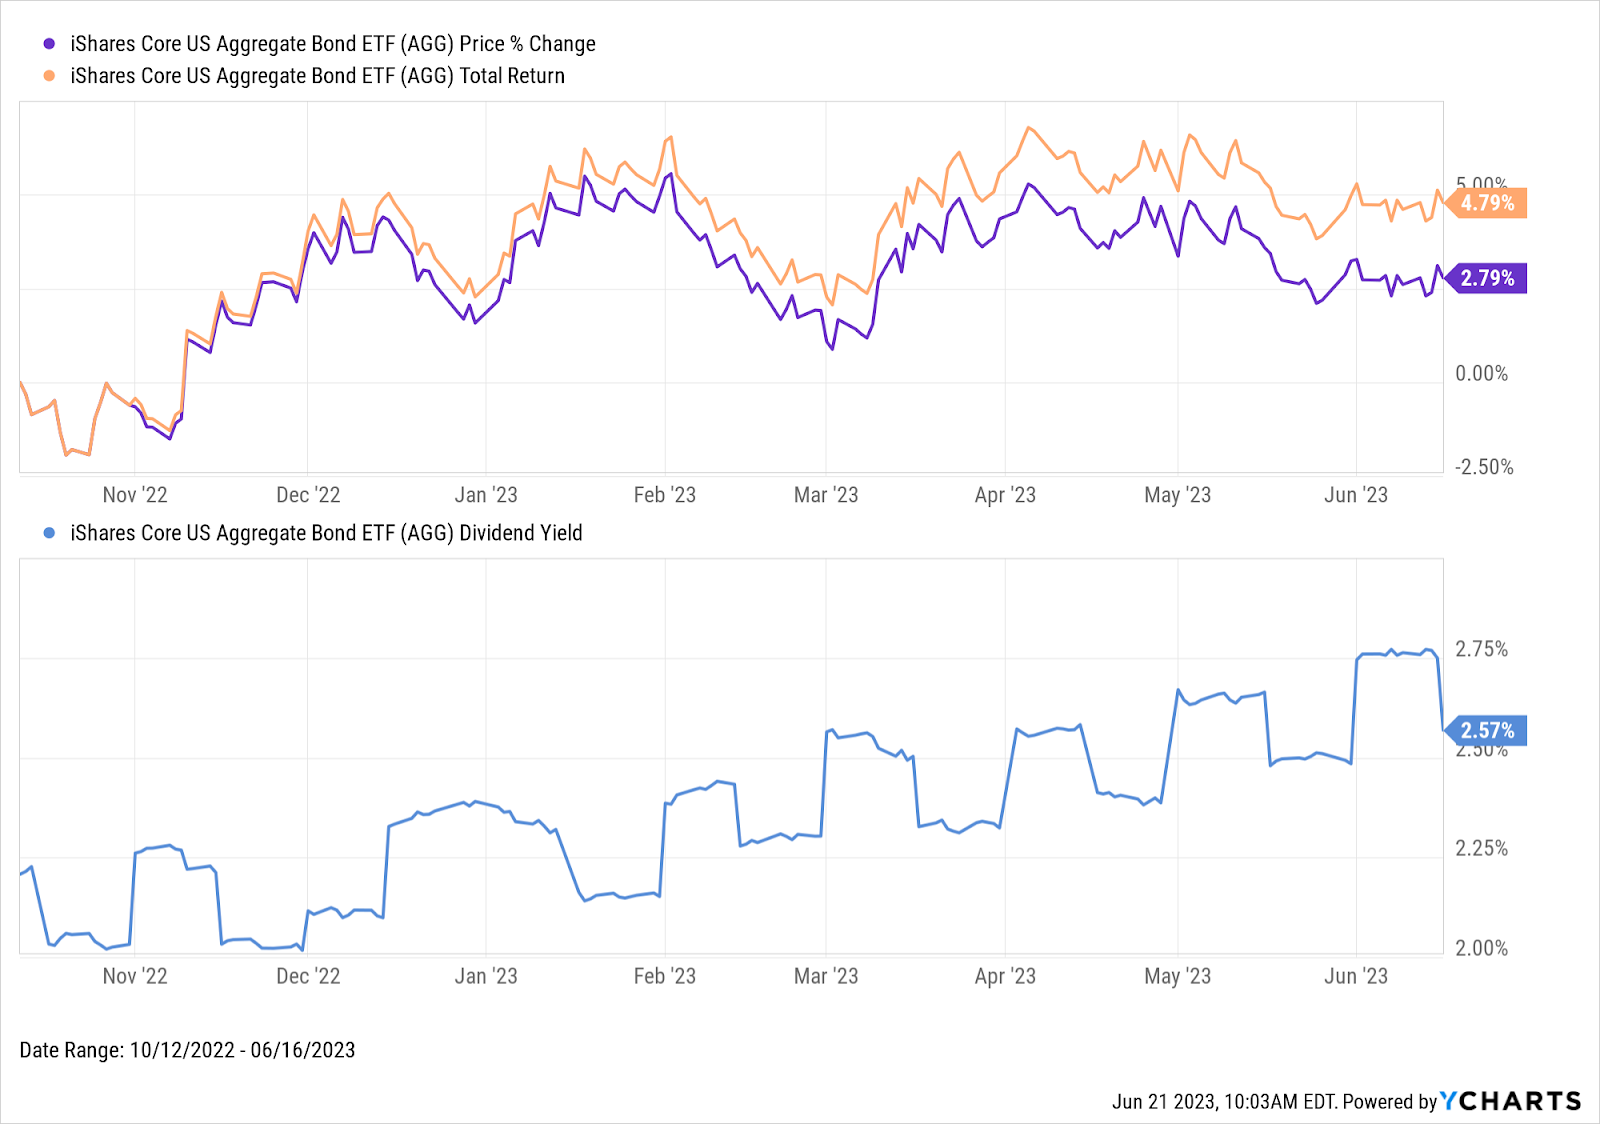
Download Visual | Modify in YCharts
Taking Advantage: How to Grow AUM in a Bull Market
With YCharts, you can leverage powerful data and tools to ensure your AUM grows along with this bull cycle. Fund Screener, Scenarios, Report Builder, and YCharts-produced content such as our Top 10 Visuals slide deck can help you present your insights in the best light to prospects and clients.
Streamline Fund Selection with the Fund Screener
Both wholesalers and advisors can effectively utilize the Fund Screener to pinpoint optimal strategies for the prevailing market conditions. Wholesalers can harness this tool to pinpoint funds that have traditionally underperformed in a bull market, thereby singling out potential replacement opportunities.
Advisors, on the other hand, can leverage the Fund Screener to rank and evaluate funds when a quarterly rebalancing is imminent based on volatility and performance. In any case, the Fund Screener empowers YCharts users to narrow the vast field of over 45,000 funds down to something more manageable. This process can create more efficient research workflows to capitalize on the bull market faster.
Use Scenarios to Highlight the Market’s Impact on Wealth
A bull market is the ideal time to encourage your clients and persuade prospects about the advantages of entering the market. The Scenarios tool is particularly effective for this.
Nothing quite illustrates the potential growth of a client’s wealth during such times like a concrete, visual example. An initial investment of $10,000, coupled with a $1,000 monthly contribution (and 1% monthly rate of change) would have escalated to $53,186.48 during the last bull market.
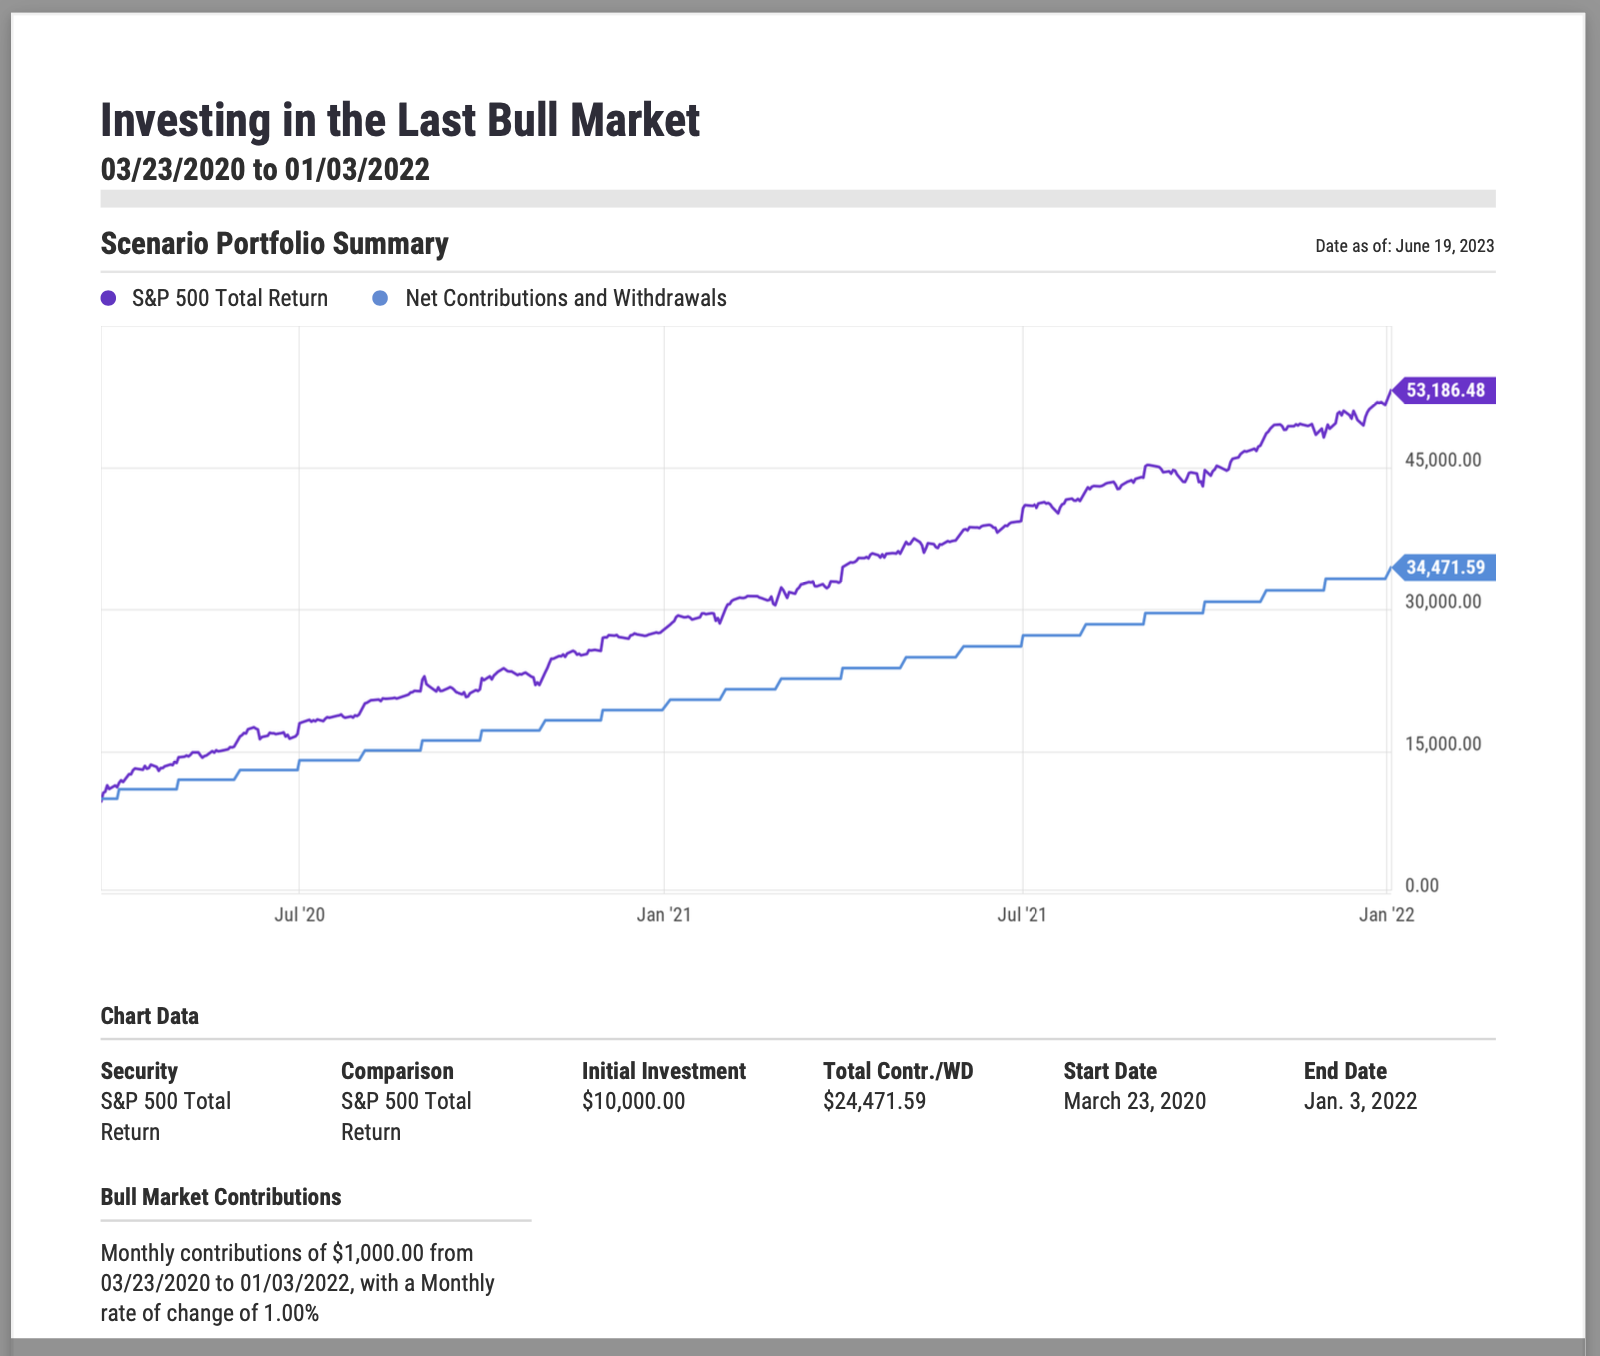
Download Visual | Build Your Own Scenario in YCharts
Leverage Report Builder for Compelling Narratives
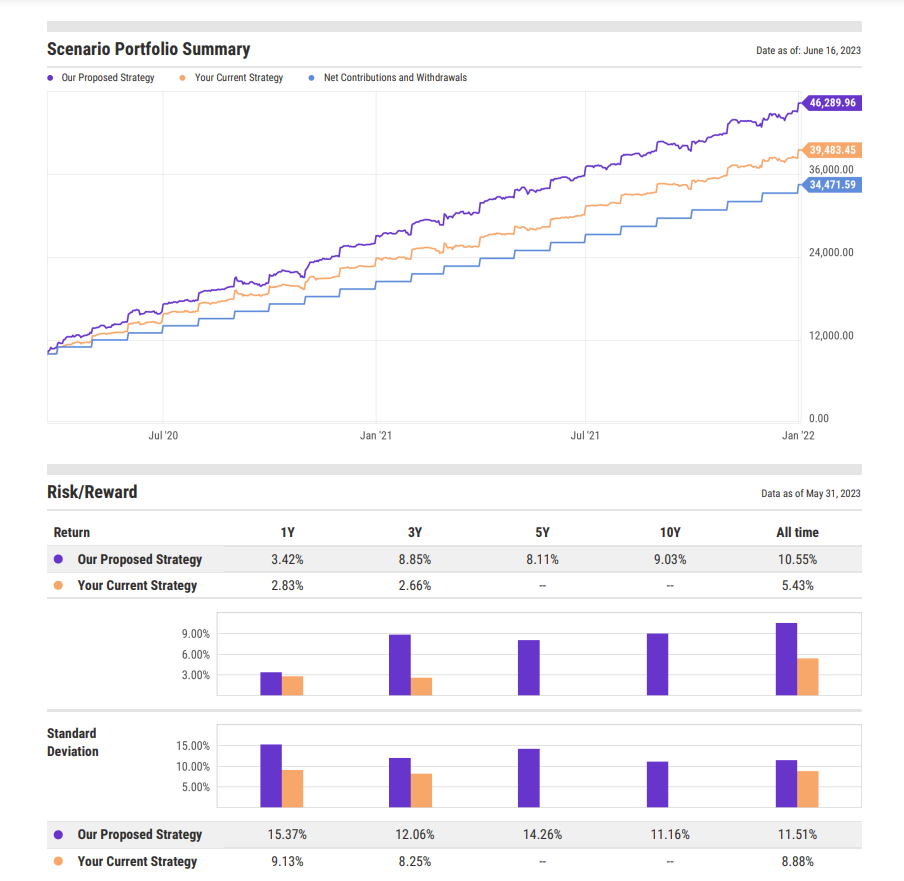
Scenarios and Screener results–among other YCharts tools– can be embedded into a client-facing report using Report Builder. This drag-and-drop tool can be used to create personalized reports with your firm’s branding, disclosure statements, and comparisons to highlight your strategy’s superiority.
Now you can visually show off your strategy’s performance over the last bull market. Whether your approach offered better returns with comparable volatility or a smaller downturn during the last bear market or provides a steadier income stream for your clients, Report Builder enables you to create a tailored report for every client or prospect in your pipeline.
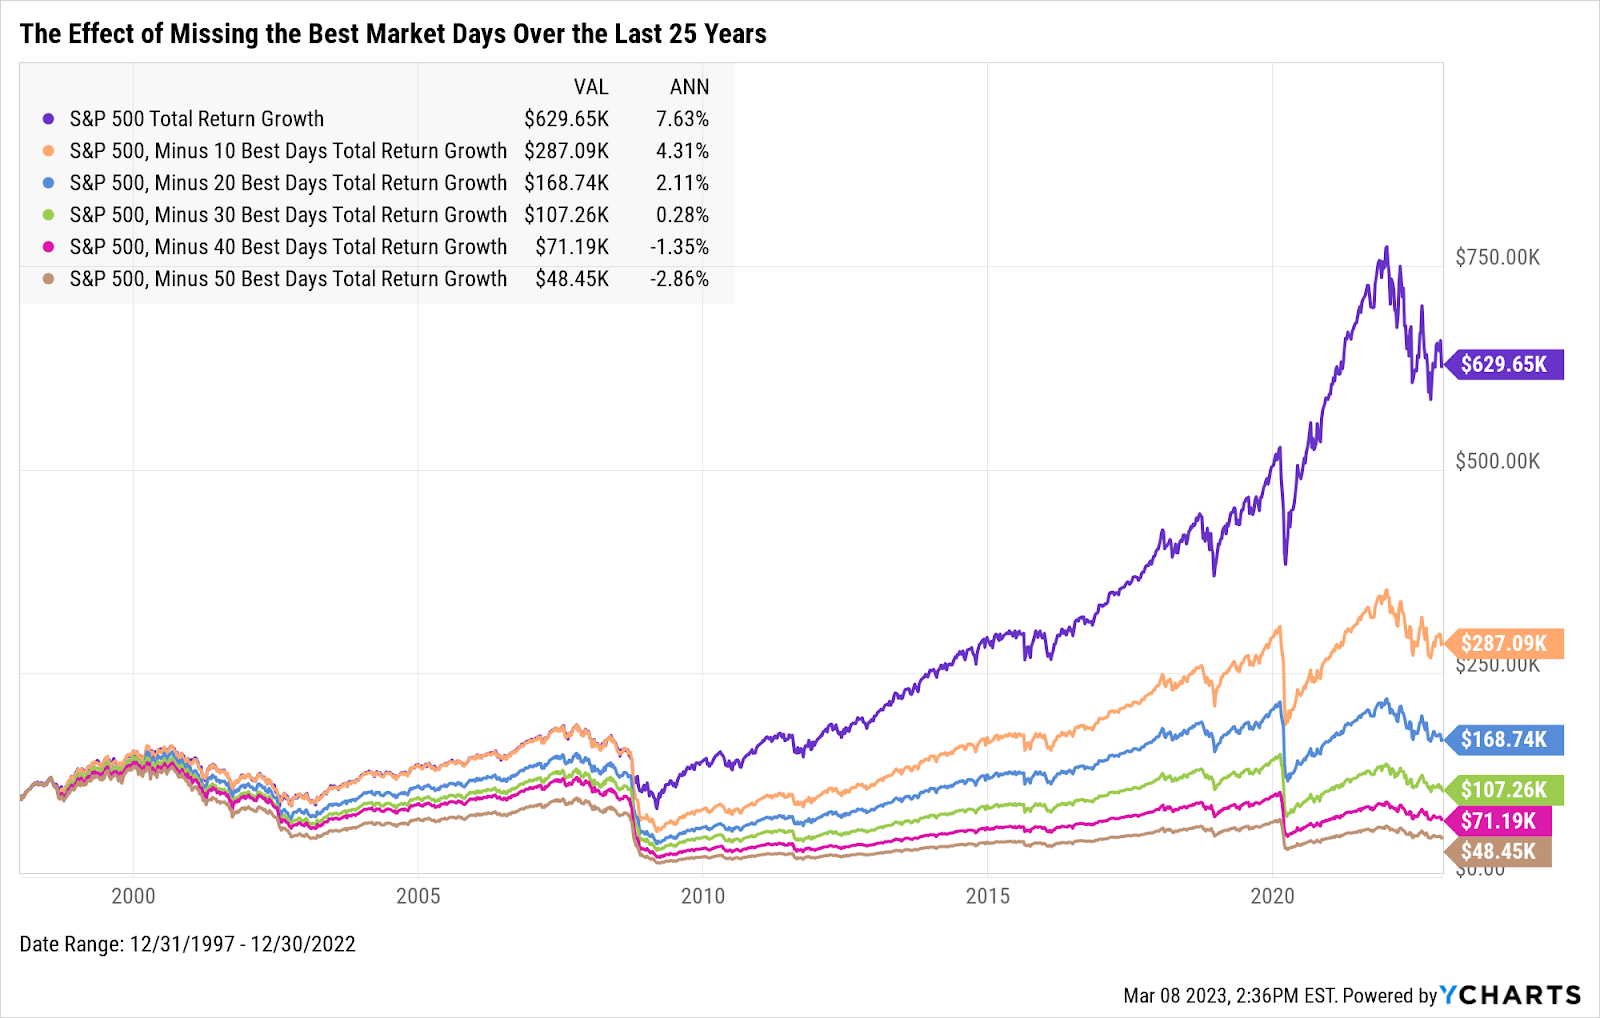
Show the Consequences of Missing the Market’s Best Days
Need to instill urgency in your clients or prospects but short on time? You can leverage YCharts-curated content such as the Top 10 Visuals for Prospect & Client Meetings slide deck. This deck vividly displays the variance in price appreciation resulting from missing even just the market’s 10 best days in the last 25 years, which could serve as a powerful motivator for tepid investors.
The shift from a bearish to a bullish market carries significant opportunities, both for investors seeking growth and financial advisors aiming to expand their AUM. Leveraging tools like YCharts in navigating the dynamics of a bull market can help craft and identify the right strategies for maximizing gains and building a solid foundation for future success.
Connect with YCharts
To get in touch, contact YCharts via email at hello@ycharts.com or by phone at (866) 965-7552
Interested in adding YCharts to your technology stack? Sign up for a 7-Day Free Trial.
Disclaimer
©2023 YCharts, Inc. All Rights Reserved. YCharts, Inc. (“YCharts”) is not registered with the U.S. Securities and Exchange Commission (or with the securities regulatory authority or body of any state or any other jurisdiction) as an investment adviser, broker-dealer, or in any other capacity, and does not purport to provide investment advice or make investment recommendations. This report has been generated through application of the analytical tools and data provided through ycharts.com and is intended solely to assist you or your investment or other adviser(s) in conducting investment research. You should not construe this report as an offer to buy or sell, as a solicitation of an offer to buy or sell, or as a recommendation to buy, sell, hold or trade, any security or other financial instrument. For further information regarding your use of this report, please go to: ycharts.com/about/disclosure
Next Article
Winners & Losers from the Fed’s Last Rate Hike CycleRead More →