
Initial Market Reaction to the 2026 Midterms Results
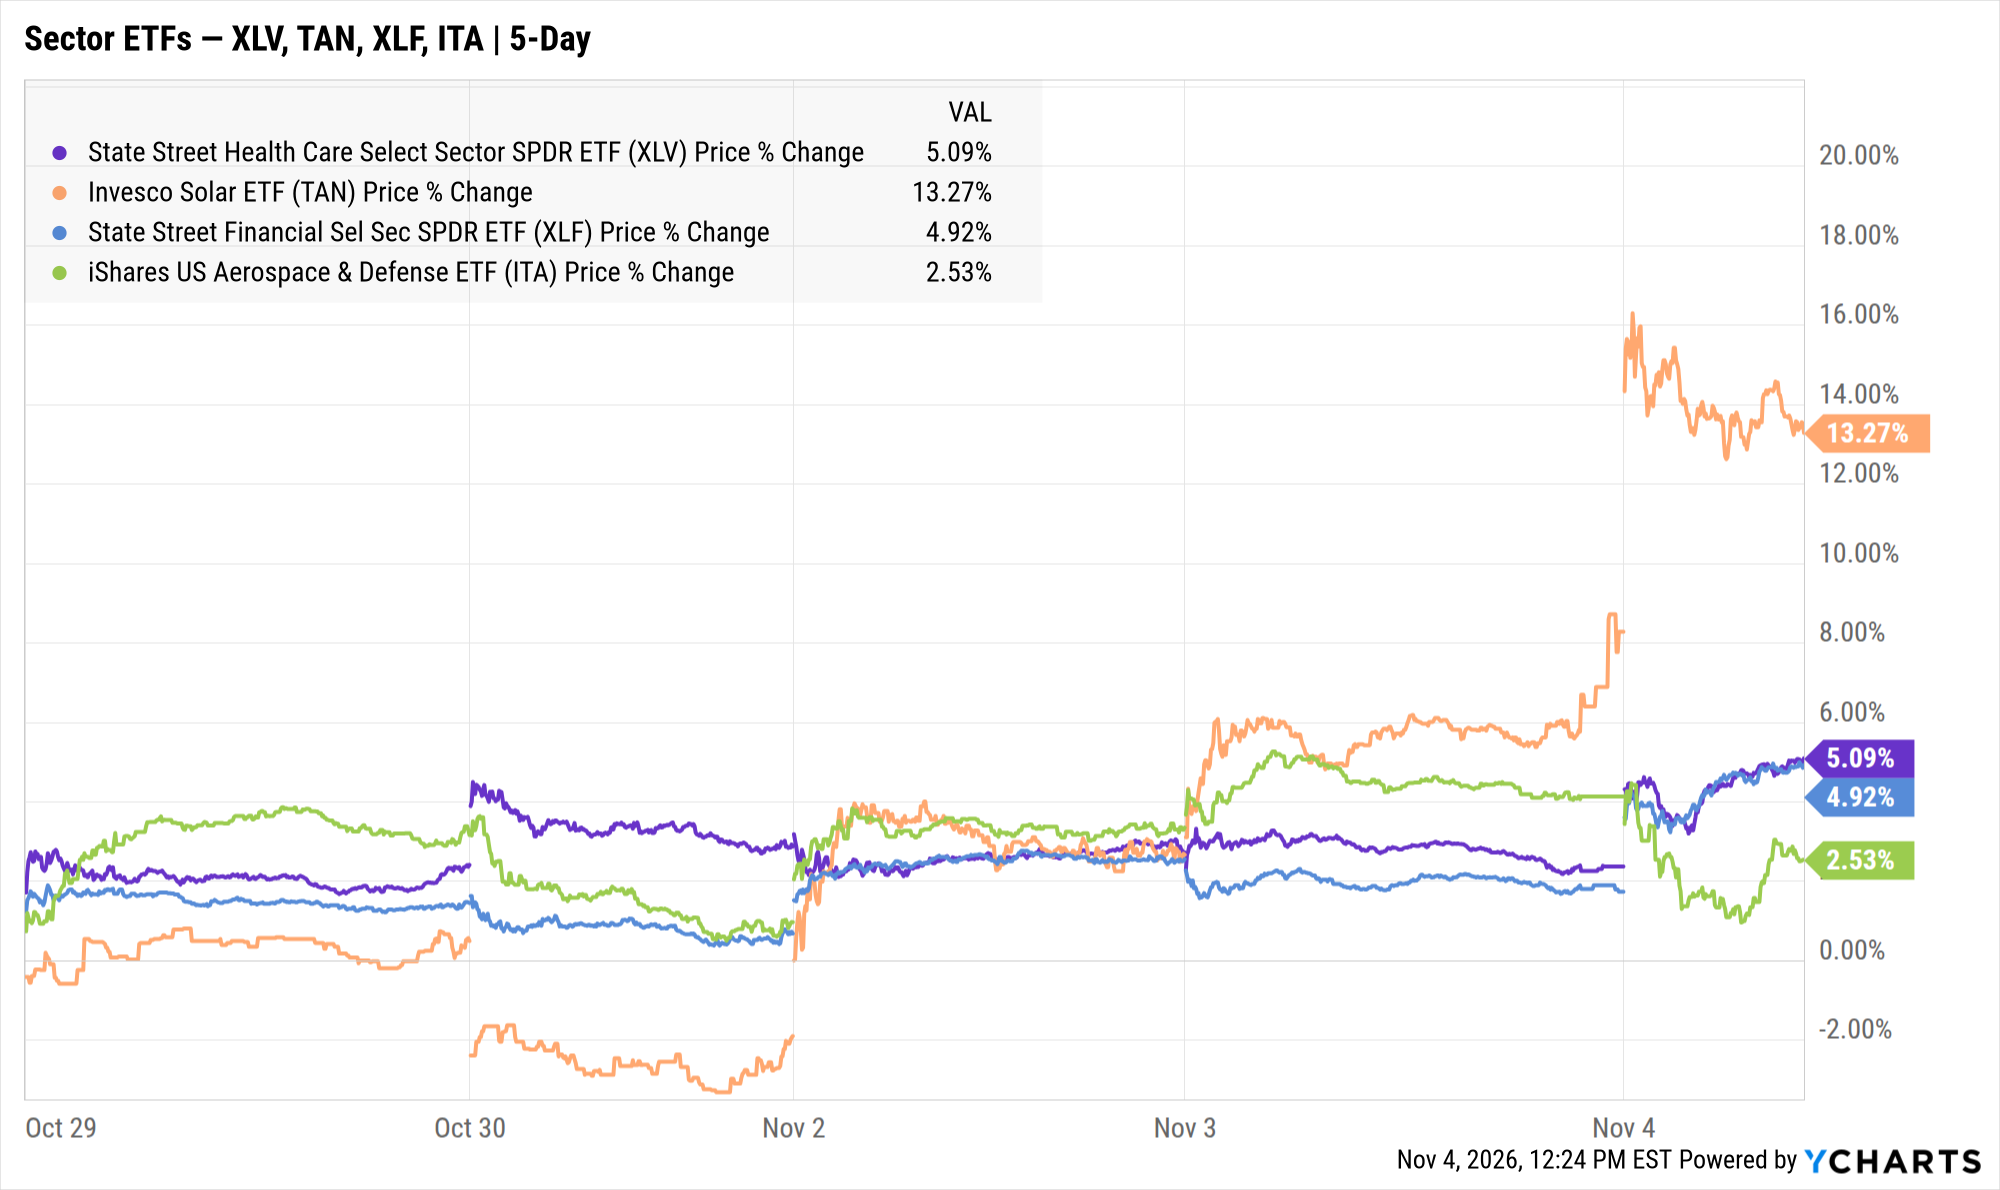
Charts reflect intraday data on November 4, 2026, and may differ from closing prices.
Democrats won control of both the House and the Senate in the 2026 midterm elections, and Democrat Gina Hinojosa defeated incumbent Republican Greg Abbott in the Texas governor’s race. For advisors, the calls will start this week, and most will center on a few themes: which sectors win and lose, what the results mean for artificial intelligence (AI), and whether portfolios need to change.
Below are the questions clients are most likely to ask, along with the data and charts to answer each one.
Answer these questions with your own charts
Build client-ready visuals, branded for your firm, in minutes.
Why Did Markets Drop Overnight, Then Rally?
Stock index futures sold off as results came in overnight, then reversed sharply once the outcome was clear. By late morning, the Dow Jones Industrial Average, S&P 500 and Nasdaq Composite were all trading higher, with the Dow on pace for its best day since April.
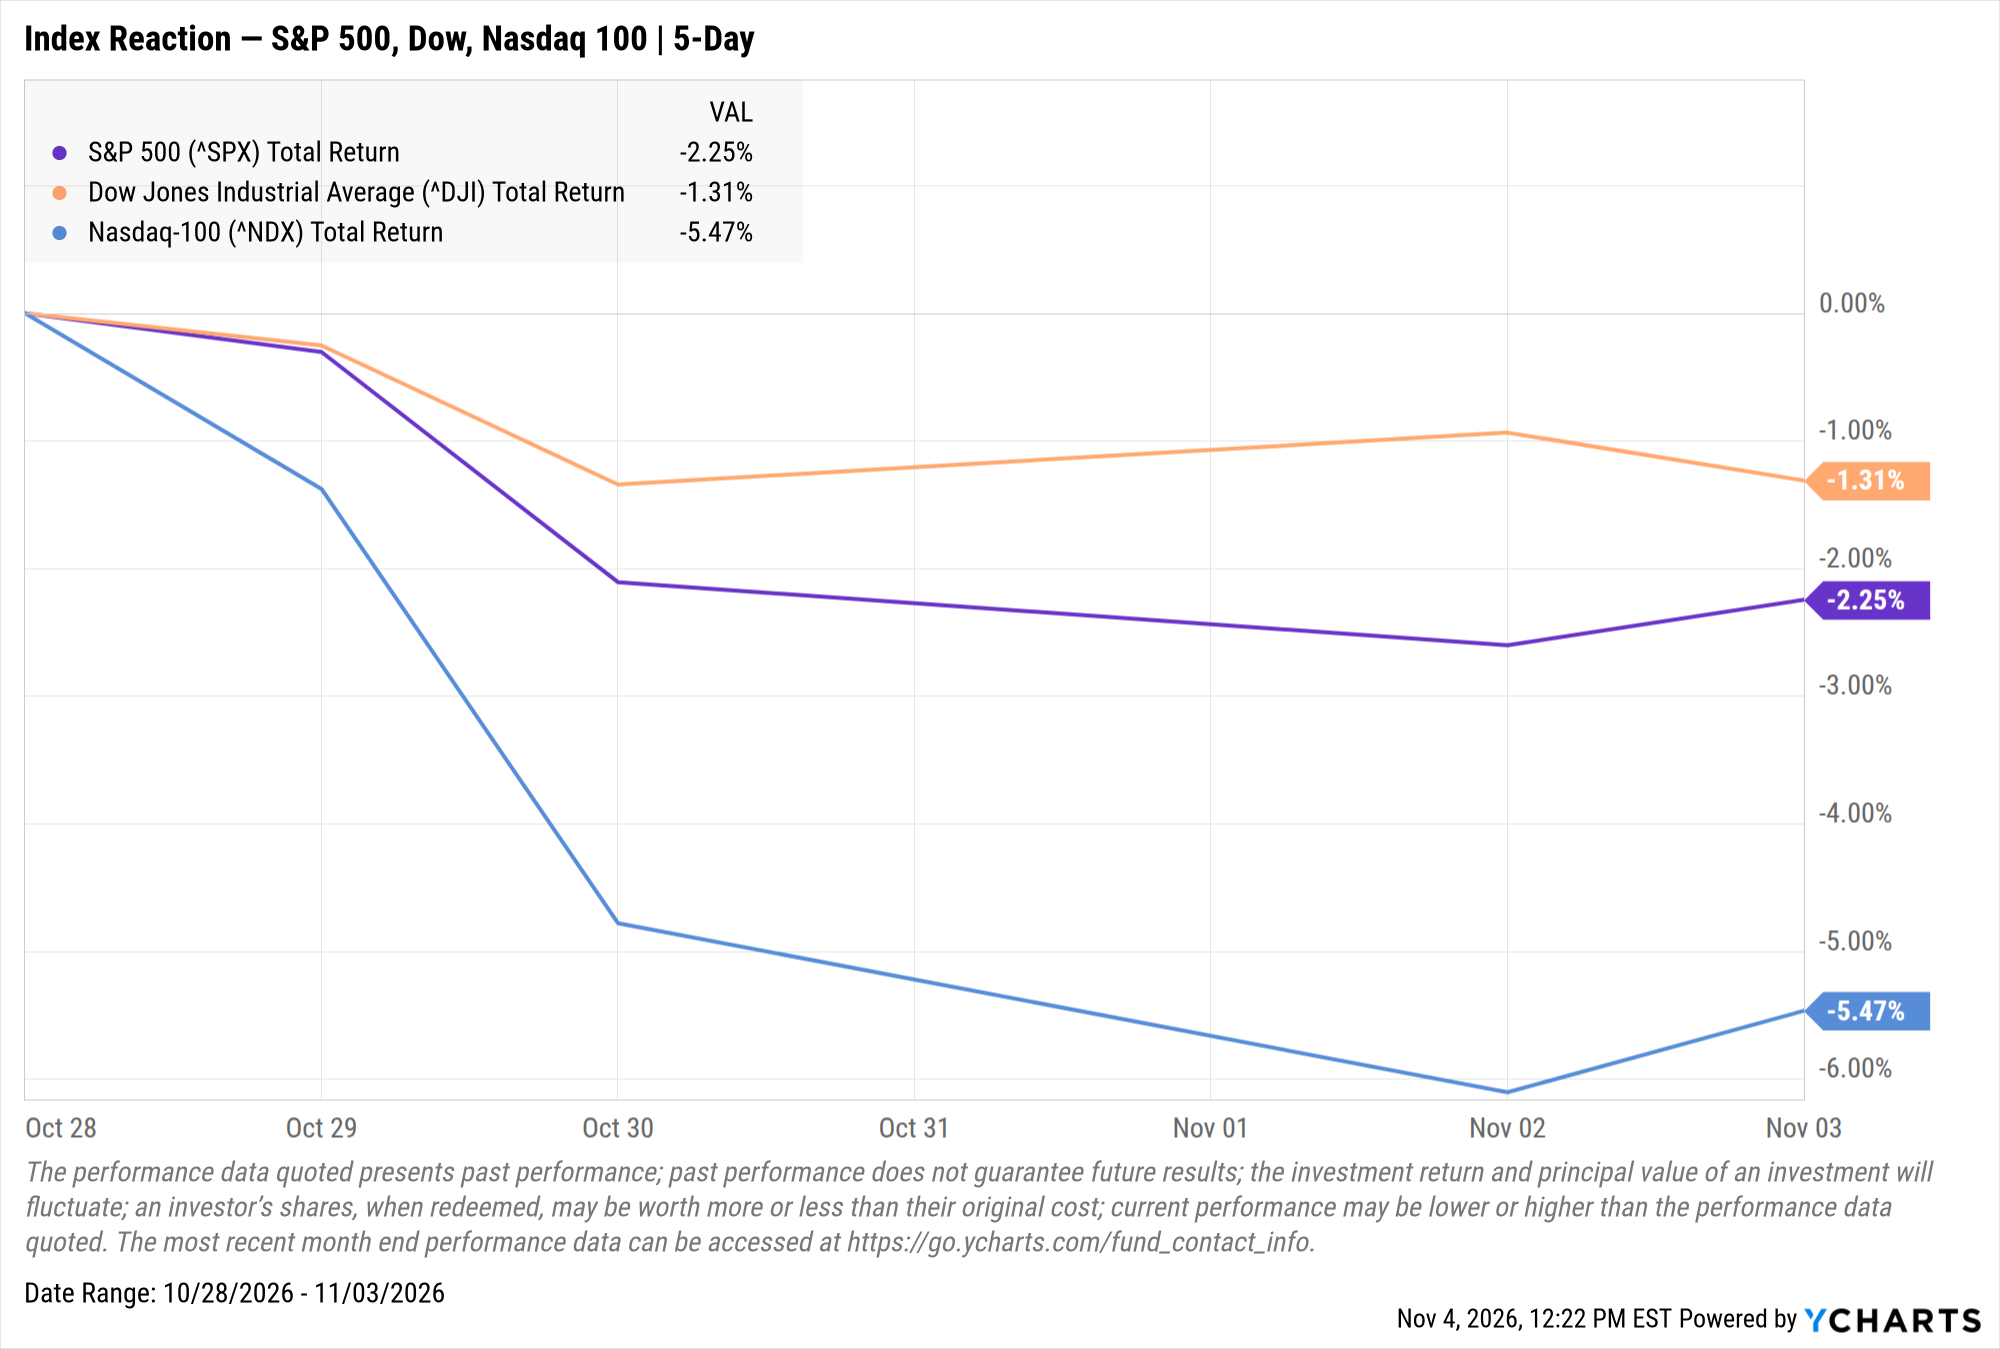
Strategists pointed to reduced uncertainty. The decisive outcome, along with President Trump’s acceptance of the results, removed political risk that had been hanging over markets. Andrew Slimmon of Morgan Stanley Investment Management noted that markets tend to favor gridlock, when a divided government passes few new laws. Others noted that gridlock does not necessarily mean weaker corporate earnings, and that lower Treasury yields could support equity valuations.
Not everyone views the setup as purely positive. Capital Economics said the result changes little in the near term, but that Democratic Senate gains in typically Republican states improve the party’s chances of passing tax increases and AI regulation if it also wins the next presidential election.
Which Sectors Could Win or Lose?
Divided government limits how much changes in Washington. President Trump keeps his veto, and the new Congress is not seated until January. But Wednesday’s trading showed clear sector rotation as investors repriced policy risk.
Healthcare
Hospitals and Medicaid-focused insurers were among the day’s biggest gainers on expectations that Democrats will try to reverse Medicaid cuts and restore enhanced Affordable Care Act (ACA) subsidies. Hospital operators HCA Healthcare and Universal Health Services rallied alongside insurers Centene and Molina.
Two caveats are worth sharing with clients. BNP Paribas noted Democrats may lack the numbers to restore major parts of the ACA, though they could still win concessions in negotiations over defense spending and government funding. And much of the move may already be priced in, as the S&P 500 healthcare sector had climbed more than 19% year to date to record highs heading into the election.
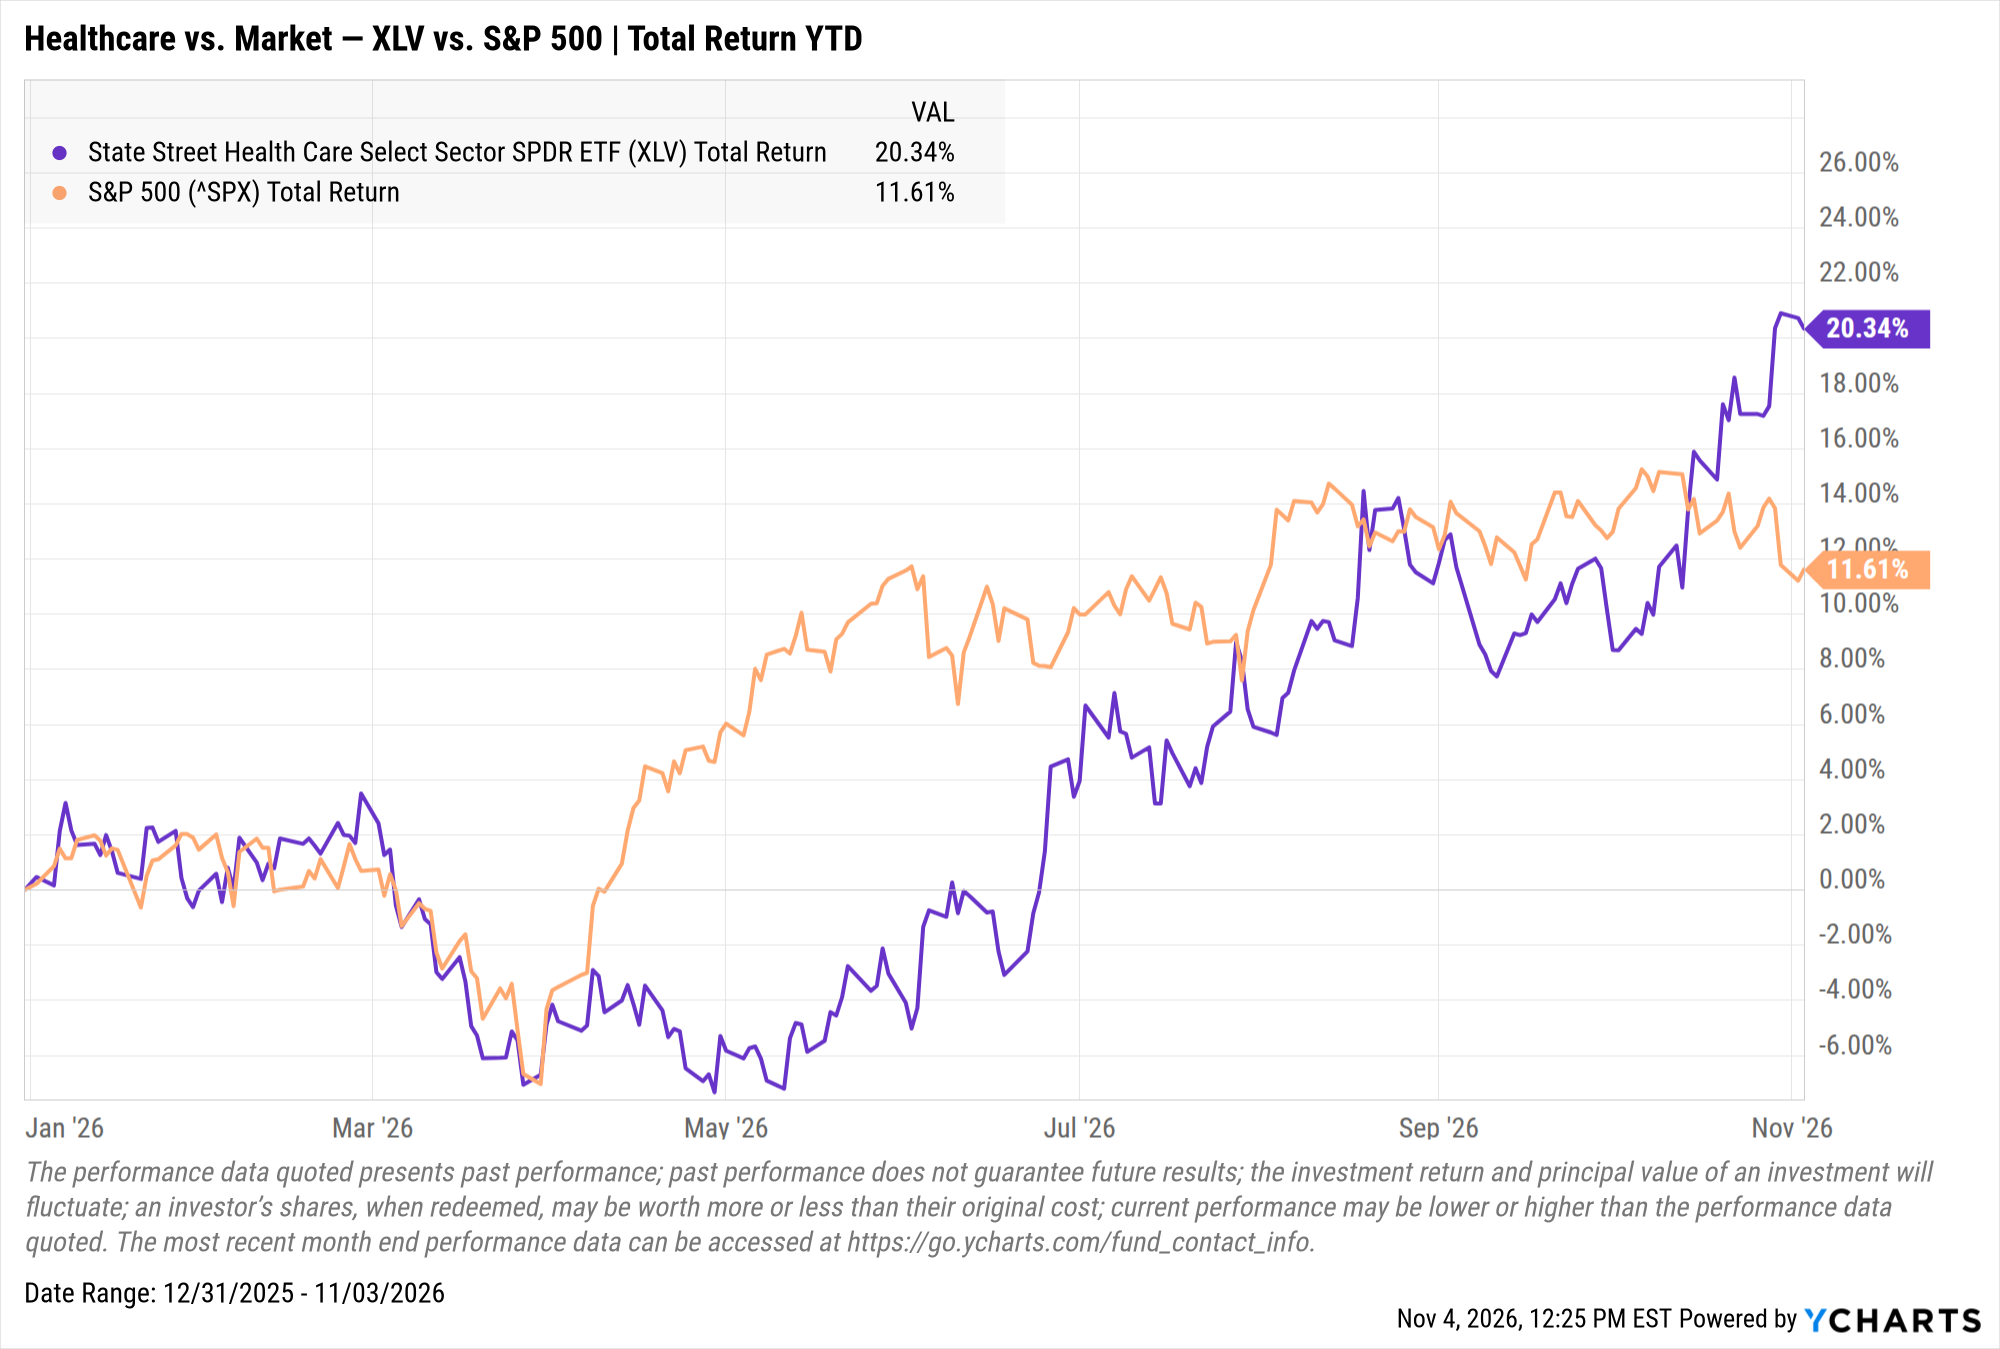
XLV Total Return Level data by YCharts
Clean Energy
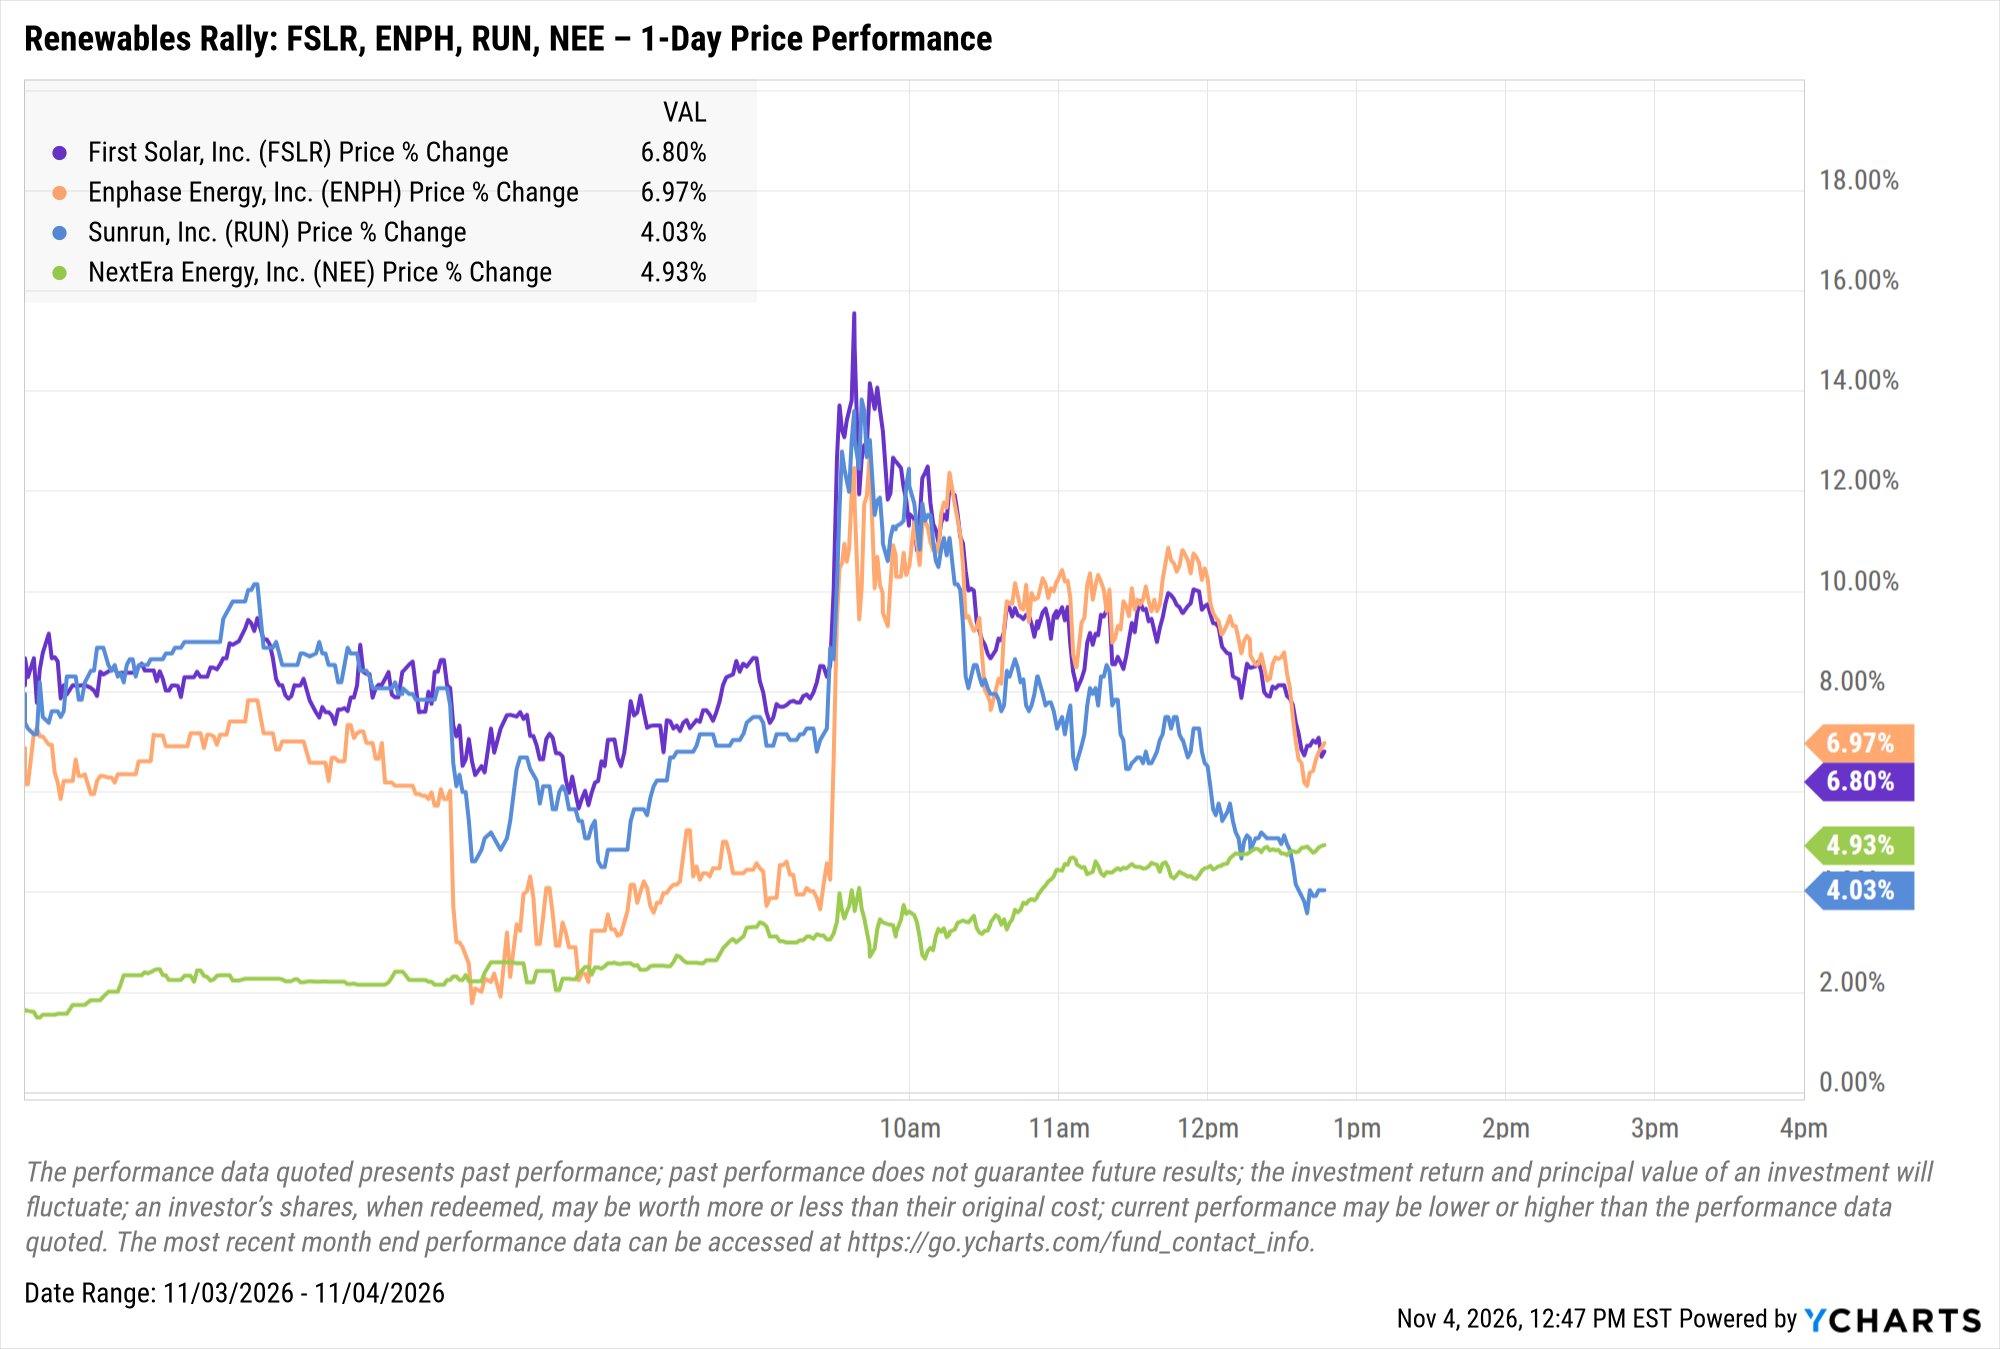
Renewables also rallied, with First Solar, Enphase Energy, Sunrun and NextEra Energy all moving higher, though several gave back part of their early gains. Markets expect Democrats to push for solar tax incentives as part of any funding compromise, even with President Trump signaling he would veto Democratic legislation.
Defense
Defense stocks moved the other way, with L3Harris, Lockheed Martin, RTX and Northrop Grumman among the decliners. Boeing, which has a large commercial aircraft business, was a notable exception. The sector had been counting on a $1.5 trillion budget request clearing a Republican-led Congress.
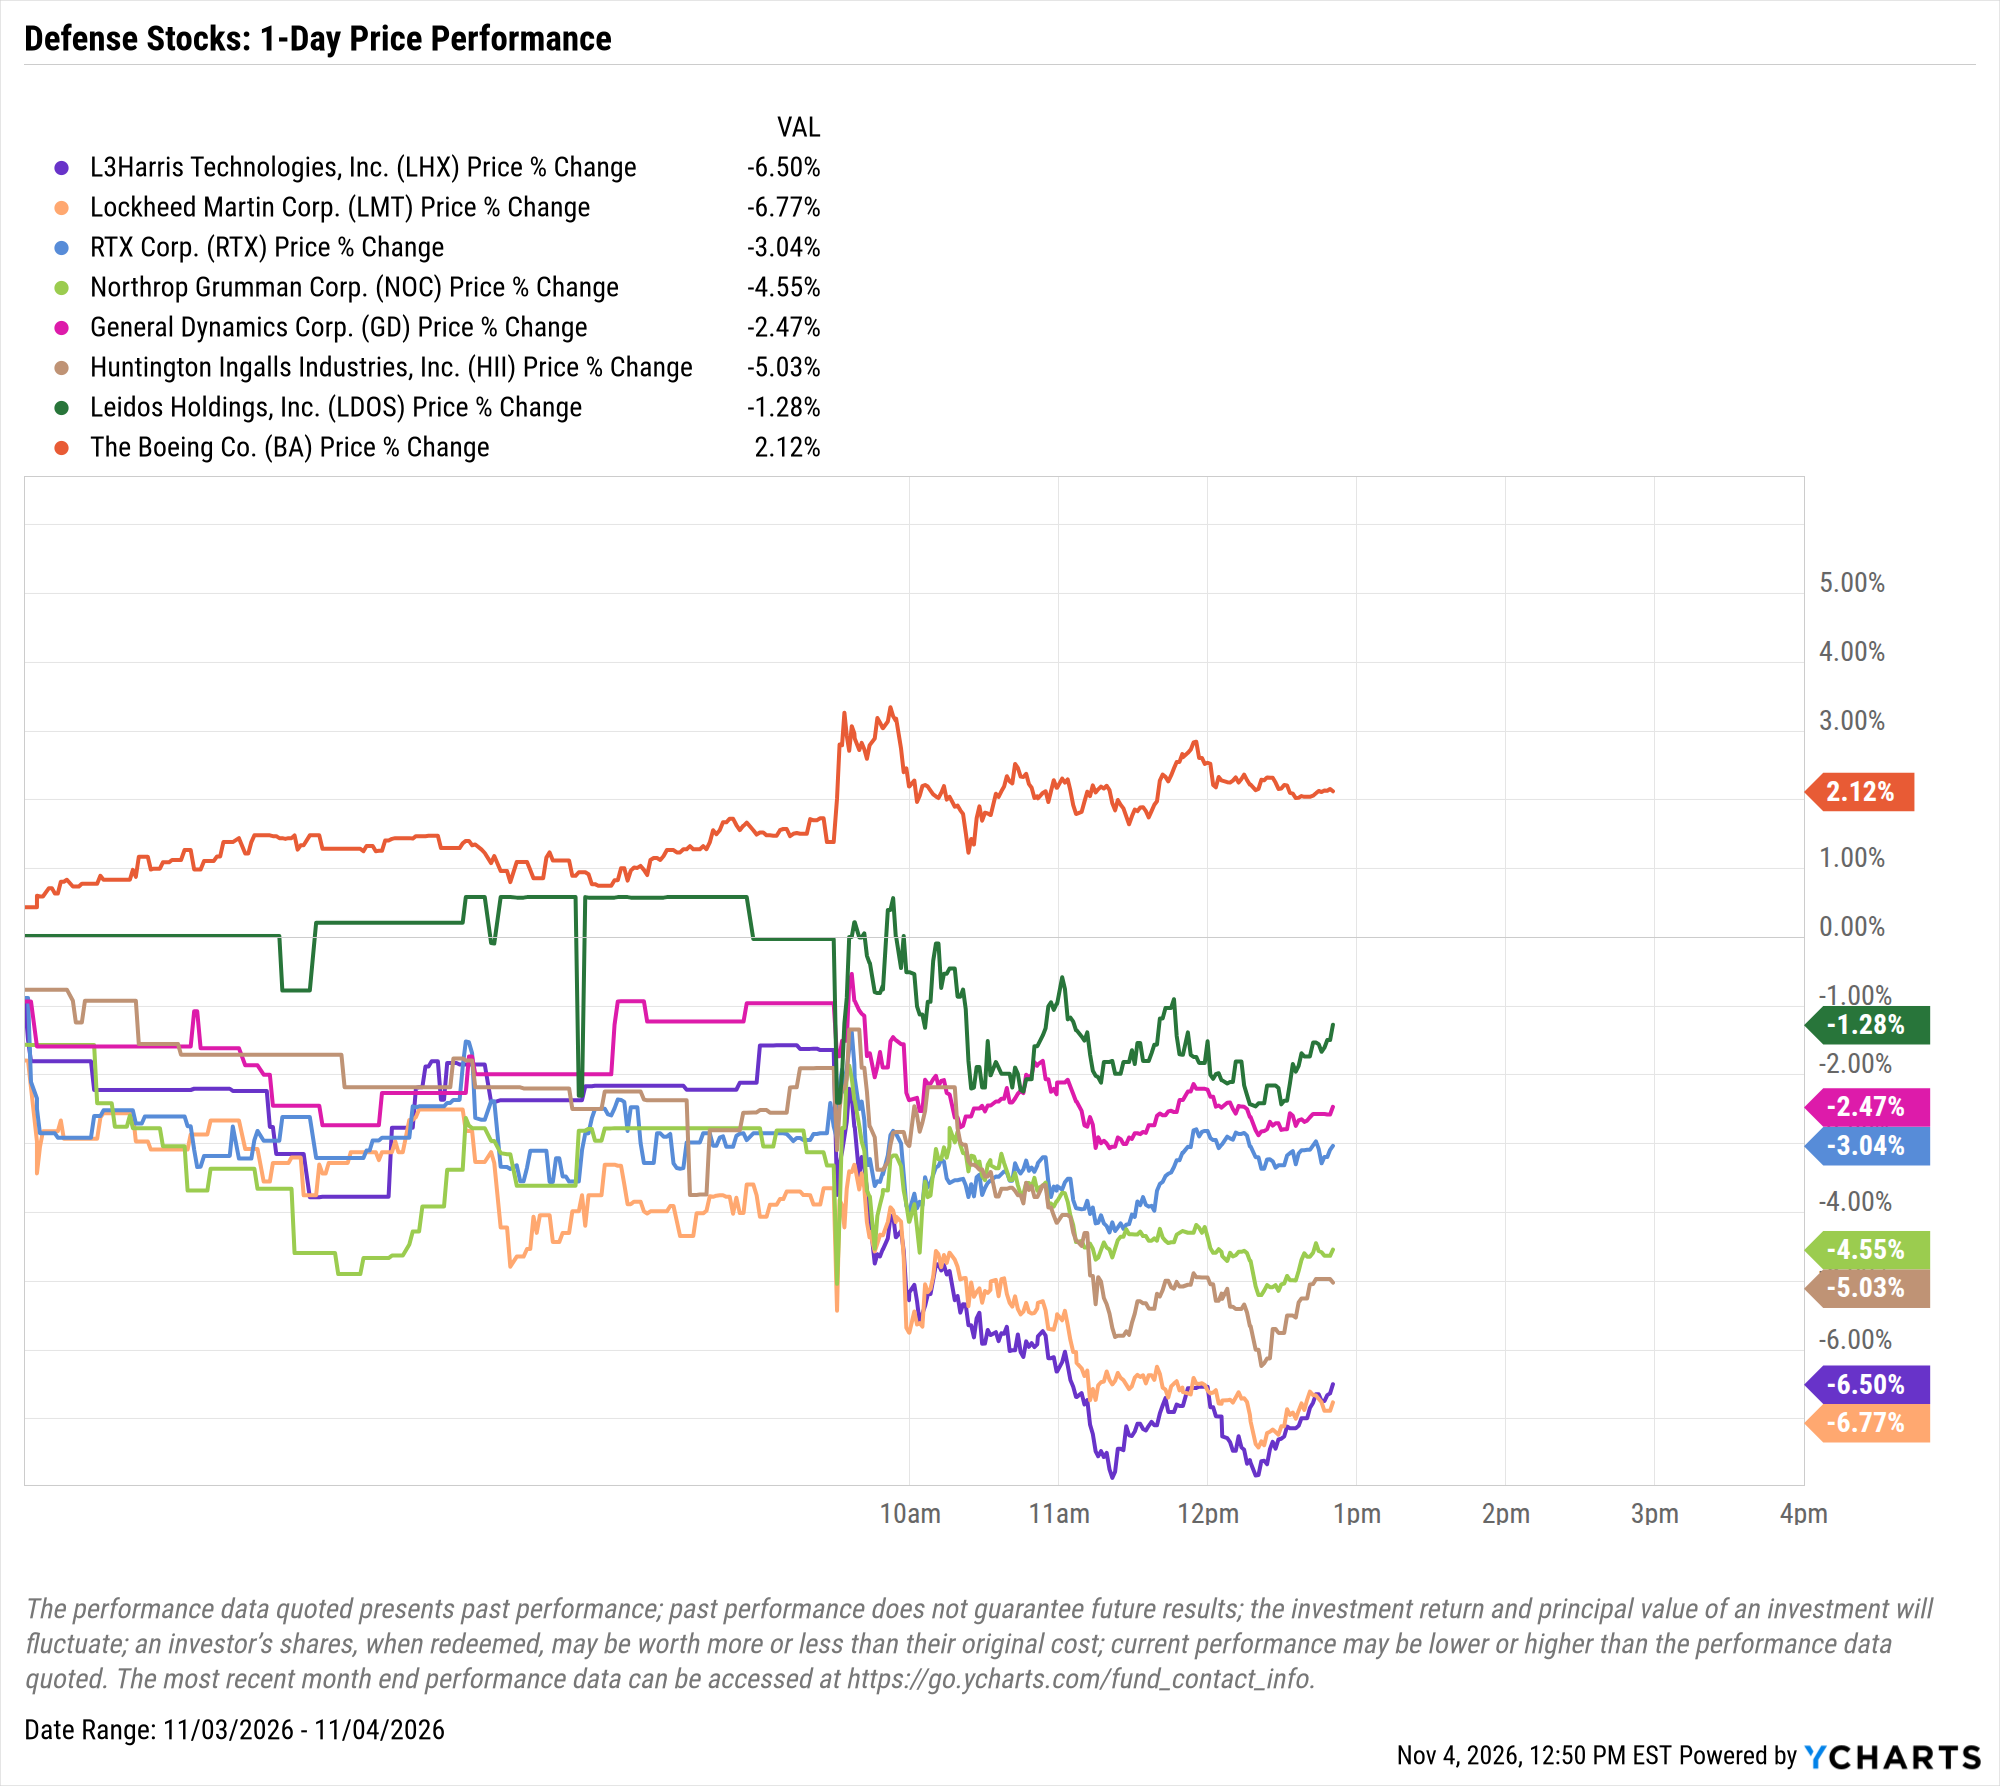
The timeline matters. A budget vote is unlikely before 2027, and Congress has yet to appropriate funds for multibillion-dollar contracts signed to replenish weapons stockpiles. Some analysts see opportunity within the sector, pointing to shipbuilding, autonomous systems and missile defense as likely winners.
Financials and the Credit Card Cap
A cap on credit card interest rates has support from both parties. Financials were the worst S&P 500 sector early in 2026 after President Trump called on Congress to cap card rates at 10%, and a Harvard CAPS/Harris poll found 72% of respondents, including similar shares of Democrats and Republicans, supported a one-year 10% cap. With Democrats in control, Evercore ISI expects them to push a cap that would force Trump to sign or veto it.
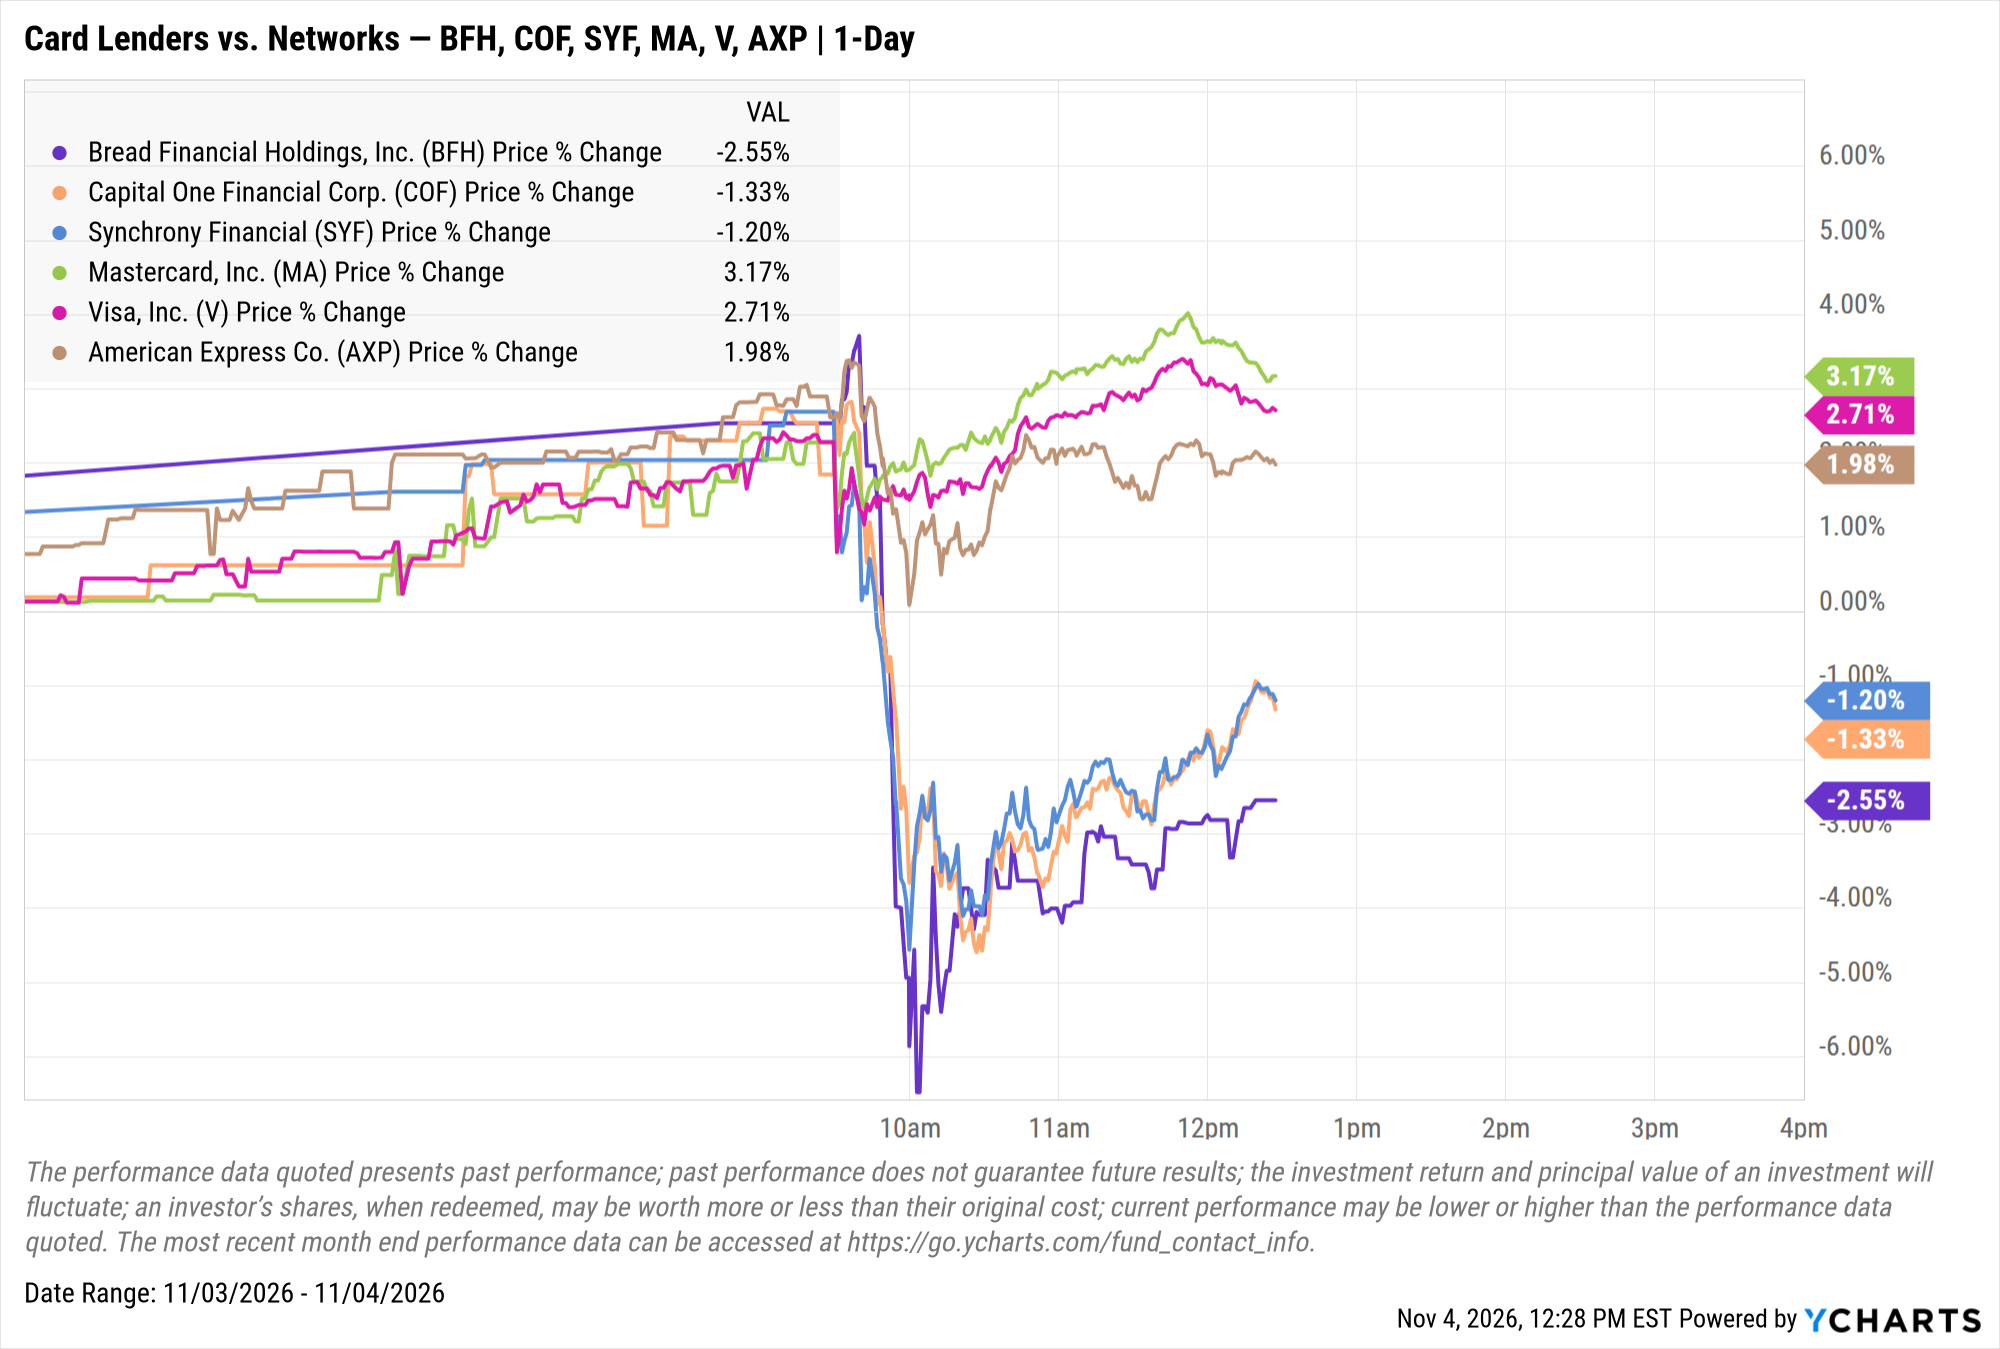
The market is drawing a clear line between lenders and networks. Card-heavy lenders such as Bread Financial, Capital One and Synchrony Financial fell, while payment networks Mastercard and Visa rose despite their swipe-fee exposure. American Express, which operates as both lender and network, also moved higher.
Other Notable Moves
Private prison operators GEO Group and CoreCivic fell, while gold rallied as Treasury yields and the dollar moved lower. Semiconductor stocks such as Micron and NVIDIA lagged the broader rally. The sharpest declines came in smaller AI infrastructure companies, which is where many of the most detailed client questions will come from.
Why Are Markets Treating Democratic Wins as a Risk for AI?
The concern is less about Washington and more about states, where data center permits, tax incentives and utility rules are decided.
Hinojosa campaigned on a moratorium on new data center construction, stricter water and power rules, and an end to related tax breaks. Texas alone is a major share of the pipeline: Wells Fargo estimates 27% of planned U.S. data center gigawatts sit in the state, and a SemiAnalysis model puts Texas at close to 30% of U.S. capacity additions forecast for 2028.
Texas is not the only state in focus. Democrats also won or held governorships in Georgia, Ohio and Pennsylvania, which Wells Fargo estimates represent 7%, 5% and 5% of planned U.S. data center gigawatts. Estimates of the total exposure across affected states fall in a similar range. Goldman Sachs economists said Democratic wins at the state and local level could lead to short-term moratoria potentially affecting about 45% of planned U.S. data center capacity expansion, while Bloomberg reported roughly half of proposed U.S. AI data center additions could face stricter local scrutiny.
At the federal level, the picture is different. Goldman’s economists said the outcome is less likely to change the federal outlook for data center and AI regulation, which would still need bipartisan support.
Views differ on how much this matters for the buildout. Morgan Stanley strategists flagged incrementally negative AI sentiment on expectations for data center restrictions, while BofA economist Stephen Juneau said the firm does not expect these policies to derail the AI buildout, though they could make it slower and more expensive.
Resistance to data centers predates the election and crosses party lines. Abbott himself halted data center permitting in September. An NBC News exit poll showed 76% of voters opposed building a new data center in their community, and earlier Politico polling found 65% of Democratic voters and 36% of Republican voters opposed them. Many analysts view the election results as accelerating an existing trend rather than creating a new one.
Why Would Slower Data Center Building Matter for the Economy?
AI infrastructure spending has become one of the largest sources of U.S. economic growth. Bridgewater estimates AI capital expenditures will add roughly 140 basis points to U.S. growth in 2026 and about 150 basis points in 2027, a contribution on par with business investment during the tech bubble. ING economist James Knightley estimates AI investment accounts for roughly one-third of U.S. gross domestic product (GDP) growth this year.
Much of that spending comes from a handful of companies. Microsoft, Amazon, Alphabet and Meta are among the largest builders of AI data centers, and their capital expenditures are a direct measure of how much is flowing into the buildout.
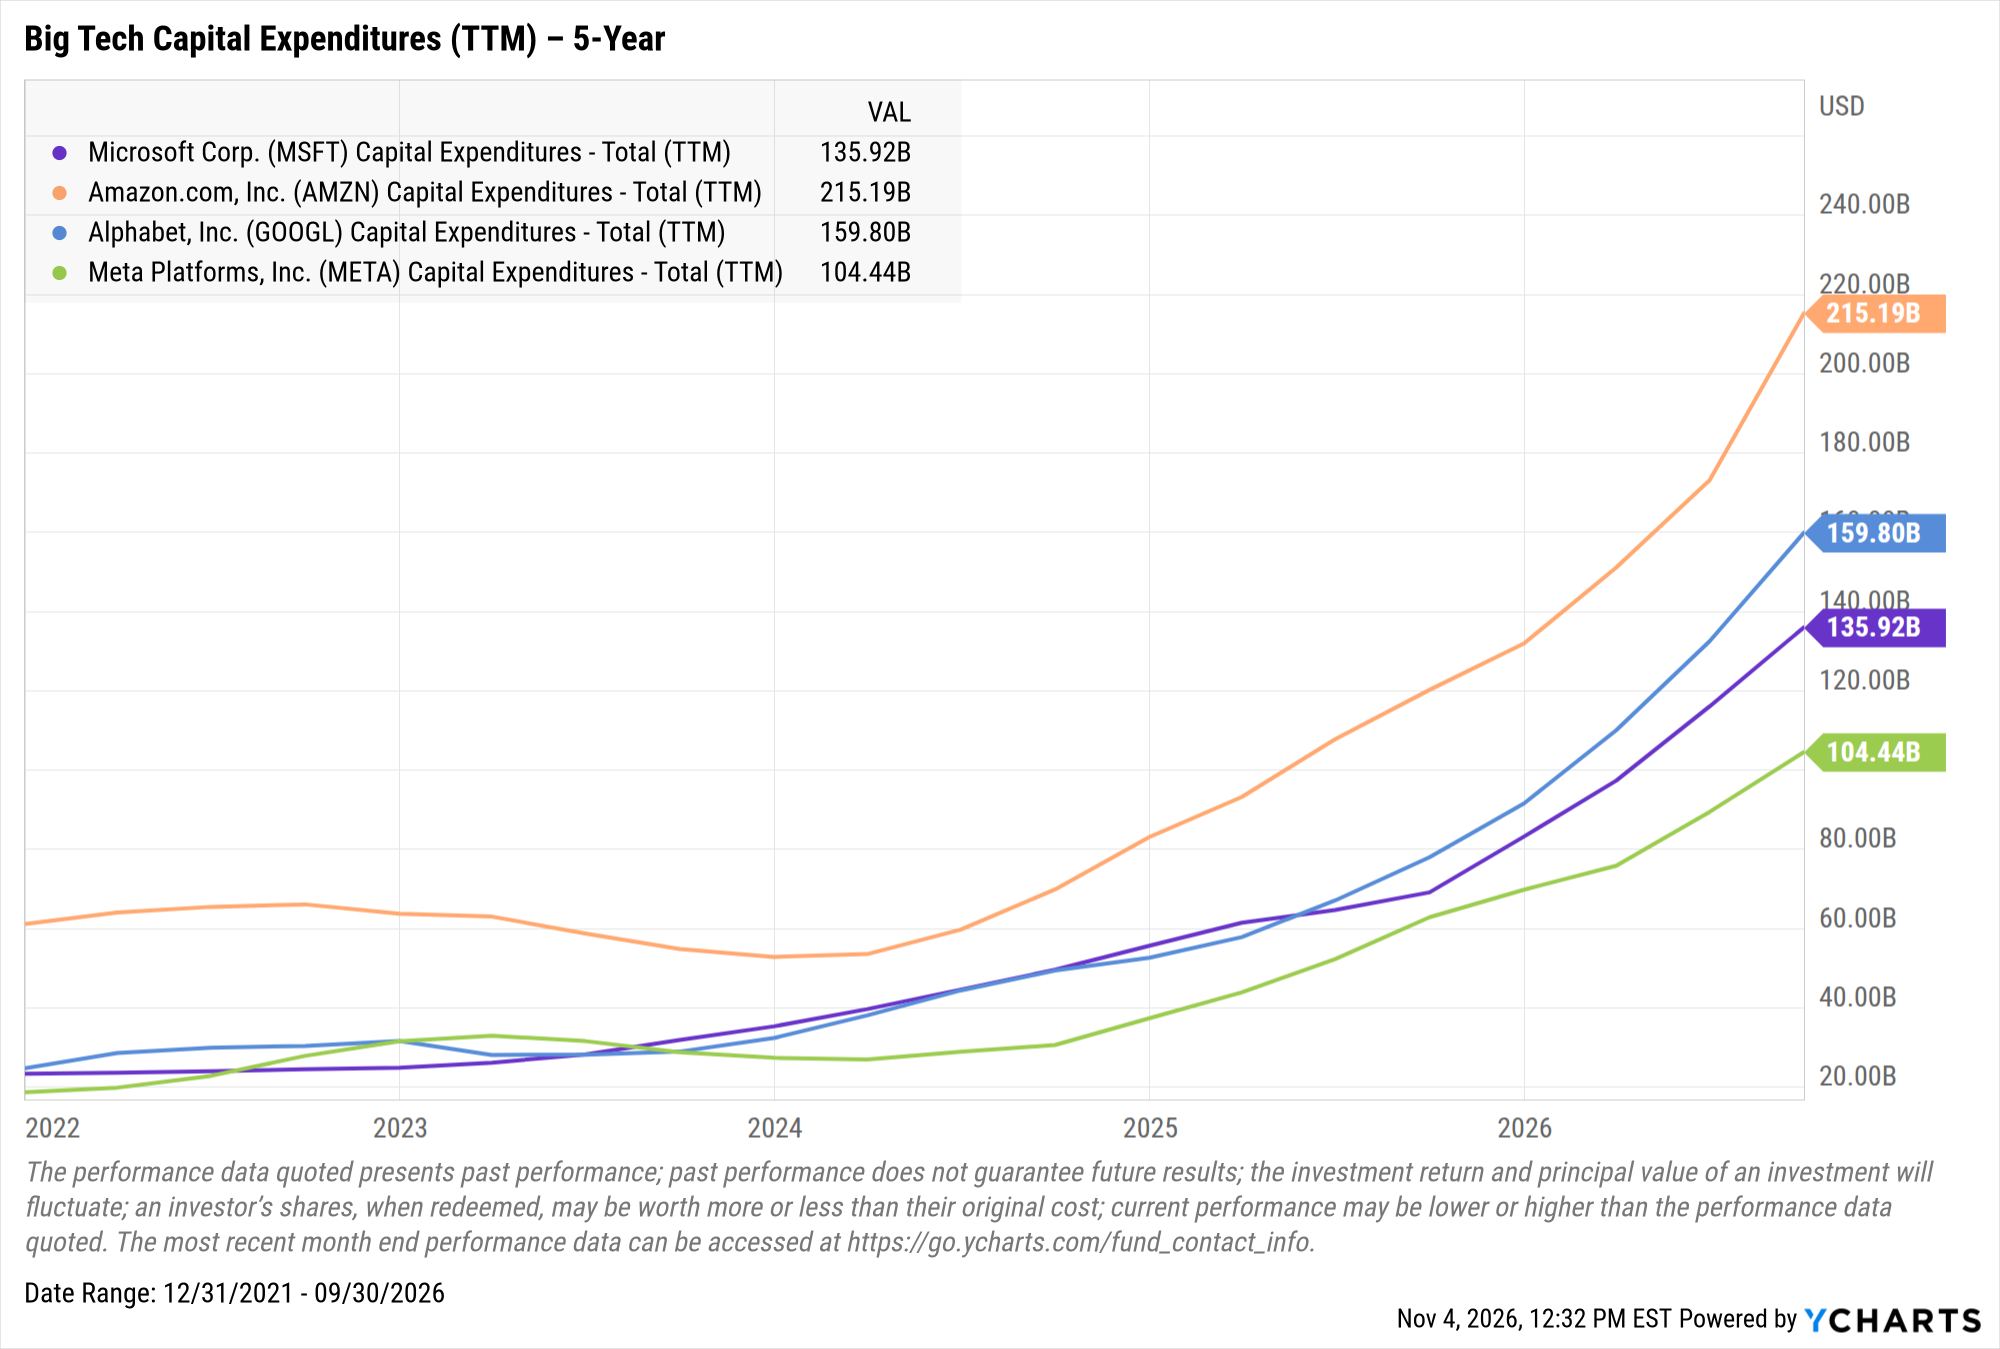
Each of the four companies has more than doubled its trailing 12-month capital expenditures since the start of 2024. Combined, they spent more than $615 billion over the last 12 months.
When one category of spending carries that much of the growth, anything that slows it, whether permitting delays, higher costs or lost tax incentives, can ripple into the broader economy.
There is another side. Research suggests the net contribution to GDP growth is more limited than headline investment figures imply, because a large share of AI hardware is imported. Data centers also require relatively little labor compared to their capital costs, so the boom provides limited support to the job market. For many voters, the costs are local and visible: utility bills, water use and land.
Is AI Demand Actually Slowing?
Not based on the latest earnings. AMD shares moved higher after third-quarter results and guidance topped expectations. Q3 revenue rose 45% year over year to $13.38 billion, and Data Center revenue rose 97% to $8.55 billion, ahead of estimates of $8.2 billion. AMD guided Q4 revenue to $17 billion, plus or minus 3%, above the $16.29 billion consensus estimate.
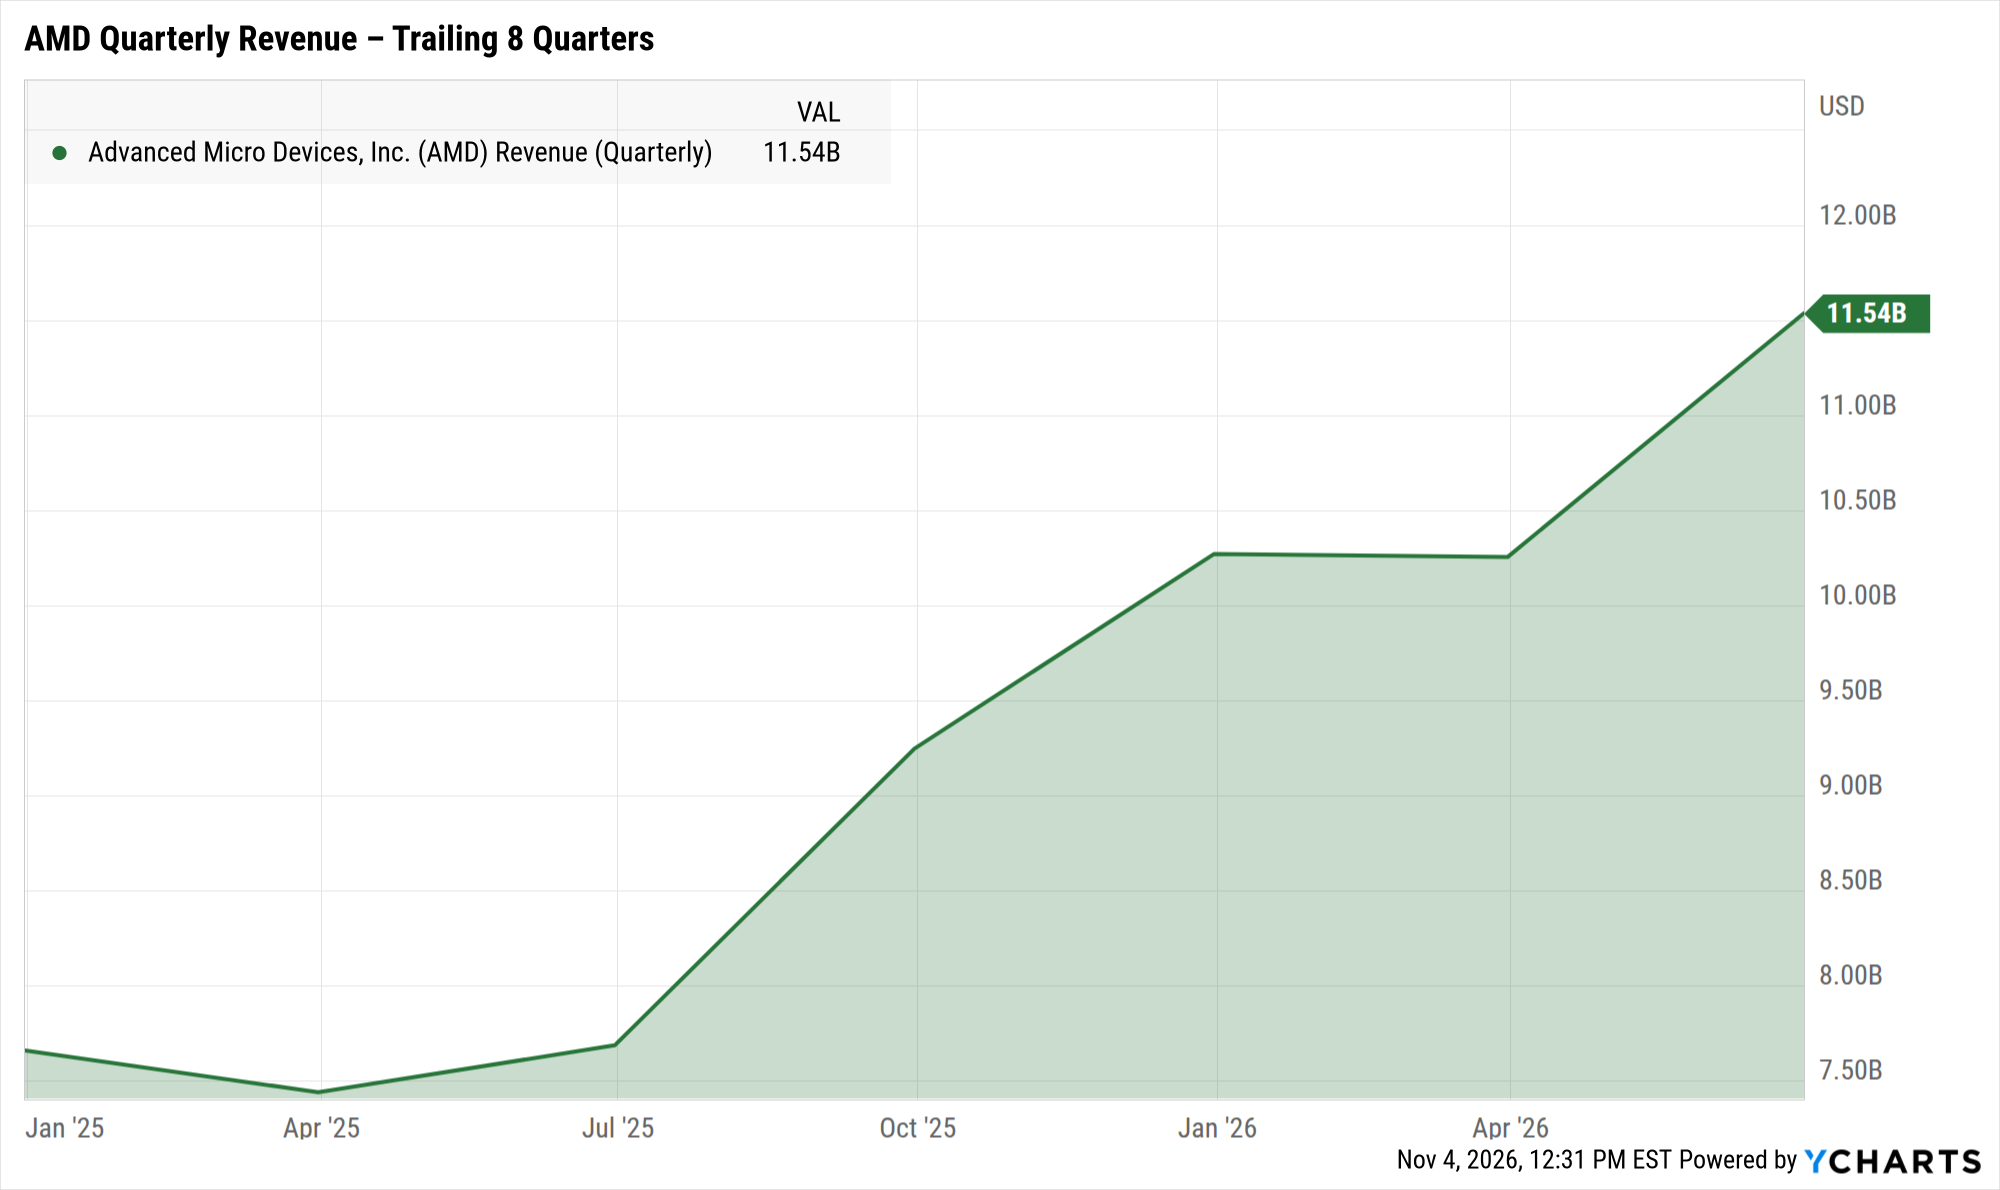
AMD Revenue (Quarterly) data by YCharts
Chart reflects reported quarters through Q2 2026. Q3 results, released this week, are not yet reflected.
The distinction matters for clients. Current demand for AI computing power remains strong. The policy risk is about where and how quickly new capacity gets built, which will play out over years of permitting decisions rather than one trading session.
Why Are Some Tech Stocks Hitting Record Highs?
Not all of technology moved in the same direction. While smaller AI infrastructure companies with concentrated Texas exposure fell, several of the largest and most diversified technology companies rallied, including Amazon, Apple, Microsoft, Alphabet and Meta Platforms. Apple and Microsoft each hit all-time highs, sending Apple’s market cap above $5 trillion.
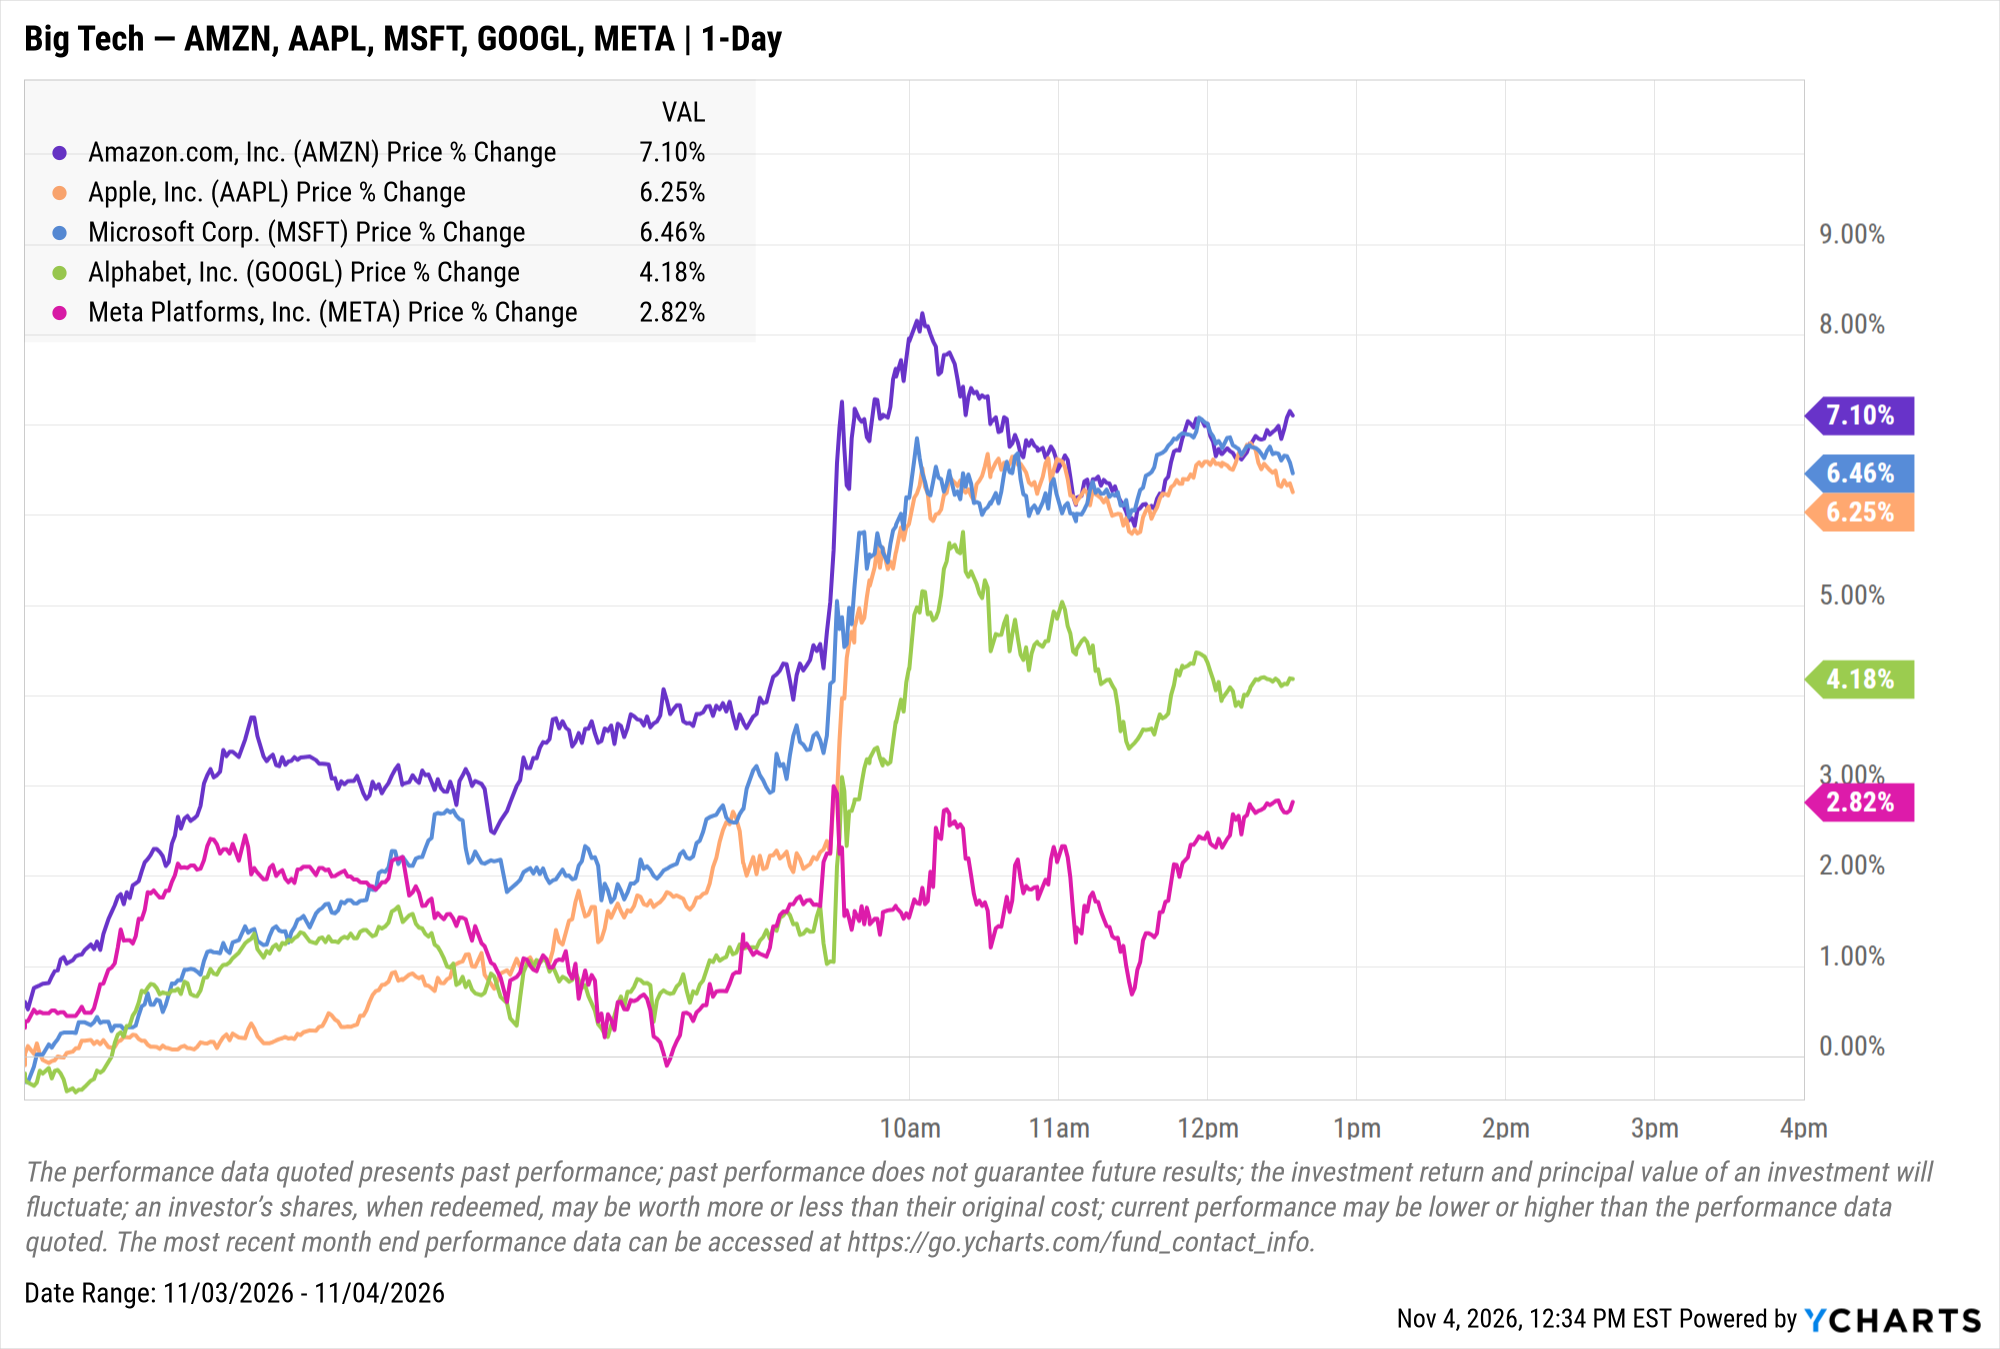
Analysts offered several explanations for Apple in particular. Evercore ISI’s Amit Daryanani pointed to Apple as a defensive holding amid policy uncertainty, noting its earnings are driven by iPhone pricing and services rather than data center construction. He also noted that delayed data center projects could cool memory chip prices, which have been a major cost headwind for Apple.
For clients, the takeaway is that “tech” is not a single trade. Companies with diversified revenue reacted very differently from companies whose growth depends on new data center construction in specific states.
Which AI Infrastructure Companies Are Most Exposed?
Several companies have significant Texas projects:
- CoreWeave has contracted capacity at Galaxy Digital’s Helios campus in West Texas.
- Cipher Digital is building its Black Pearl facility near Wink, Texas, for Amazon Web Services under a 15-year lease.
- Riot Platforms signed a data center lease with AMD at its Rockdale site.
- Hut 8 has commercialized 704 MW of IT capacity at its Beacon Point campus in Nueces County.
- Core Scientific is converting its Denton site for high-performance computing.
Most of these stocks rallied sharply into the vote and reversed after the results, with Cipher and Hut 8 posting some of the steepest declines. Riot was the exception, moving higher.
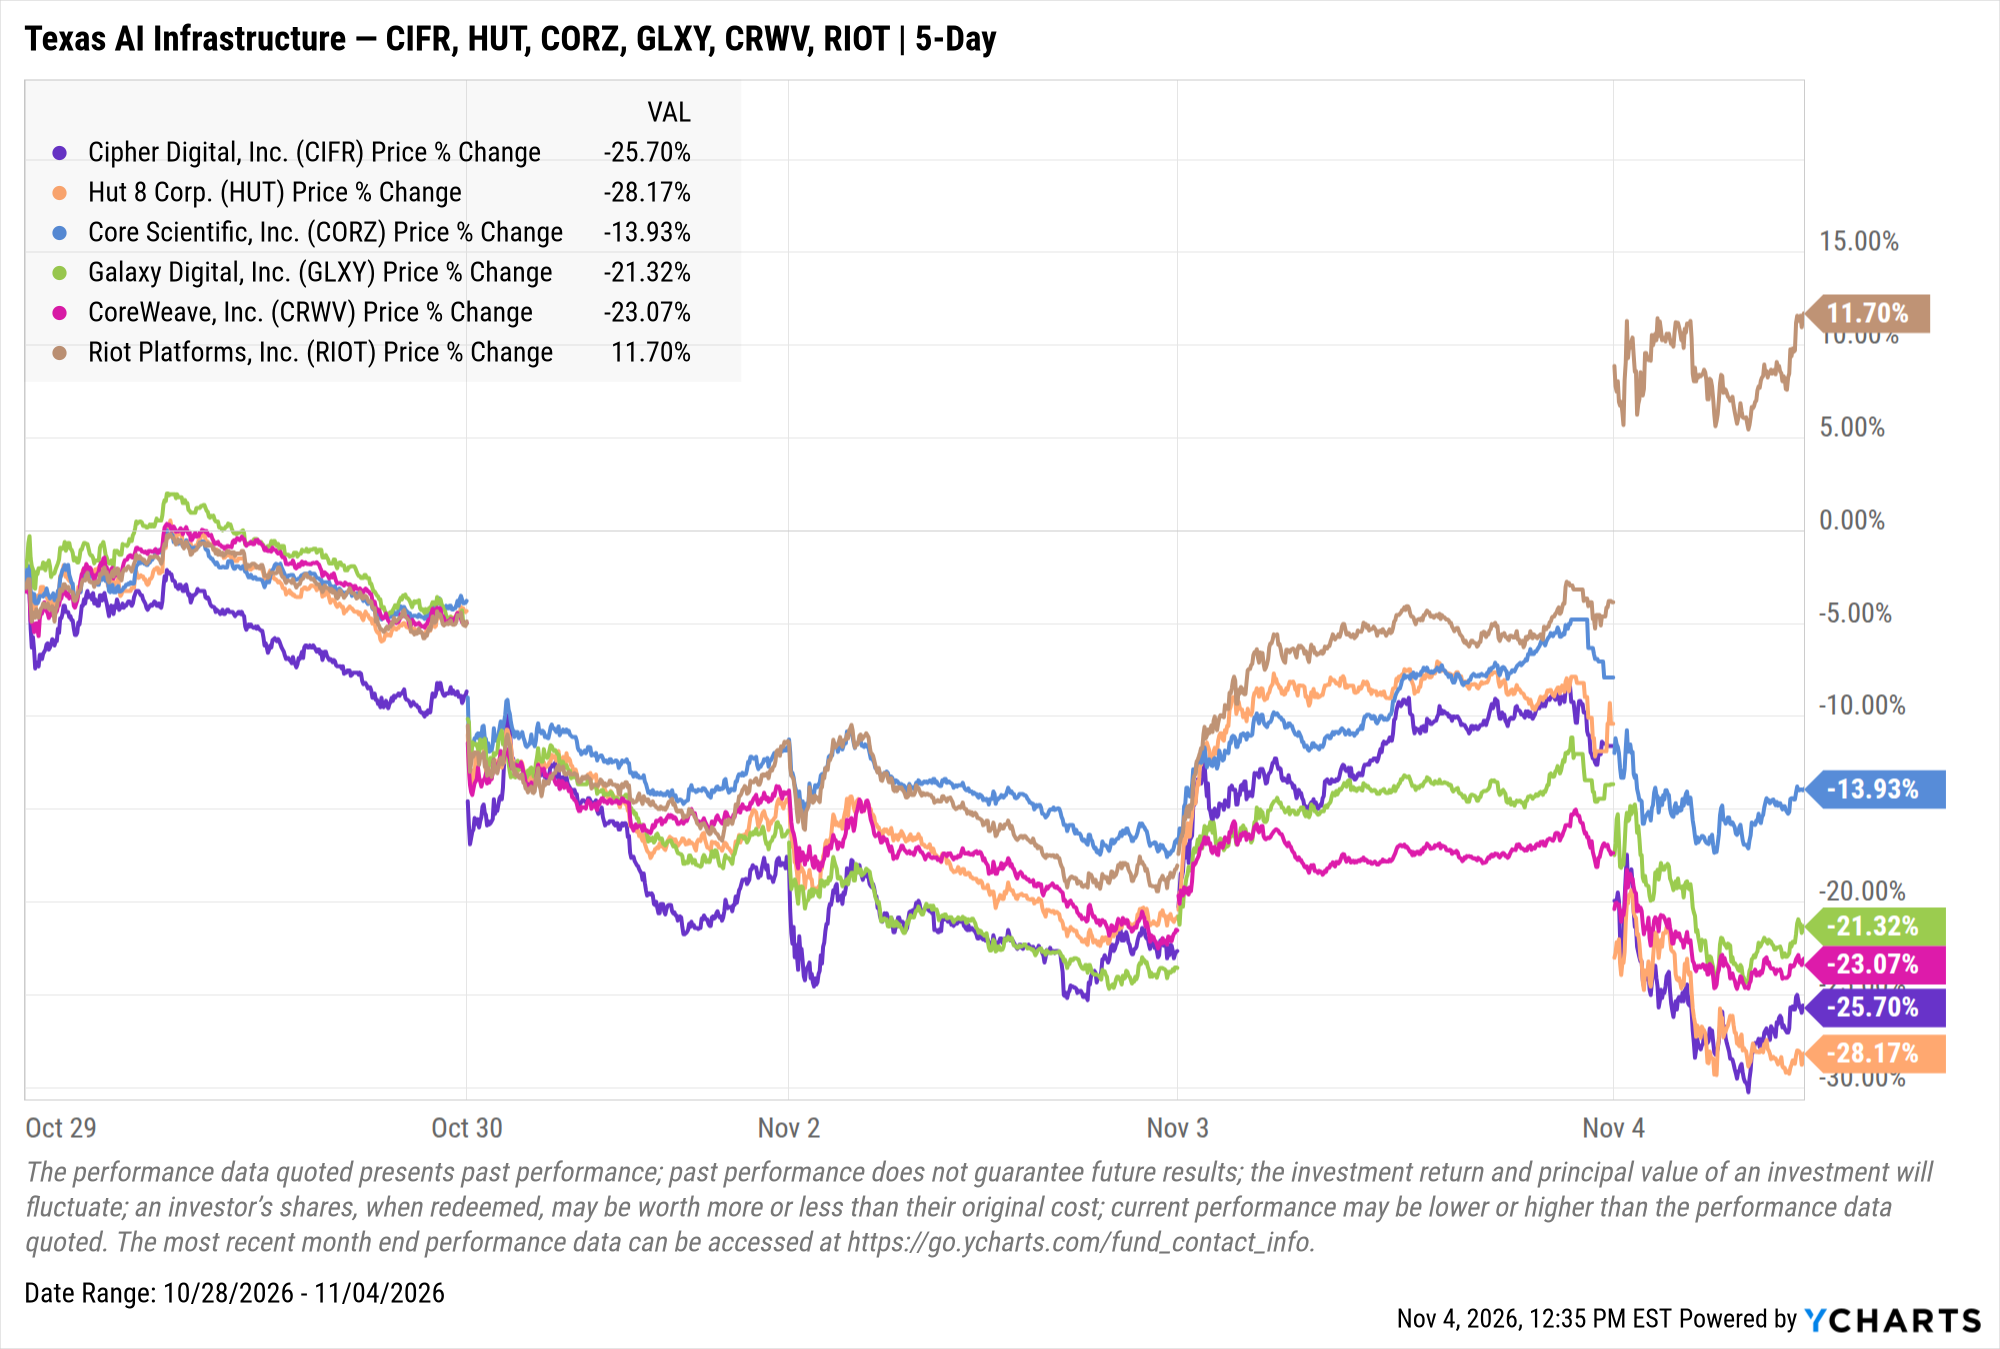
Analysts are split on how much the pipeline actually shrinks. Some expect the 2027 Texas legislative session to bring tighter rules on grid costs, water use and tax incentives that raise development costs rather than materially restrict the pipeline.
What Does This Mean for Interest Rates?
Treasury yields fell across the curve as traders priced in divided government, with a Democratic Congress likely to limit new fiscal expansion under a Republican president. The 10-Year Treasury Rate remains below its mid-October levels above 5%. Lower yields ease pressure on borrowers, including mortgage holders, and helped gold rally as the dollar weakened.
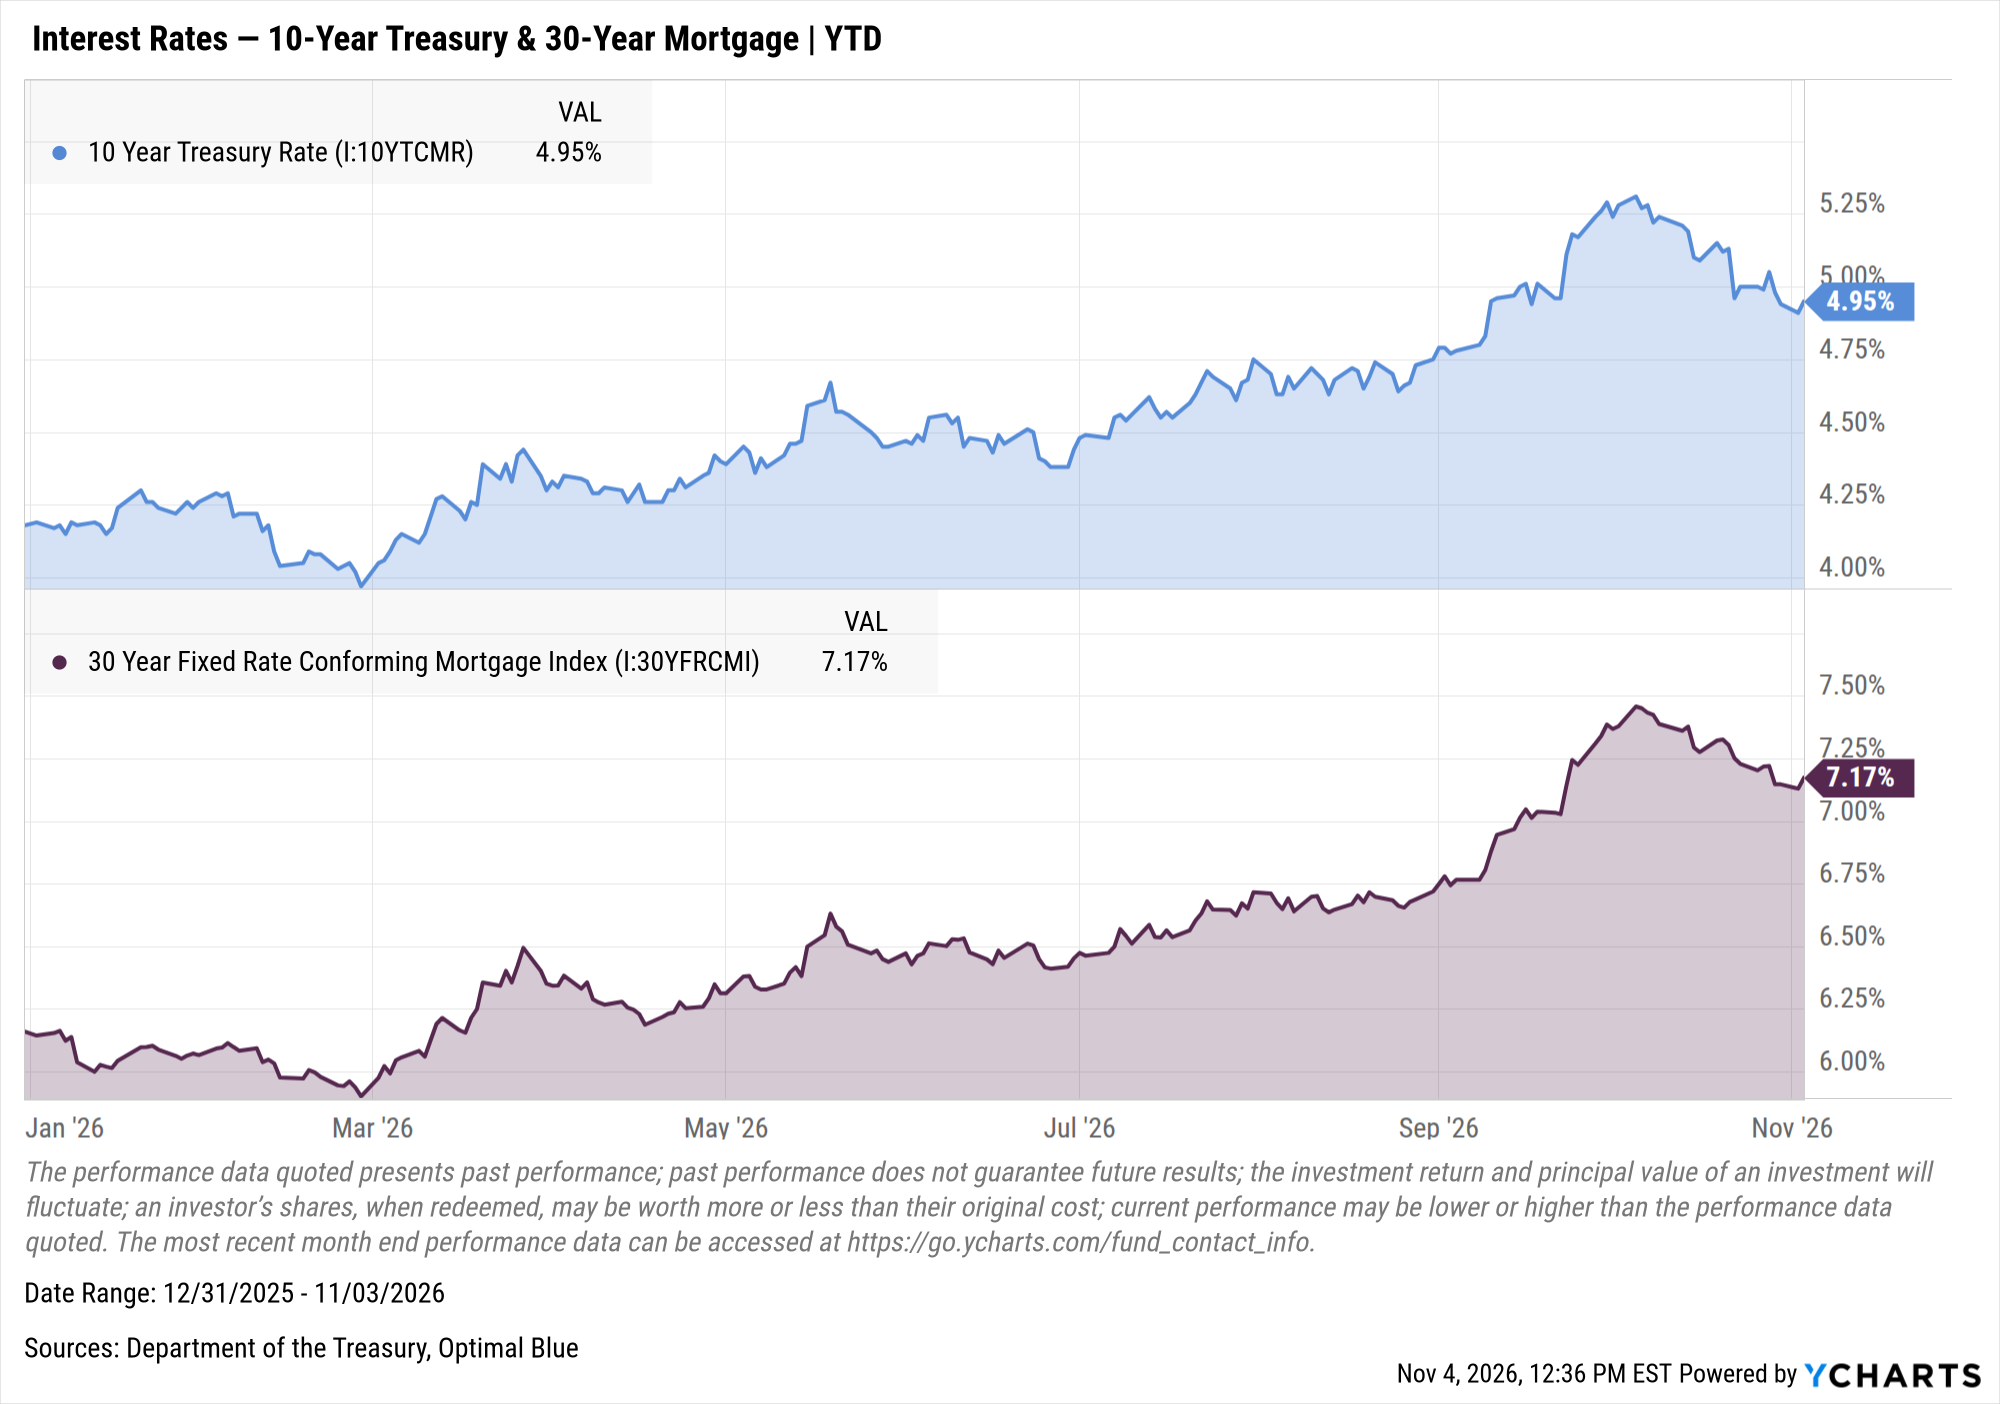
10 Year Treasury Rate data by YCharts
Should I Change My Portfolio?
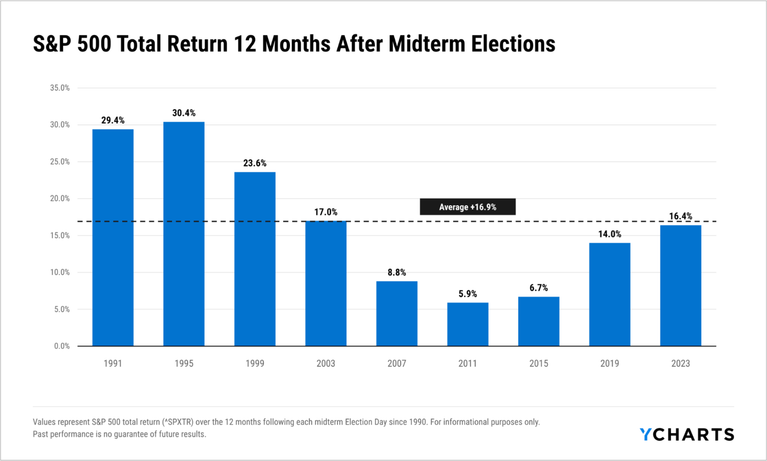
History argues against reacting to election results. In every midterm cycle since 1990, the S&P 500 was higher 12 months after Election Day. The makeup of Congress has mattered at the margin: under Republican presidents, the S&P 500 averaged 23% the year after midterms with a split Congress, compared with 16% when Democrats controlled both chambers, according to Morgan Stanley. Both outcomes were positive, and BofA strategists said they expect any knee-jerk equity sell-off to be temporary.
That does not mean sector exposure should be ignored. Clients with concentrated positions in AI infrastructure, defense or card lenders may want to review how much of that exposure depends on policy decisions still to come. But a long-term plan built on fundamentals has mattered more than any single election night.
Turning Election Questions Into Better Conversations
Elections create urgency, and urgency creates opportunity. Clients who call this week are looking for perspective, not predictions. Advisors who can show what history says, what is driving markets now and how a client’s portfolio is positioned will turn a reactive call into a planning conversation.
YCharts gives advisors the charts, data and portfolio analytics to answer each of these questions in one platform, in a format clients can understand.
Whenever you’re ready, there are two ways YCharts can help you:
1. Looking for a tool to help you better communicate market events?
Email us at hello@ycharts.com or call (866) 965-7552. You’ll be directly in touch with one of our Chicago-based team members.
2. Want to test out YCharts for free?
Start a no-risk 7-Day Free Trial.
Disclosure
©2026 YCharts, Inc. All Rights Reserved. YCharts, Inc. (“YCharts”) is not registered with the U.S. Securities and Exchange Commission (or with the securities regulatory authority or body of any state or any other jurisdiction) as an investment adviser, broker-dealer or in any other capacity, and does not purport to provide investment advice or make investment recommendations. This report has been generated through application of the analytical tools and data provided through ycharts.com and is intended solely to assist you or your investment or other adviser(s) in conducting investment research. You should not construe this report as an offer to buy or sell, as a solicitation of an offer to buy or sell, or as a recommendation to buy, sell, hold or trade, any security or other financial instrument. For further information regarding your use of this report, please go to: ycharts.com/about/disclosure
Next Article
The 10 Best Performing ETFs Over the Last 10 YearsRead More →