Is the Housing Market Going to Crash?
Following a 2021 where the housing market was on fire, things dampened quickly in 2022. From building permits to sales volume and nearly everything in between, it seemed the only housing-related data points that weren’t going up were home inventories. Now, home sales have fizzled, new building permits have slowed, and prices have fallen as mortgage rates rise rapidly and inventories come online. The whiplash has prompted many to speculate that the housing market might crash. Will it?
The State of Supply and Demand in the Housing Market
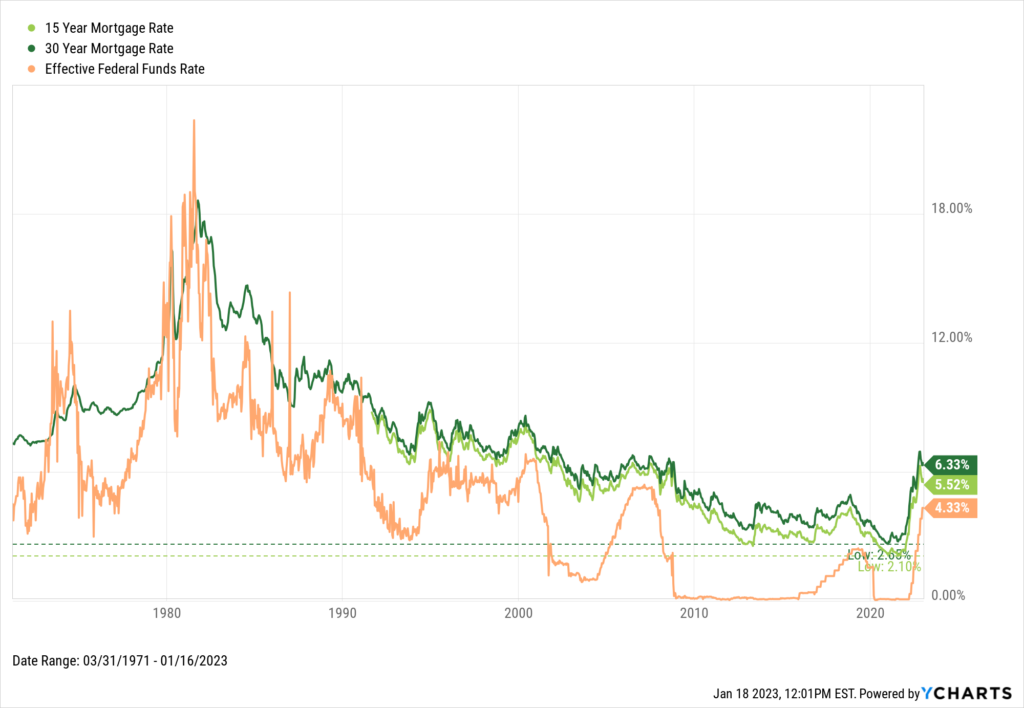
A key factor contributing to the recent housing market slowdown has been changes to the Fed Funds Rate. Less than a year ago, the Effective Federal Funds Rate was 0%. It’s now 4.33%. These rate hikes have made all forms of borrowing more expensive, but notably pushed the 15 Year and 30 Year Mortgage Rates from historic lows to levels last seen just prior to the Great Financial Crisis.
Download Visual | Modify in YCharts
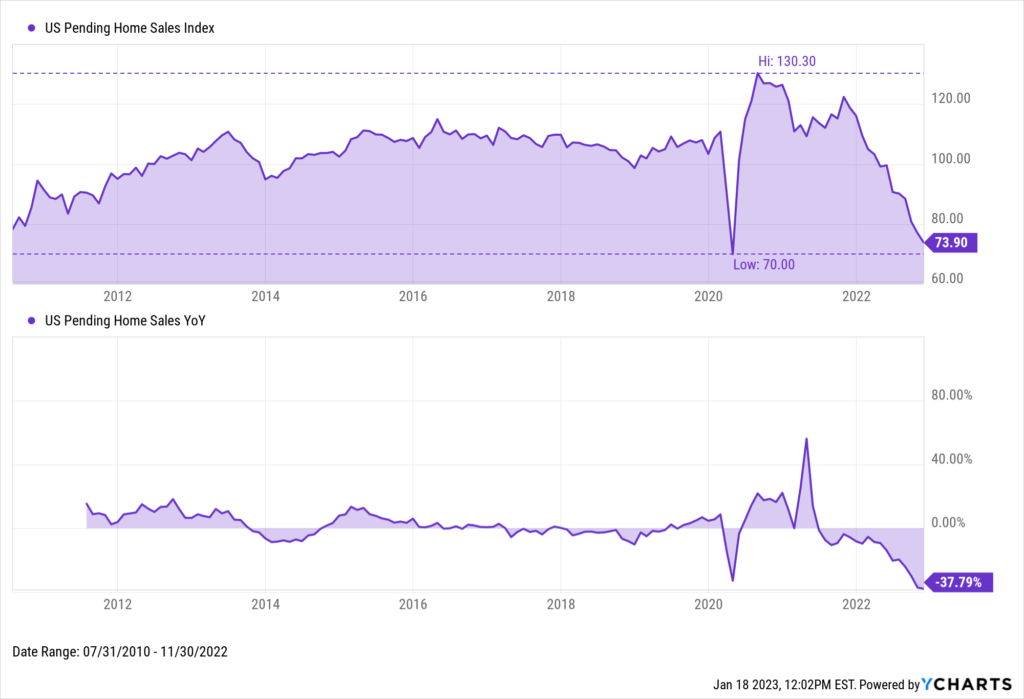
As a result, fewer Americans are enthused about purchasing homes with an expensive mortgage rates attached. The US Pending Home Sales Index has tumbled since the end of 2021 to its lowest level since April 2020. The latest data available from November 2022 shows a pending home sales decline of 37.8% YoY, the largest on record.
Download Visual | Modify in YCharts
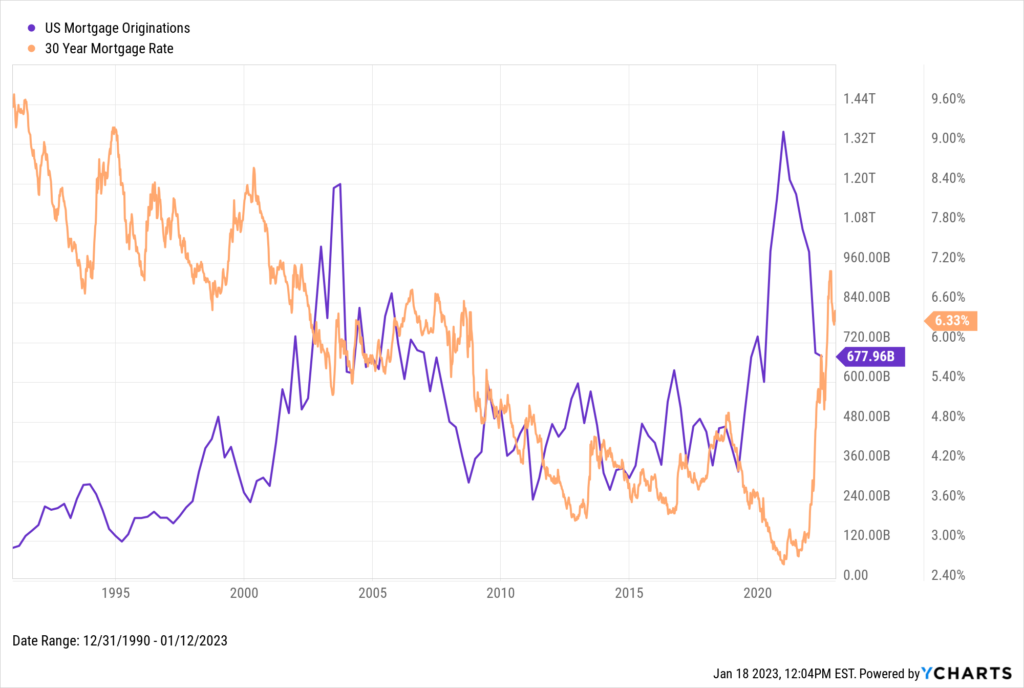
$1 trillion or more worth of US Mortgage Originations occurred in each of the seven quarters between Q2 2020 and Q4 2021. As of Q2 2022, the total sum of mortgage originations was cut cleanly in half from Q4 2020’s high of $1.36T. Mortgage originations first topped $1 trillion back in 2003 as mortgage rates fell, but plunged as rates rose again. A similar pattern played out starting in 2020, but mortgage rates have increased much more voluminously this time around. If rates go even higher, it’s likely mortgage originations will continue to decline.
Download Visual | Modify in YCharts
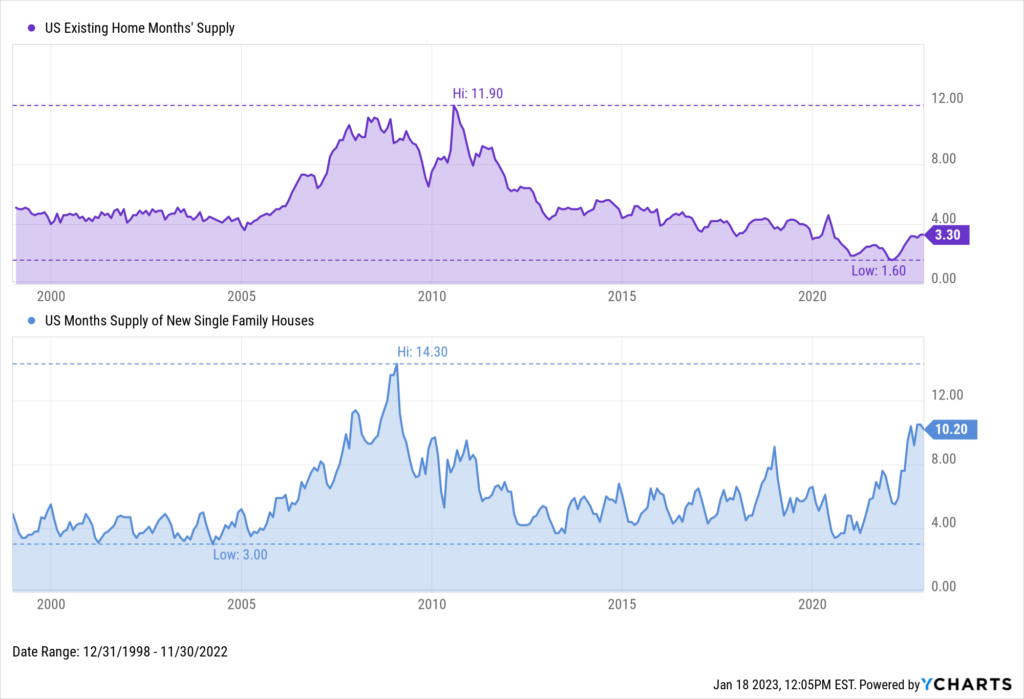
The slowdown in home sales has caused inventory levels to rise drastically. “Months supply” is the number of months it would take to sell the current inventory of homes available on the market. US Existing Home Months Supply and US Months Supply of New Single Family Houses have both doubled since last January, from 1.6 to 3.3 and 5.6 to 10.2, respectively. In other words, housing supply has doubled relative to housing demand.
Download Visual | Modify in YCharts
Current Readings on Home Building Activity
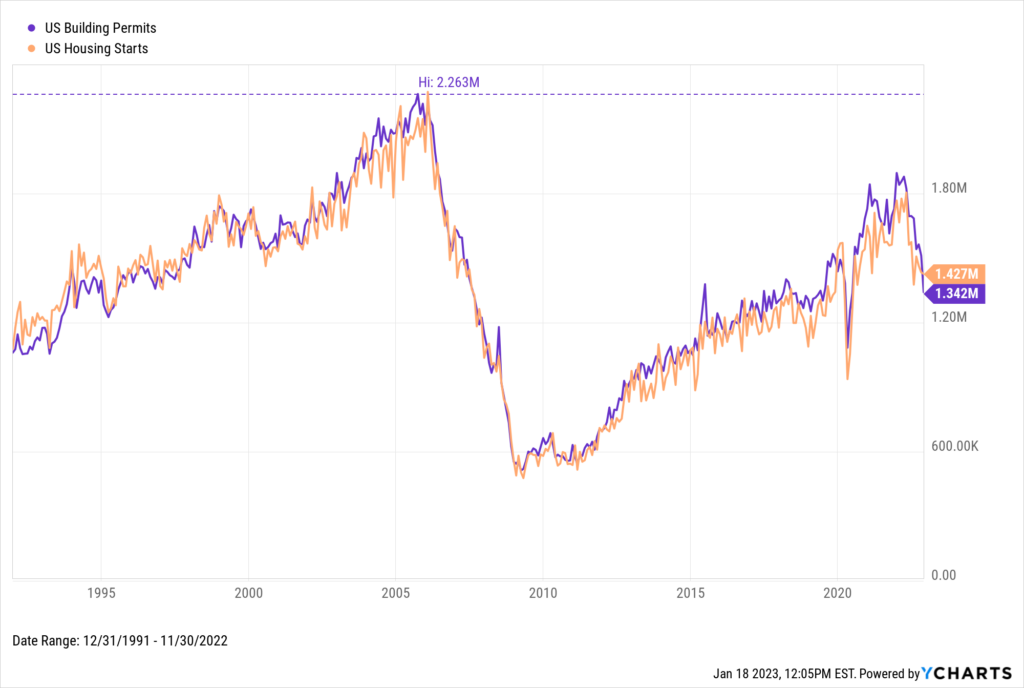
Homebuilding activity levels have also reduced along with the slowdown in home purchases. In December of 2021, the number of US Building Permits reached its highest level since just before the Great Financial Crisis. US Housing Starts achieved the same feat four months later. Less than one year later, housing starts and building permits plunged 20.9% and 29.2% below their respective recent highs.
Download Visual | Modify in YCharts
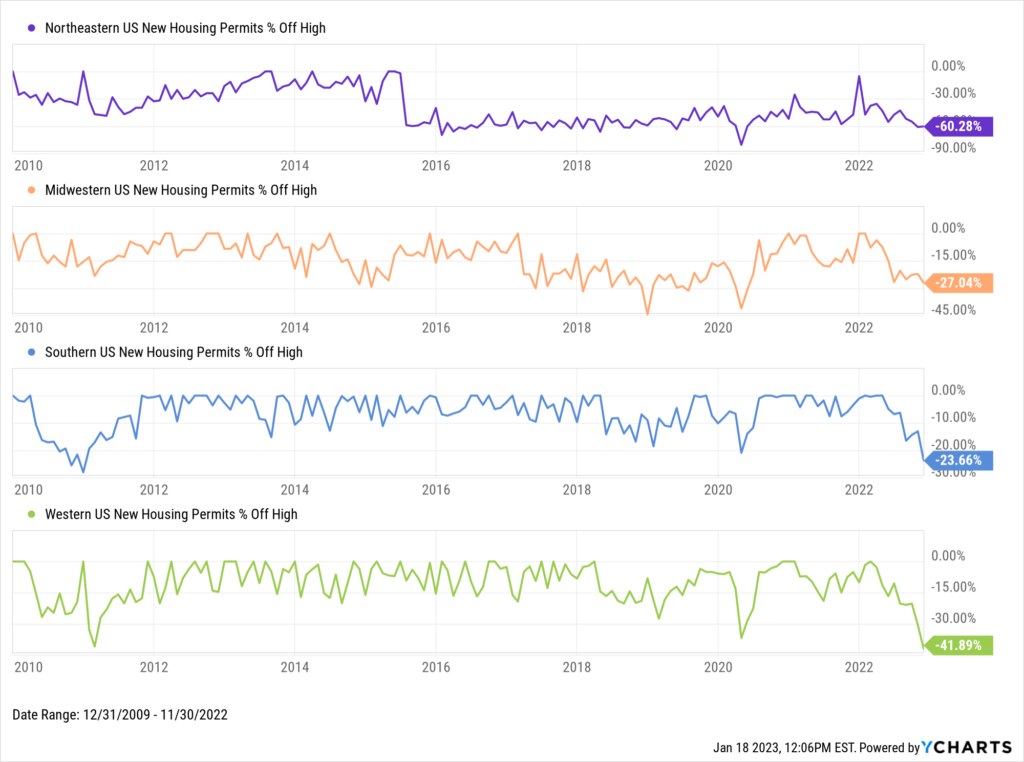
Looking at new housing permits by region, the Northeastern US has taken the biggest beating, down 58.1% from its December 2021 high. The Southern US has felt the least amount of impact, now 23.7% below its most recent high from April 2022. Nonetheless, new housing activity has significantly cooled off nationwide.
Download Visual | Modify in YCharts
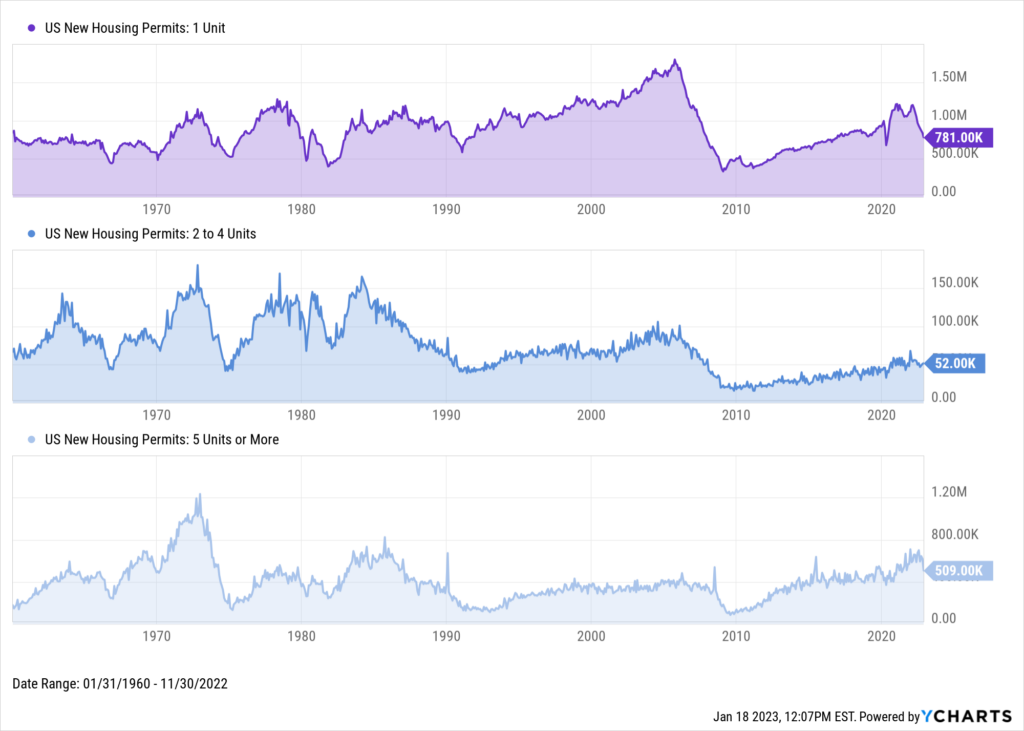
In terms of unit type, permits for new single-unit housing have been in decline since Month/Year. The number of new multifamily housing permits has been declining as well, but less so than single-unit permits. Permits for housing of 2 to 4 units and 5 units or more are off by 23.5% and 28.3% from their respective December 2021 highs, compared to 35.8% for single-unit permits.
Download Visual | Modify in YCharts
The State of Housing Prices
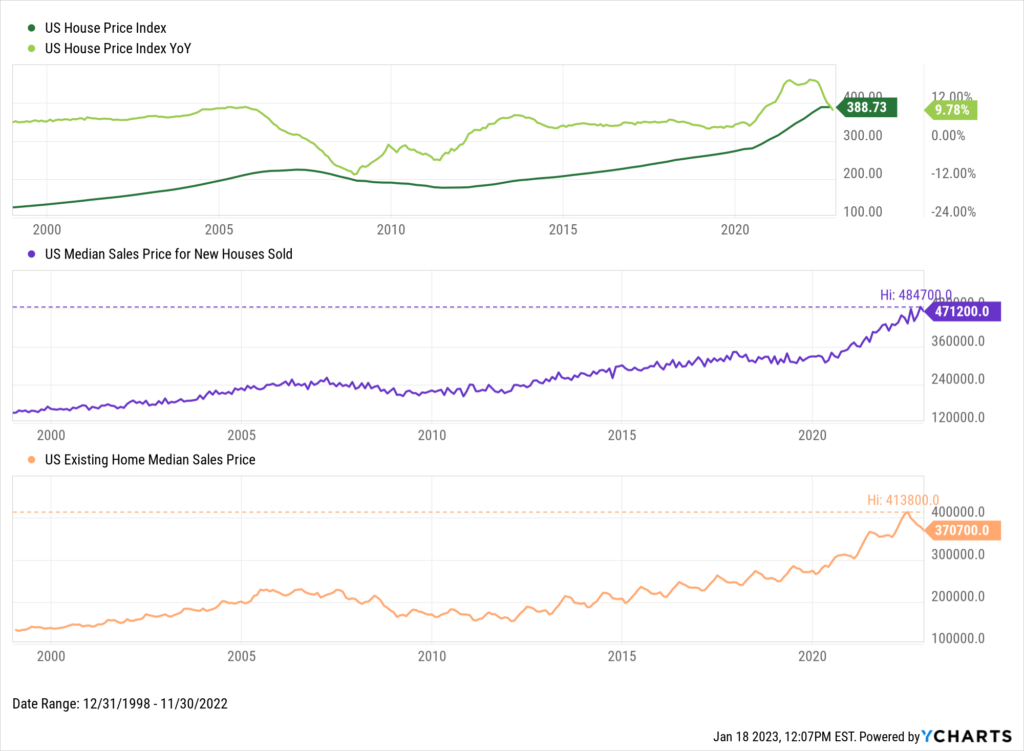
At the national level, it appears prices for new homes have continued to appreciate while those for existing homes have taken a hit. The US Existing Home Median Sales Price was $370,700 as of November 2022, down 10.4% from its all-time high of $413,800 set in June. This marks a five-month decline for existing home prices, and the largest price correction since 2008.
Meanwhile, the US Median Sales Price for New Houses Sold is slightly below its all-time high, set in October 2022. However, the overall US House Price Index came in flat between Q2 and Q3 2022, breaking seven consecutive quarters of fast-paced growth.
Download Visual | Modify in YCharts
The average homeowner in most urban areas has benefitted from home price increases over the last three years, but recent (and potentially forthcoming) declines threaten those gains. Looking at the 30 largest U.S. metropolitan areas according to the 2020 census, there certainly have been notable quarter-over-quarter declines to median home prices across the board. Which pockets of the country will be affected the most in 2023?
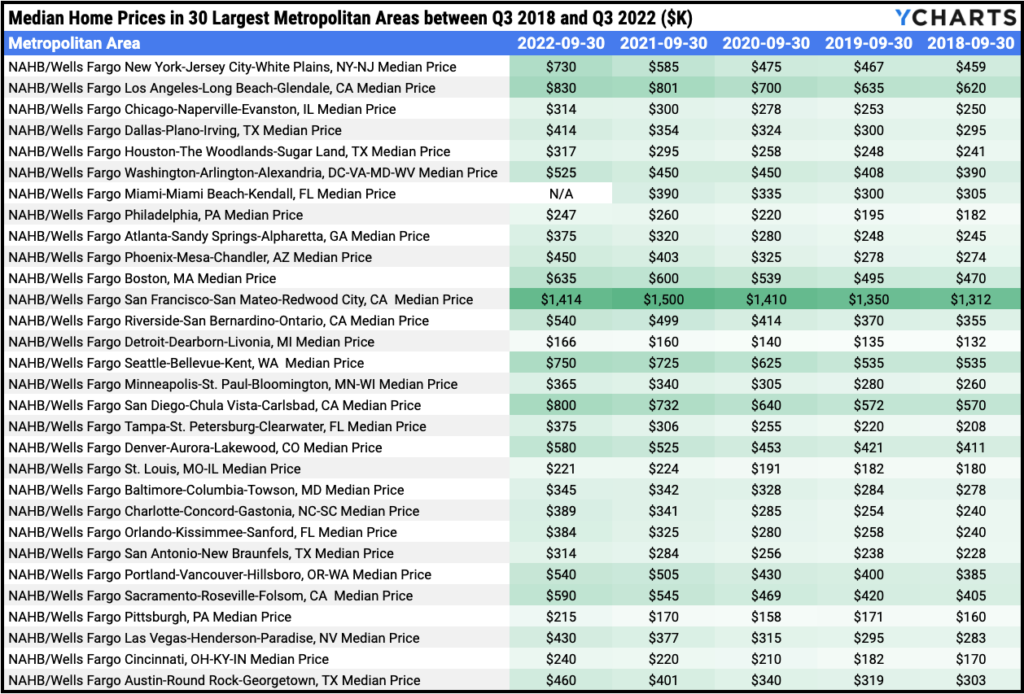
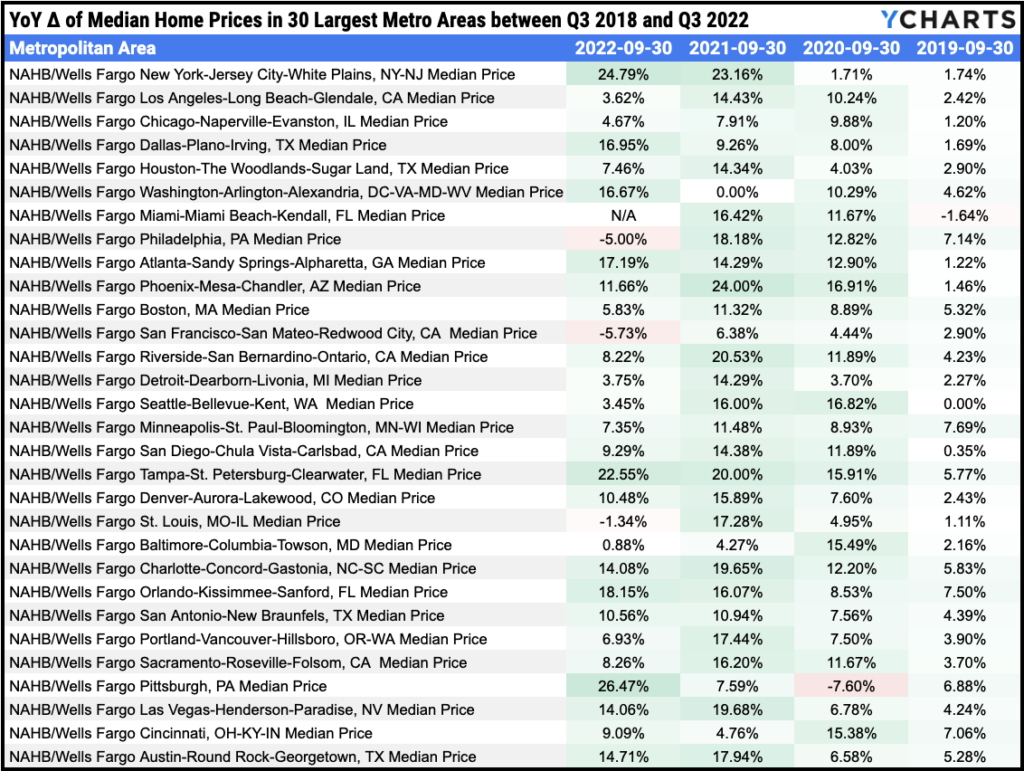
Download Visual | View and Modify Full Data in Timeseries Analysis
Will the Housing Market Crash?
This is the question on everyone’s mind. Given that there’s a plethora of different data points and angles to look at, it’s difficult to say whether or not the housing market is crashing or going to crash soon. One possibility in the quest for answers is comparing today’s trends to what occurred around the last housing crisis in 2008.
The Case-Shiller National Home Price Index rose steadily in the 1990s, accelerated in the 2000s leading up to the Great Financial Crisis, and logged a double-top in 2006-2007 before declining. The index repeated a similar pattern of steady growth between 2012-2020, accelerated growth between June 2020-June 2022, and has only declined since then. Is this just a breather on the path to new highs, or the start of a prolonged decline similar to what occurred in 2008?
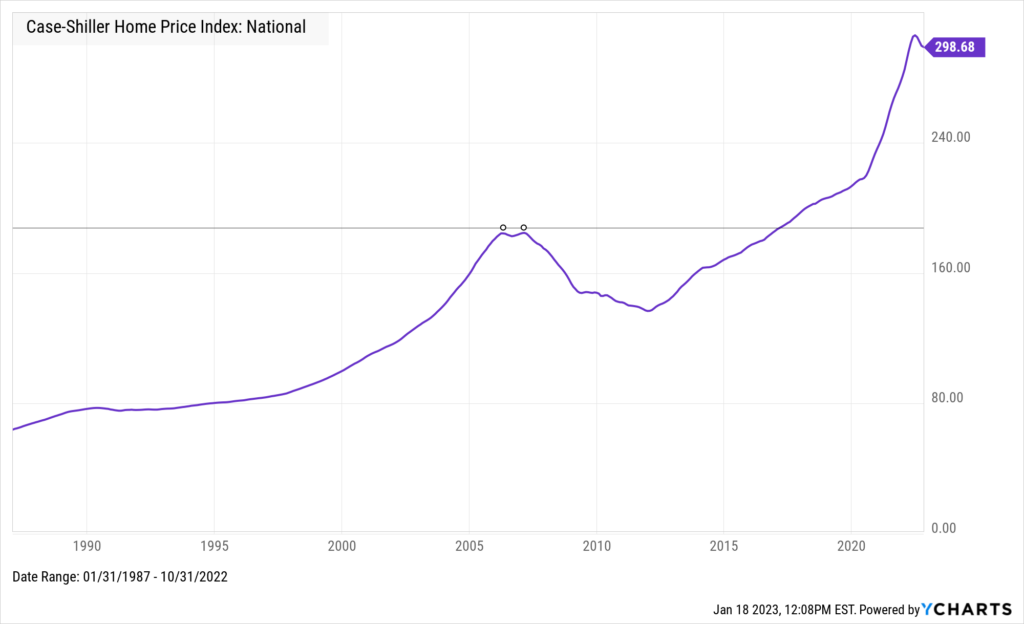
Download Visual | Modify in YCharts
The US Fixed Housing Affordability Index fell to a low in July 2006, followed by US Mortgage Debt topping out two years later. According to the National Association of Realtors, a value of 100 means that a family earning the median income has exactly enough to qualify for a mortgage on a median-priced home. The fixed housing affordability index has plummeted 49.2% from its January 2021 high down to 95.5, meaning that the median income is currently not enough for a median-priced home. When the index fell below 100 in June 1990, a recession immediately followed, and the Great Financial Crisis occurred not too long after the index grazed 100 in July 2006.
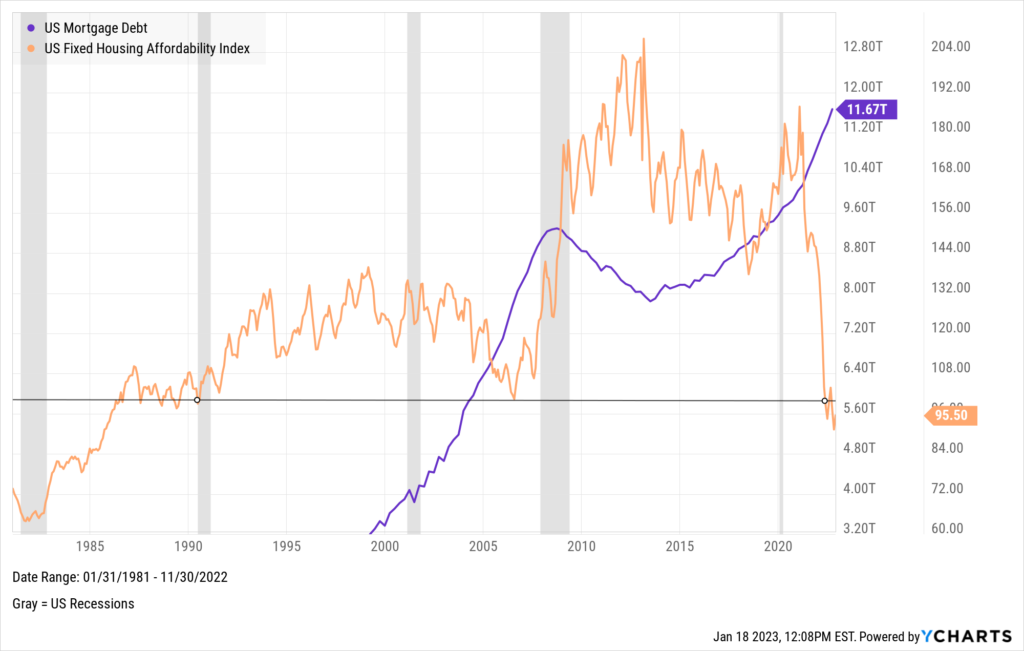
Download Visual | Modify in YCharts
On the other hand, recent gains in housing-related stocks might be signaling that the worst is over. The four largest components of the SPDR S&P Homebuilders ETF (XHB)—PulteGroup (PHM), D.R. Horton (DHI), Lennar (LEN) and Williams-Sonoma (WSM)—are all higher since November 1st, in addition to the SPDR Real Estate Select Sector ETF (XLRE) being up 7.7%. Are these moves hinting at brighter days ahead for the housing market?
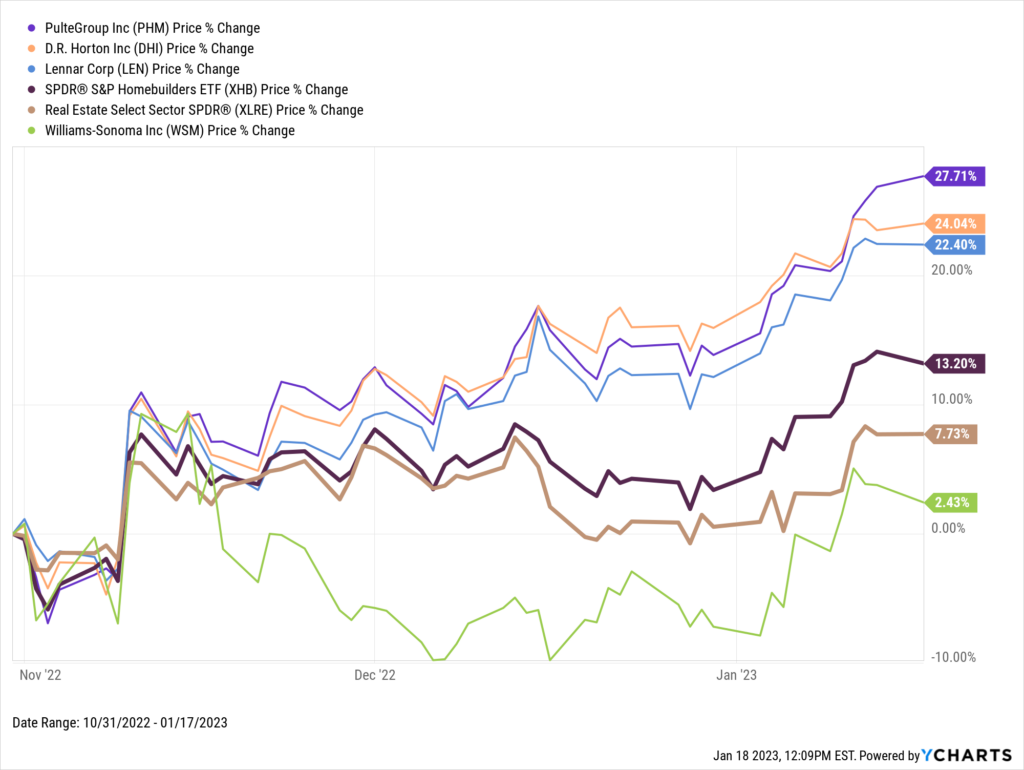
Download Visual | Modify in YCharts
It will take months to confirm whether or not the current environment constitutes a housing market “crash”—these things are only ever confirmed in hindsight. Economic data points are lagging indicators, updated only on a monthly, quarterly, or sometimes annual basis. Though homebuilder stocks were down most of 2022, this recent turnaround to the upside suggests the bad news may be over. Has the market come to terms that the days of record-low mortgage rates are in the past? Perhaps we’ll know not too far from now, when new housing data rolls in for Q4 2022.
Connect with YCharts
To get in touch, contact YCharts via email at hello@ycharts.com or by phone at (866) 965-7552
Interested in adding YCharts to your technology stack? Sign up for a 7-Day Free Trial.
Disclaimer
©2023 YCharts, Inc. All Rights Reserved. YCharts, Inc. (“YCharts”) is not registered with the U.S. Securities and Exchange Commission (or with the securities regulatory authority or body of any state or any other jurisdiction) as an investment adviser, broker-dealer or in any other capacity, and does not purport to provide investment advice or make investment recommendations. This report has been generated through application of the analytical tools and data provided through ycharts.com and is intended solely to assist you or your investment or other adviser(s) in conducting investment research. You should not construe this report as an offer to buy or sell, as a solicitation of an offer to buy or sell, or as a recommendation to buy, sell, hold or trade, any security or other financial instrument. For further information regarding your use of this report, please go to: ycharts.com/about/disclosure
Next Article
Survey Says: Just 60-70% of Advisor Conversations “Click” for ClientsRead More →