
Help Advisors Keep Their Clients’ Retirement Income Goals on Track

Interested in testing out YCharts for free?
Start 7-Day Free TrialWhen doing a hypothetical comparison on how two strategies support a client’s income goal, the visual shouldn’t look like it’s from a time when you had to choose between talking on a landline and browsing the World Wide Web.
With the latest enhancement to YCharts Scenarios, you can more easily visualize how different strategies help — or fail to help — a client avoid a shortfall in retirement.
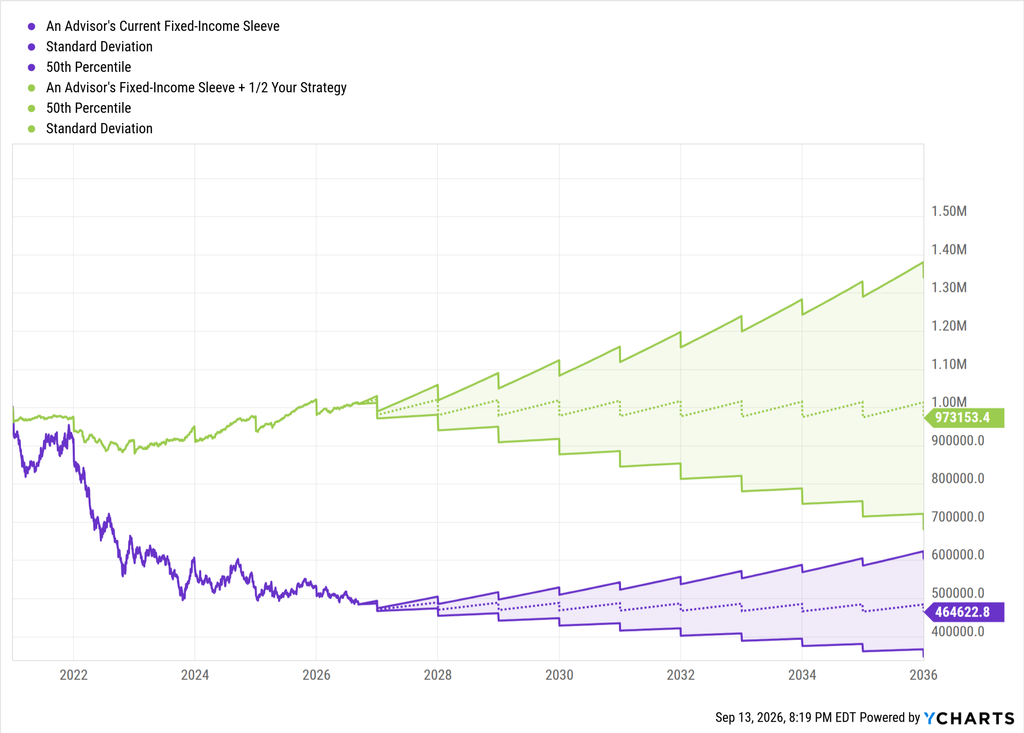
As a reminder, YCharts Scenarios allows you to build systematic withdrawal plans (SWPs), required minimum distributions (RMDs), and other hypothetical scenarios that an advisor’s client may face, so they can have the data to understand how adding or removing a strategy can support their client’s goals.
So whether a client is in the accumulation phase or approaching retirement, you can visualize how your strategy can be incorporated into the broader financial plan, not just visualize historic performance or risk.
Table of Contents
What’s New in Scenarios
YCharts Scenarios now lets you build and compare up to five strategies at once, each rendered with its own percentile path and deviation band. These visuals help answer questions like “what’s the range of outcomes? “ or “where does a shortfall start to show up.”
After building the scenario (i.e., a 4% annual withdrawal rate), you get a chart similar to the one above: multiple strategies, multiple bands, one shared timeline, and a client with a better understanding of how your strategy supports their goals.
Build a Scenario with Y
As the Scenarios you’ll build will illustrate, time is a valuable commodity.
And you can speed up how fast you can get Scenarios built using these three sample prompts with our AI agent, Y:
- “Build a systematic withdrawal plan scenario for a $1M portfolio starting in 2027, withdrawing 4% annually, comparing [Fund A] against [Fund B] over 20 years.”
- “Model an RMD-driven distribution scenario for a 73-year-old client with the attached $750K IRA, comparing outcomes with and without a 15% allocation to [Fund C].” *Make sure you attach the portfolio with this one*
- “Run a Monte Carlo simulation showing the probability of portfolio shortfall by age 90 for a retiree drawing $50K annually, comparing the attached fixed-income sleeve against that sleeve plus a 25% allocation to [Fund D].” *Make sure you attach the portfolio with this one*
Swap in your fund, attach a client’s statement or advisor’s model, and add a competitor, and Y will build the scenario and the visual.
Why This Matters Right Now for Fixed Income
Bond yields today sit well above where they spent most of the 2010s, and that shift is changing where returns actually come from.
The 10-year Treasury is now yielding 5.24%. That’s the first time in over a decade it has held above 5%. For most of the 2010s, the 10-year rarely got past 3%. A 5% handle on the benchmark Treasury changes the starting math for every income portfolio.
Ameriprise’s mid-year 2026 fixed income outlook argues that income, or carry, is likely to drive the bulk of bond returns. Price appreciation from falling rates does less of the work than it did in the 2010s.
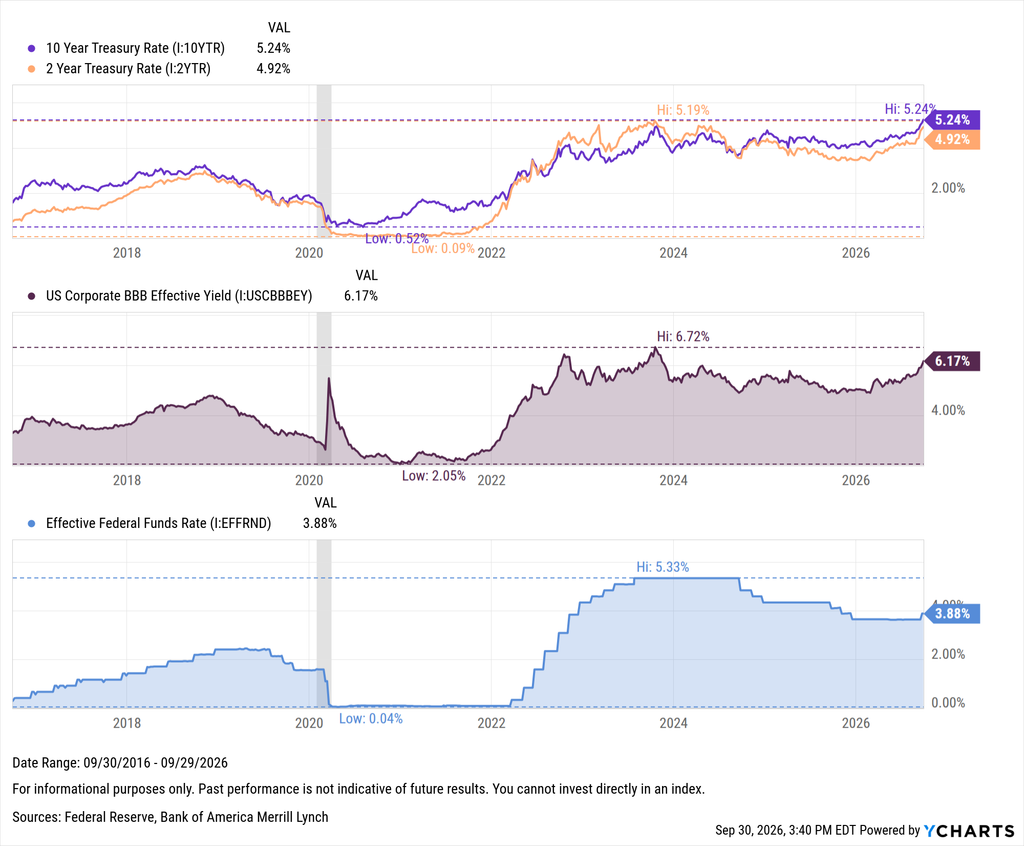
That’s a meaningful shift for how advisors build income sleeves, and it’s exactly the kind of assumption that belongs inside a scenario comparison rather than a footnote. “Yield matters more now” is a far stronger story when a client can watch it play out over 15 years than when it’s read as a stat. With the 10-year above 5%, the starting yield is doing much of the heavy lifting.
Asset managers are already accustomed to using YCharts to show advisors how their offerings optimize an income sleeve, whether through performance, yield, or dampened volatility. That conversation isn’t going away. But now there’s a further layer available: showing what that optimization means well into retirement.
Instead of stopping at “our fund yields more” or “our fund has lower volatility,” you can show a client’s retirement goal three ways in a single view: without your offering, with a competitor’s, and with yours optimized in.
Get Started
With the latest enhancement to Scenarios, you can pick a fund you’re already positioning to an advisor, build the comparison, and let the client see whether your strategy changes their outcome.
Ready to Move On From Your Investment Research and Analytics Platform?
Follow YCharts Social Media to Unlock More Content!
Next Article
How MCPs Became Core Advisor Tech InfrastructureRead More →