How Markets Absorb Geopolitical Uncertainty Over Time
Executive Summary: Geopolitical conflict has again pushed markets into focus, but history shows that early reactions across oil, international equities, and select sectors often evolve differently over time. This blog examines how markets have responded during past conflicts and why long-term discipline has consistently mattered more than the first wave of headlines.
Interested in testing out YCharts for free?
Start 7-Day Free TrialPeriods of geopolitical uncertainty bring financial markets into the spotlight as investors scramble to determine the impacts on their portfolios. The role of financial advisors is amplified as headlines pile up and fear begins to influence how clients interpret short-term market moves.
Looking at the effects of major conflicts over the past several decades helps contextualize moments like today. History shows that while market reactions have not been uniform, short-term volatility has often given way to more constructive long-term outcomes.
Table of Contents
What Past Conflicts Reveal
The length, severity, and market reaction tied to international conflicts can vary. While these periods feel heavily influential as they happen, markets have historically absorbed them alongside broader economic forces.
They can stretch across multiple administrations, shifting rate environments, and entirely separate economic factors, which makes zooming out especially useful for advisors and clients alike.
| Conflict | Duration (Days) | Return During Conflict | 1-Month Forward Return | 1-Year Forward Return | 3-Year Forward Return |
|---|---|---|---|---|---|
| Cuban Missile Crisis Oct. 16, 1962 to Oct. 28, 1962 | 13 | -4.45% | 5.40% | 27.84% | 60.09% |
| Iraq Invades Kuwait & Gulf War Aug. 2, 1990 to Feb. 28, 1991 | 210 | 4.44% | -8.23% | 10.16% | 28.07% |
| Iraq War Mar. 20, 2003 to Dec. 15, 2011 | 3,192 | 38.84% | 2.05% | 26.73% | 49.04% |
| Annexation of Crimea Feb. 20, 2014 to Mar. 18, 2014 | 26 | 1.76% | 1.75% | 14.70% | 27.80% |
| Russian Invasion of Ukraine Feb. 24, 2022 to Present | 1,470 | 59.40% | 5.40% | -7.43% | 39.51% |
| Average | – | – | 1.27% | 14.40% | 40.90% |
In the immediate 12 months after these events unfolded, the S&P 500 returned an average of 14.4%, outperforming its long-term average of 10.75%. Three years removed, and the market would have returned a minimum of 27%.
Applied to today’s S&P 500 level of 6,184, the average 3-year return of 40.9% would imply an index level above 8,700 by March 2029. That is not a forecast; rather, it helps frame today’s uncertainty against the longer-term perspective history has often provided.
Oil Responds First
Oil consistently experiences the sharpest responses when conflict breaks out in major energy-producing regions, as markets quickly price the risk of disrupted supply and transportation.
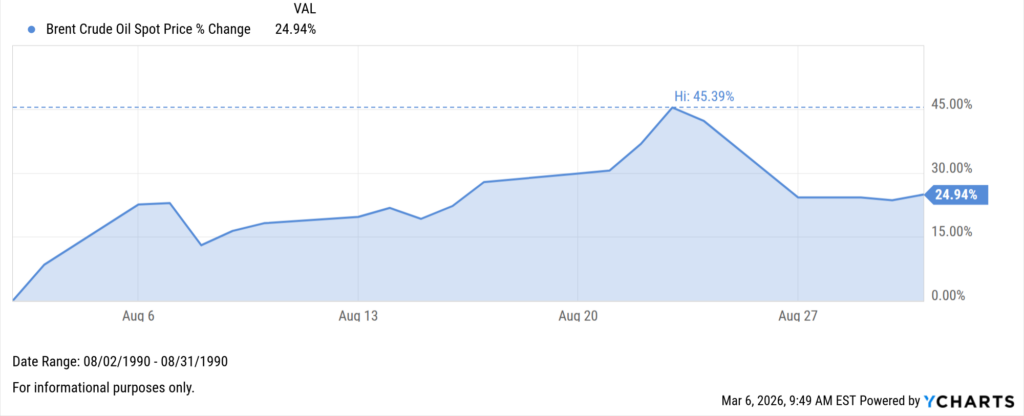
During the opening month of the Gulf War, Brent Crude rose as high as 45%, climbing to $32.25 per barrel as markets reacted to regional supply uncertainty.
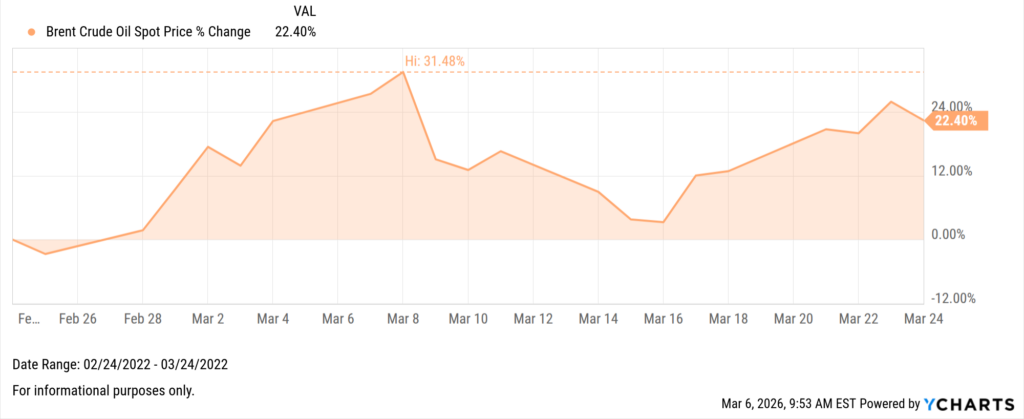
Following the Russian invasion of Ukraine, Brent again surged, rising above $133 per barrel and finishing the first month more than 22% higher.
To no surprise, the same pattern has emerged in the first week following strikes on Iran. In the past five trading days, Brent Crude is up 25.6% and has crossed $90 per barrel for the first time since October of 2023.
Where International Pressure Builds
This pressure often reaches equities more quickly outside the United States, where higher energy costs carry broader economic implications.
The MSCI European Index fell 6.45% this past week, its biggest weekly decline since April 4, 2025, and its fifth worst week since the March 2020 pandemic drop of -20.28%. This sensitivity reflects Europe’s greater reliance on imported energy, where higher oil prices can feed more directly into production costs, transportation, and growth expectations.
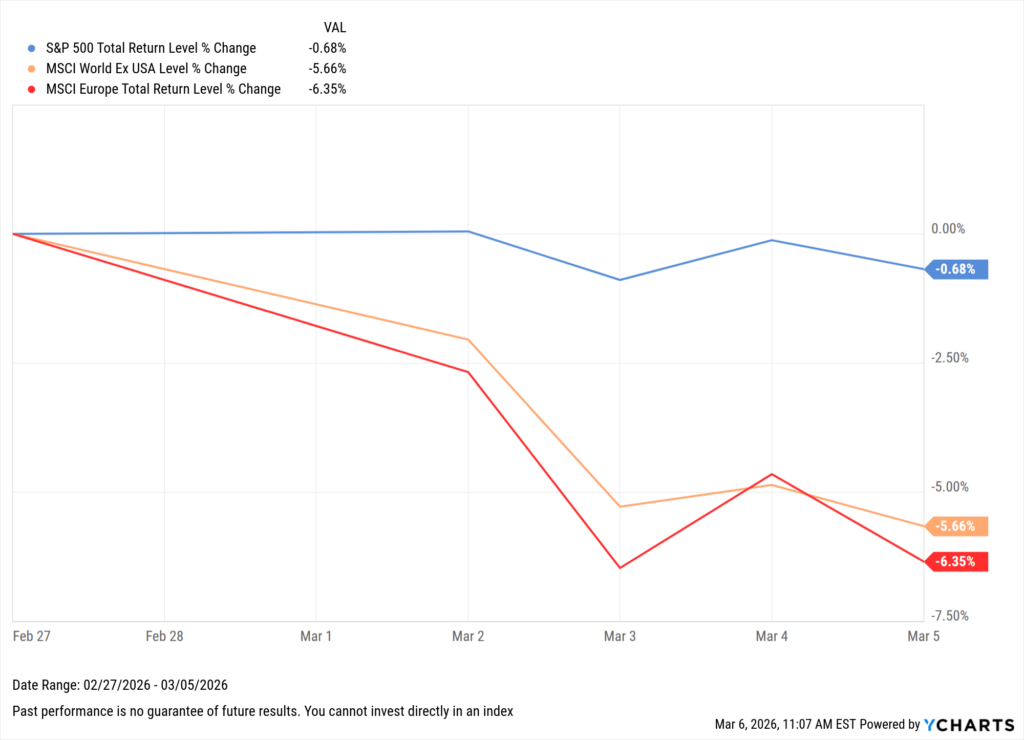
The US, by contrast, benefits from larger domestic energy production and an economy that can gradually absorb these pressures. The S&P 500 has remained more stable, down less than 1%, though underlying sector moves have been far more pronounced.
Dispersion Beneath the Index
Within U.S. equities, divergence is often one of the clearest reminders that periods of geopolitical uncertainty do not affect markets evenly.
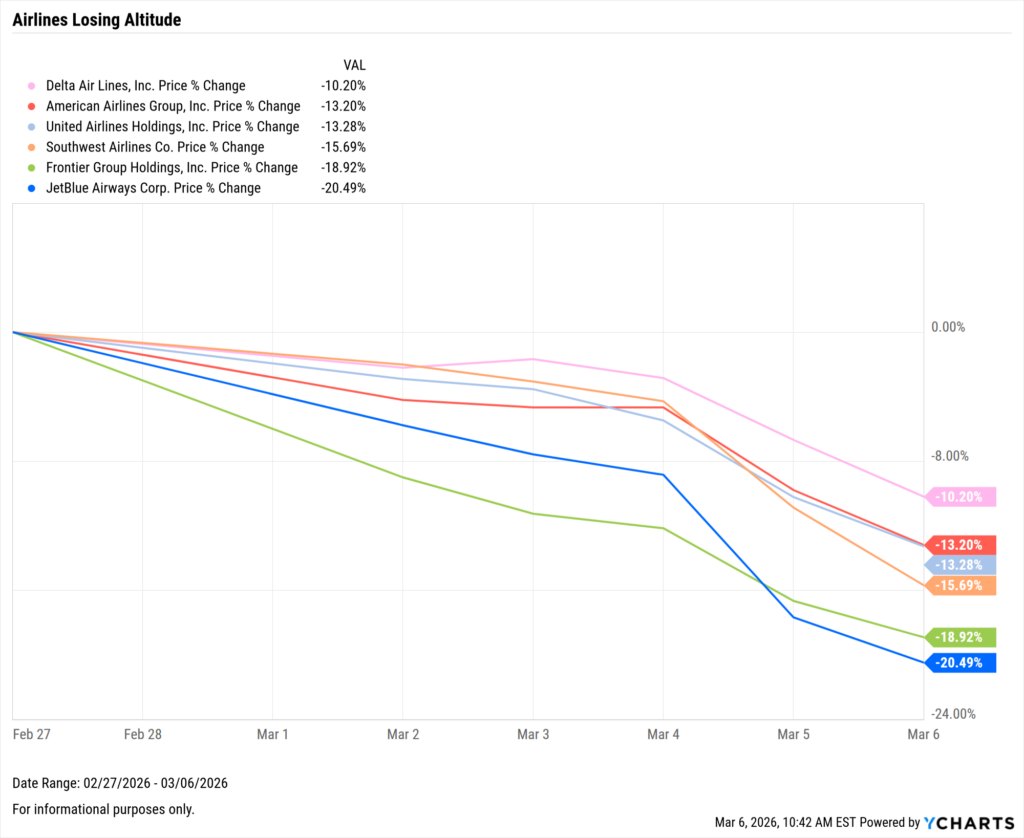
Industries tied more directly to fuel costs, supply chains, or government spending expectations tend to react first as pressure or opportunity emerges. Major airline stocks have come under pressure as higher fuel costs begin to weigh on operating expectations.
At the same time, select defense and government-linked names have moved higher, with Lockheed Martin and Northrop Grumman both up 2%, while Palantir is up over 14%.
For advisors, these early sector moves create the clearest opportunity to separate what reacts immediately from what has historically mattered more over time for clients.
Helping Clients Remain Grounded
While uncertainty around the length and severity of the current conflict remains, history continues to favor investors who stayed disciplined through periods of geopolitical stress.
Oil prices, international equities, and sector-level moves all deserve attention as they influence broader economic sentiment, but markets have repeatedly moved beyond this initial shock period.
This can feel uniquely consequential in real time for clients, and advisors play a key role in helping them understand that remaining invested through uncertainty has mattered more than reacting to it.
Ready to Move On From Your Investment Research and Analytics Platform?
Follow YCharts Social Media to Unlock More Content!
*Legacy Provider’s name withheld due to respect of our competitors
Next Article
The Best Performing Bond Mutual Funds over the Last 10 YearsRead More →