Monthly Canada Market Wrap: August 2022
Welcome back to the Canadian Monthly Market Wrap from YCharts! Here, we break down the most important market trends for Canada-based advisors and their clients every month. As always, feel free to download and share any visuals with clients and colleagues, or on social media.
Looking for the US Market Wrap? Click here.
Canada Market Summary for August 2022
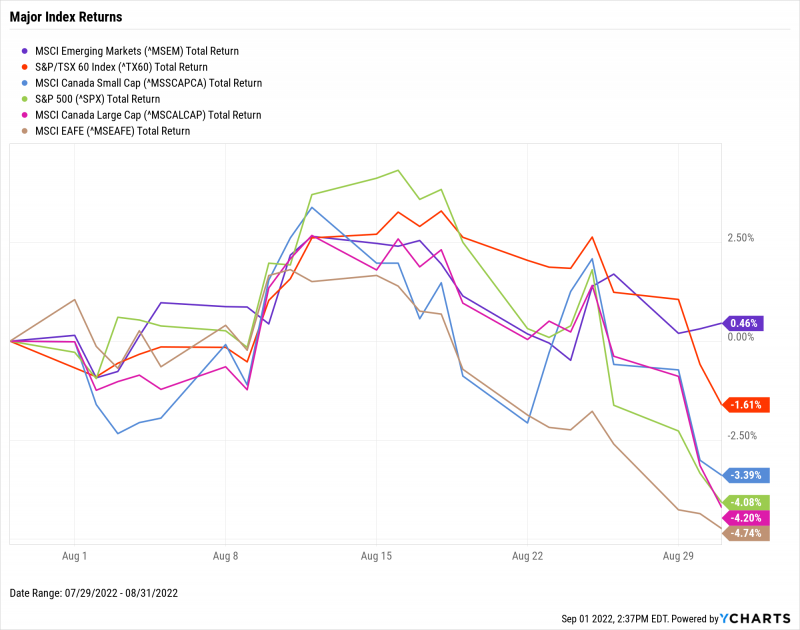
Canadian equities gave up most of their July gains amid expectations that the Bank of Canada will impose further rate hikes in September. The benchmark Canada Bank Rate may enter “restrictive territory” for the first time in two decades depending on the magnitude of the increase. The S&P/TSX 60 ended August 1.6% lower, Canadian Small Caps fell 3.4%, and Canadian Large Caps were down 4.2%. The US-domiciled S&P 500 declined 4.1%, and global developed markets as measured by the MSCI EAFE index gave up 4.7%.
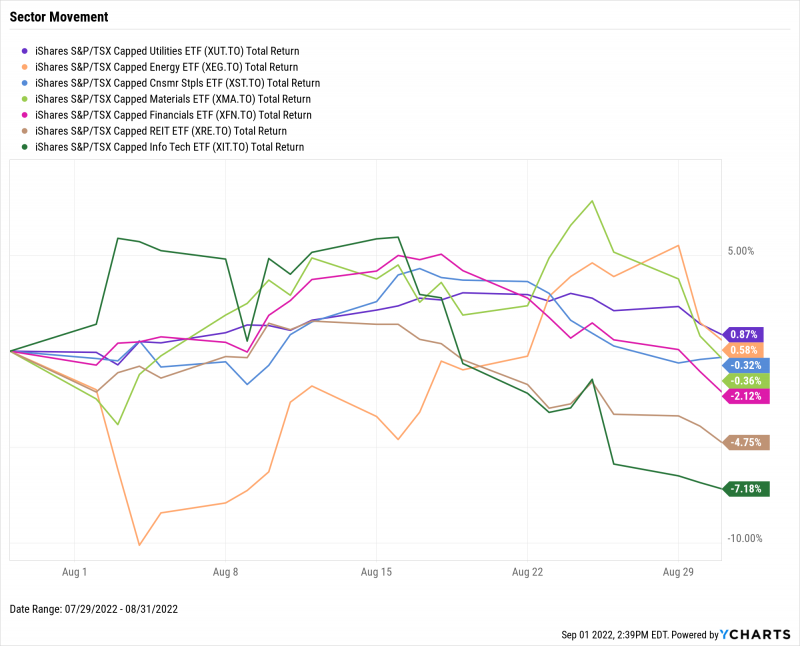
Utilities and Energy each rose by less than one percent in August. The other five TSX sectors were all negative on the month, with heavily-cyclical Info Tech down the most. A cooling housing market sent the REIT sector 4.8% lower as well.
Inflation fell for the first time in 13 months. After eclipsing 8% for the first time in nearly 30 years, inflation reversed course to settle at 7.59% in July. The Canadian unemployment rate stayed at its all-time low of 4.9% in another win for the economy. However, the Canada Ivey PMI dropped over 12 points in July to log the manufacturing sector’s first contractionary reading since December 2021.
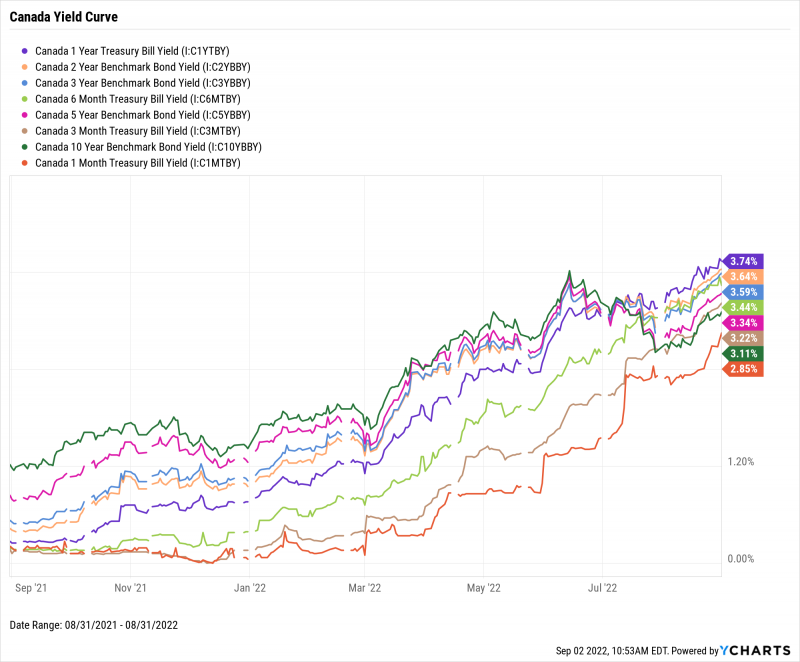
Treasury yields surged in August, with the 1-Year Treasury Bill reaching a high of 3.74%. The 10-Year Benchmark Bond’s yield was only higher than the 1-Month Treasury Bill, signaling a continued inversion across the Canadian yield curve. Yields on the 3-Month and 6-Month Treasury Bills were above 3% for the first time since June 2008.
Jump to Fixed Income Performance
Equity Performance
Major Indexes
Download Visual | Modify in YCharts | View Below Table in YCharts
Canadian Sector Movement
Download Visual | Modify in YCharts | View Below Table in YCharts
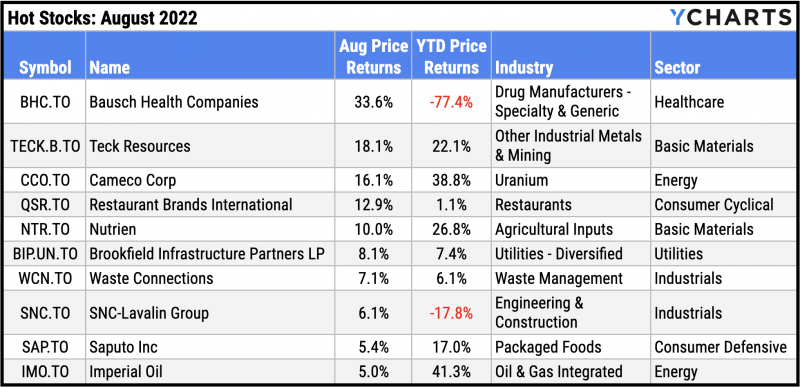
Hot Stocks: Top 10 TSX 60 Performers of August 2022
Bausch Health Companies (BHC.TO): 33.6% gain in August
Teck Resources (TECK.B.TO): 18.1%
Cameco Corp (CCO.TO): 16.1%
Restaurant Brands International (QSR.TO): 12.9%
Nutrien (NTR.TO): 10.0%
Brookfield Infrastructure Partners LP (BIP.UN.TO): 8.1%
Waste Connections (WCN.TO): 7.1%
SNC-Lavalin Group (SNC.TO): 6.1%
Saputo Inc (SAP.TO): 5.4%
Imperial Oil (IMO.TO): 5.0%
Download Visual | Modify in YCharts
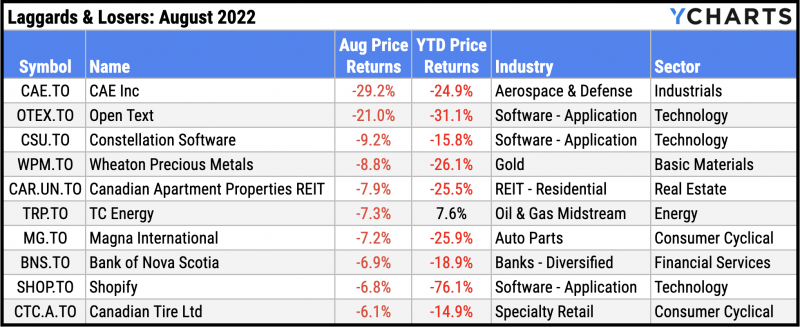
Laggards & Losers: 10 Worst TSX 60 Performers of August 2022
CAE Inc (CAE.TO): -29.2% decline in August
Open Text (OTEX.TO): -21.0%
Constellation Software (CSU.TO): -9.2%
Wheaton Precious Metals (WPM.TO): -8.8%
Canadian Apartment Properties REIT (CAR.UN.TO): -7.9%
TC Energy (TRP.TO): -7.3%
Magna International (MG.TO): -7.2%
Bank of Nova Scotia (BNS.TO): -6.9%
Shopify (SHOP.TO): -6.8%
Canadian Tire Ltd (CTC.A.TO): -6.1%
Download Visual | Modify in YCharts
Economic Data
Employment
The Canadian unemployment rate remained at its all-time low of 4.9% in July. However, the Canada Ivey Employment index, which measures the month-to-month variation in economic activity (according to a panel of purchasing managers), fell 9.6% after setting an all-time high last month. The country also recorded a loss of 17,000 part-time workers in July.
Production and Sales
The Canada Ivey PMI plummeted by 12.6 points in July and landed in contraction territory. After falling nearly 10 points in June, the PMI’s July reading of 49.6 marks the manufacturing sector’s first contractionary reading since December of 2021. Despite the poor manufacturing data, Canada Retail Sales rose 1.1% in June, and Canada Real GDP inched 0.2% higher.
Housing
Price growth for Canadian homes slowed to just 0.08% in July, marking the 31st consecutive month in which the Canada New Housing Price Index has risen, but at the smallest pace since April 2020.
Consumers and Inflation
After topping 8% for the first time since January 1983, the Canadian Inflation Rate declined by 54 basis points to 7.59%. July’s print is also notable as it snaps a streak of twelve consecutive monthly increases to the inflation rate. Canada’s Consumer Price Index rose in July, but by a relatively lesser 0.26%.
Gold
The price of gold rose slightly in Canadian Dollars to C$2,274.60 per ounce as of August 26th. However, the iShares S&P/TSX Global Gold ETF (XGD.TO) still fell by 5.7% in August as several of the fund’s constituents reported higher costs leading to disappointing Q2 earnings. XGD.TO is down 23% year to date.
Oil
Prices for crude oil slumped in August. The per-barrel spot price for WTI at the end of August was $97.40 USD (-3.9% MoM) and $101.13 USD for Brent (-9.0% MoM). Monthly Retail Sales among Canadian Gasoline Stations reached an all-time high of C$8.12 billion according to the latest data from June, up 53.6% year-over-year.
Cryptocurrencies
Winter came for Bitcoin and Ethereum holders as prices sank in August. The price of Bitcoin breached $20,000 USD and tumbled 16.9% in August to $19,805 USD as of month’s end. Ethereum ended August down 11.5% to settle at $1,525.40 USD. Binance Coin actually rose 1.8% in value to $281.29 USD as of August 31st, though year-to-date performance remains firmly in the red. Binance Coin is 45.7% lower YTD, Bitcoin is down 58.0%, and Ethereum is off 58.9%.
Featured Market & Advisor News
Young retail traders see ‘even worse’ times ahead for markets (BNN)
Do Inverted Yield Spreads Really Predict Market Declines? (YCharts)
Mutual fund, ETF assets steady in July (Advisor’s Edge)
New on YCharts: ESG Visuals for Stocks, ETFs, and Mutual Funds (YCharts)
Canadian job vacancies climb to new record, signaling more inflation pressure (Financial Post)
7 Best Asset Classes to Hedge Against Inflation (YCharts)
Fixed Income Performance
Canadian Treasury Yield Curve
Canada 1 Month Treasury Bill Yield: 2.85%
Canada 3 Month Treasury Bill Yield: 3.22%
Canada 6 Month Treasury Bill Yield: 3.44%
Canada 1 Year Treasury Bill Yield: 3.74%
Canada 2 Year Benchmark Bond Yield: 3.64%
Canada 3 Year Benchmark Bond Yield: 3.59%
Canada 5 Year Benchmark Bond Yield: 3.34%
Canada 10 Year Benchmark Bond Yield: 3.11%
Download Visual | Modify in YCharts
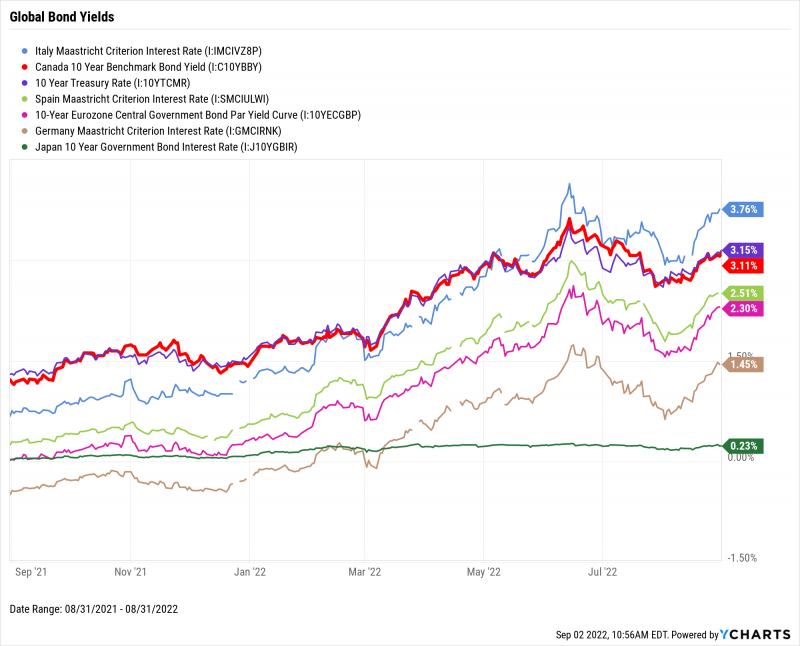
Global Bonds
Italy Long Term Bond Interest Rate: 3.76%
Canada 10 Year Benchmark Bond Yield: 3.11%
10 Year Treasury Rate: 3.15%
Spain Long Term Bond Interest Rate: 2.51%
10-Year Eurozone Central Government Bond Par Yield: 2.30%
Germany Long Term Bond Interest Rate: 1.45%
Japan 10 Year Government Bond Interest Rate: 0.23%
Download Visual | Modify in YCharts
Have a great September! 📈
Next Article
Ad-Tech Sector Check In...Is Recovery Underway?Read More →