Monthly Market Wrap: February 2026

Welcome back to YCharts’ Monthly Market Wrap, your data-driven recap of market trends shaping portfolios and client conversations. In February, international markets continued to outperform the US, while the S&P 500 finished the month negative. Software stocks declined sharply as investors reassessed AI-related valuation risk, while utilities led all sectors up 10%. Precious metals extended their rally, while cryptocurrencies declined for a fifth consecutive month.
Want to use these visuals in your own presentations? Download our free Monthly Market Wrap slide deck, containing all charts featured in the Market Wrap and more in a shareable, presentation-ready format.
Market Summary: Software and Growth Stocks Tumble, Internationals Continue to Push Higher
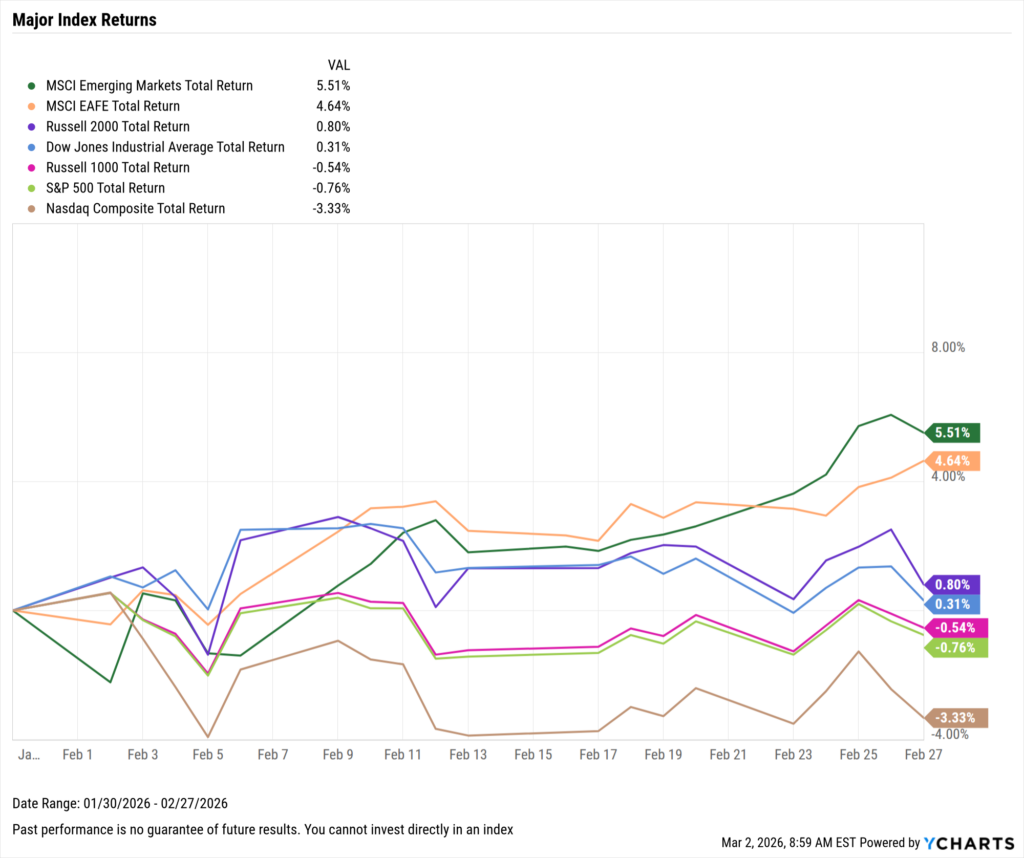
Markets posted a mixed February, as international equities finished in first once again. Emerging markets led the way, up 5.5% for the month, as the S&P 500 fell 0.8%. The Nasdaq posted the worst month of all indices for the second consecutive month, falling 3.3%.
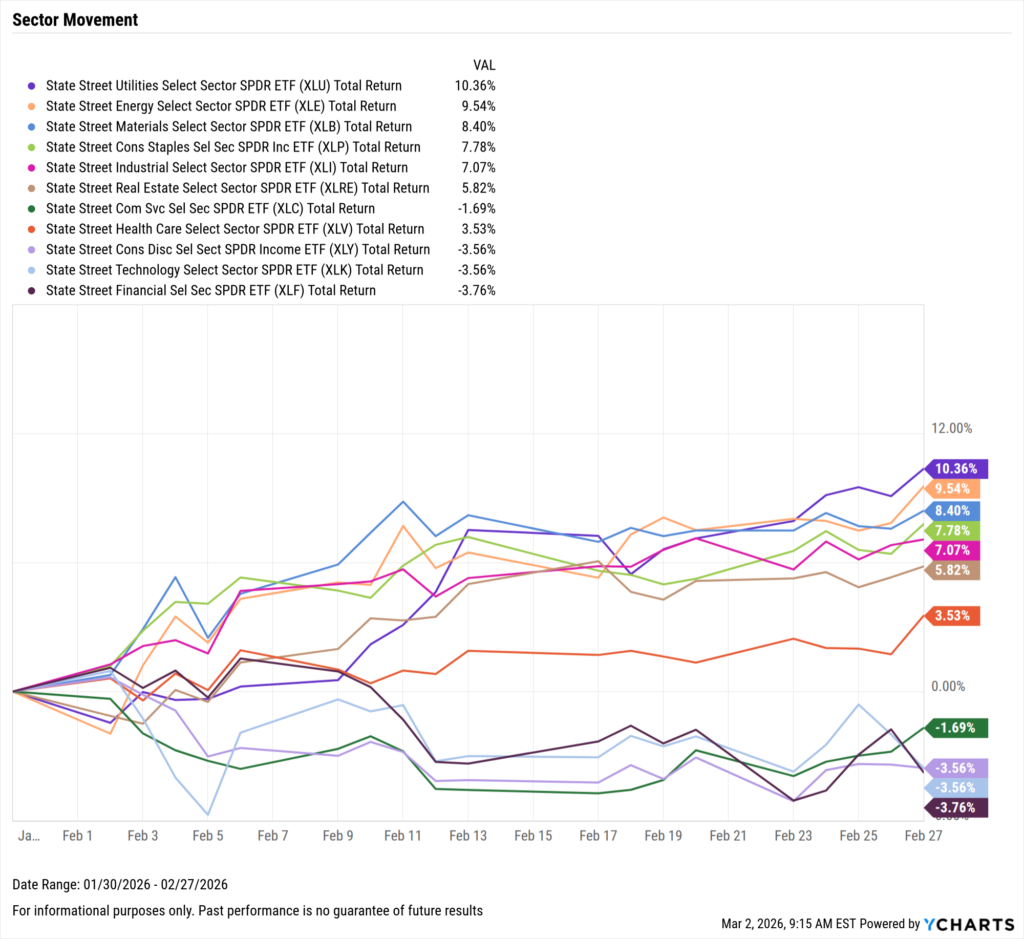
Sector performance diverged, with Utilities soaring 10.4% and Energy advancing 9.5%. Four sectors finished negative, with Financials lagging hardest for the second straight month, down 3.8%.
The Federal Reserve’s next meeting is scheduled for March 18, though expectations for any rate cut remain muted at 2%. Nonfarm payrolls greatly exceeded expectations by 75,000 jobs in January, as the unemployment rate fell by 0.1 percentage points to 4.3%.
Housing prices continued to fall, but existing home sales activity experienced its sharpest decline since the COVID-19 lockdown, down 8.43% MoM. Inflation continues moving closer to the 2% target, down to 2.40% in January.
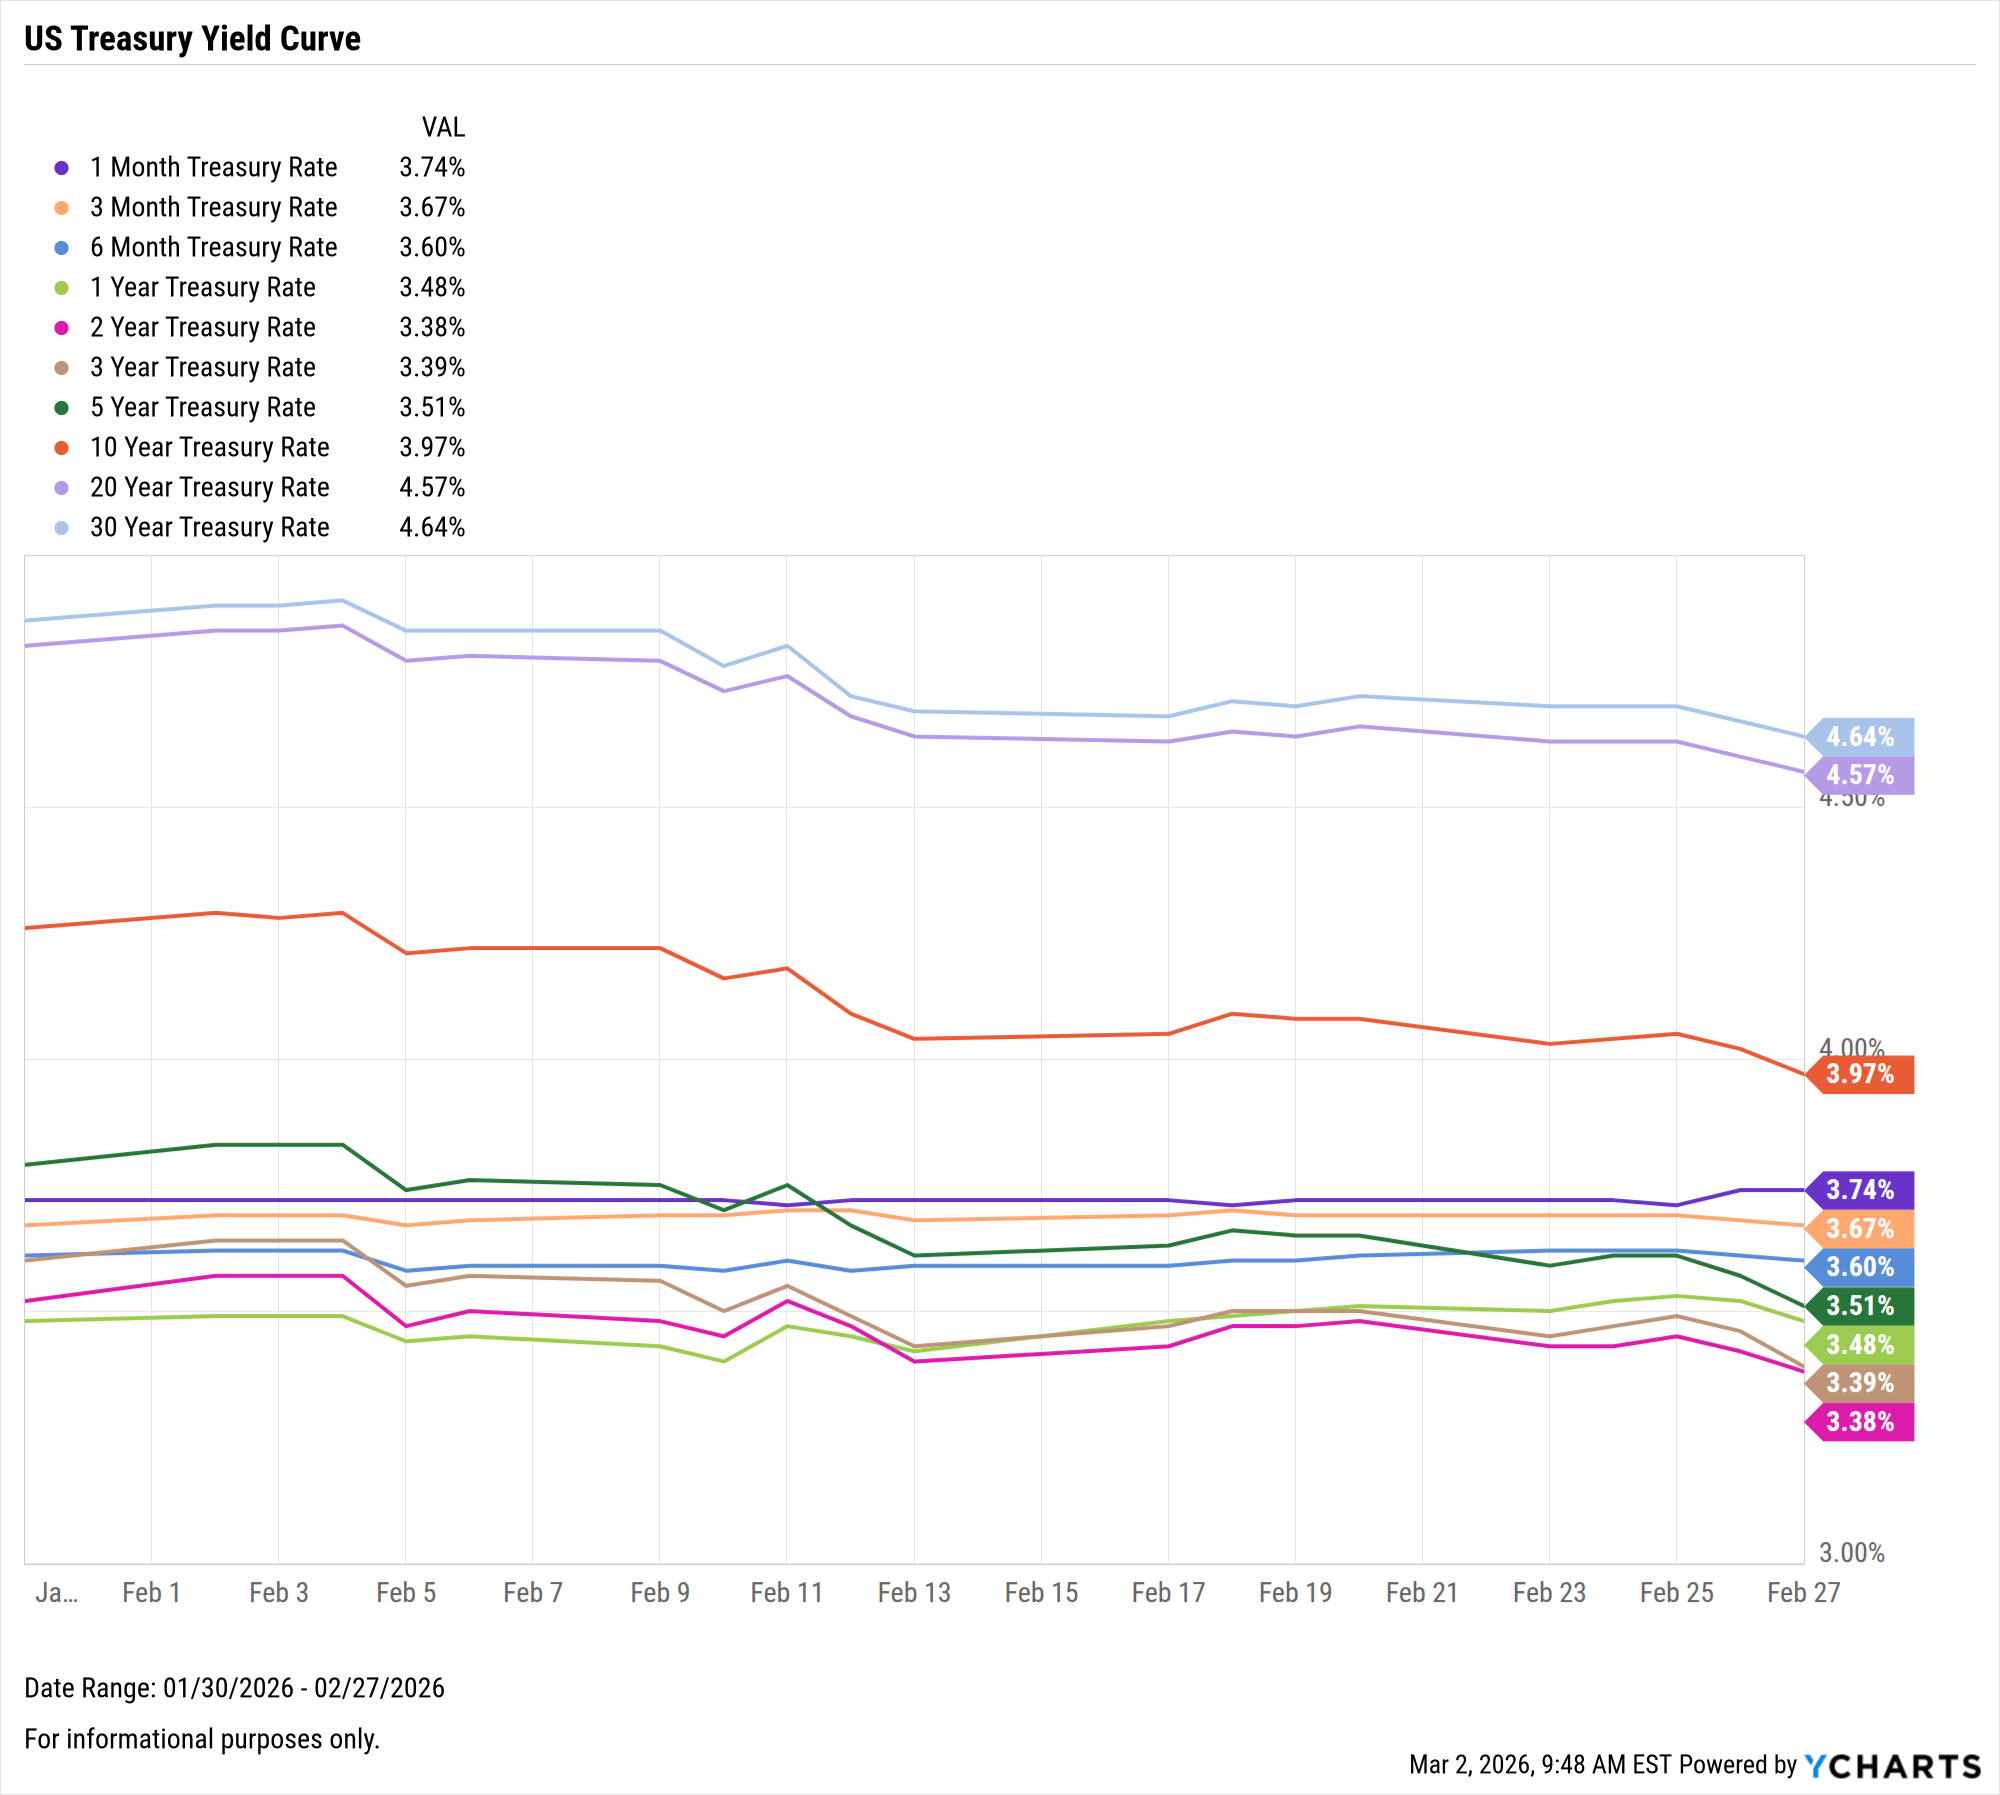
Treasury yields fell sharply in February, with the 1-month the only one to increase, up just 2 basis points to 3.74%. The 10-year saw the sharpest decline, down 29 bps to 3.97%, while the 3-, 5-, 20-, and 30-year all dropped by more than 20 bps.
Jump to Fixed Income Performance
Want to create your own monthly recap, complete with these charts in a presentation deck that contains your firm’s branding? Start a Free Trial →
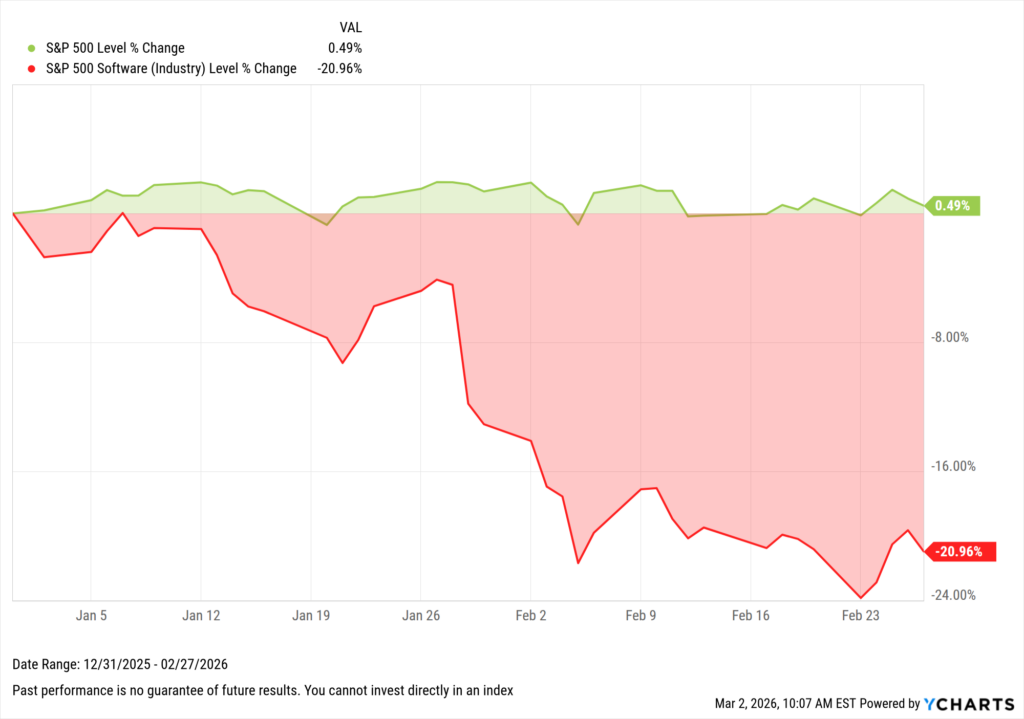
Off the YCharts! Software Industry Suffers
February revealed a growing divergence beneath the surface of the market. While the S&P 500 remained relatively steady, software stocks sold off sharply, highlighting renewed pressure across the SaaS landscape.
Download Visual | Modify in YCharts
AI’s expanding influence has increased investor scrutiny around software companies’ long-term defensibility. Investors are increasingly evaluating which platforms can integrate AI effectively and which may face margin compression or displacement risk.
This was not a collapse in fundamentals, but a reset in expectations. Revenues and earnings generally held up across the industry. However, valuations had been priced for near-perfect execution, and even modest guidance adjustments accelerated this repricing.
For advisors, the divergence helps illustrate how quickly leadership can shift when sentiment turns. February reinforced an important reminder that index stability can mask meaningful internal rotation, and thoughtful positioning will continue to matter in 2026.
Equity Performance: International Markets Continue to Lead, Utilities Surge as Growth and Technology Fall
Major Indices
Download Visual | Modify in YCharts | View Below Table in YCharts
| Index | 1 Month Total Returns | 3 Month Total Returns | 6 Month Total Returns | 1 Year Total Returns |
|---|---|---|---|---|
| MSCI Emerging Markets | 5.5% | 18.3% | 29.0% | 50.8% |
| MSCI EAFE | 4.6% | 13.4% | 17.8% | 35.3% |
| Russell 2000 | 0.8% | 5.6% | 11.9% | 23.3% |
| Dow Jones Industrial Average | 0.3% | 3.1% | 8.4% | 13.6% |
| Russell 1000 | -0.5% | 0.8% | 6.8% | 16.7% |
| S&P 500 | -0.8% | 0.7% | 7.1% | 17.0% |
| Nasdaq Composite | -3.3% | -2.9% | 6.0% | 21.0% |
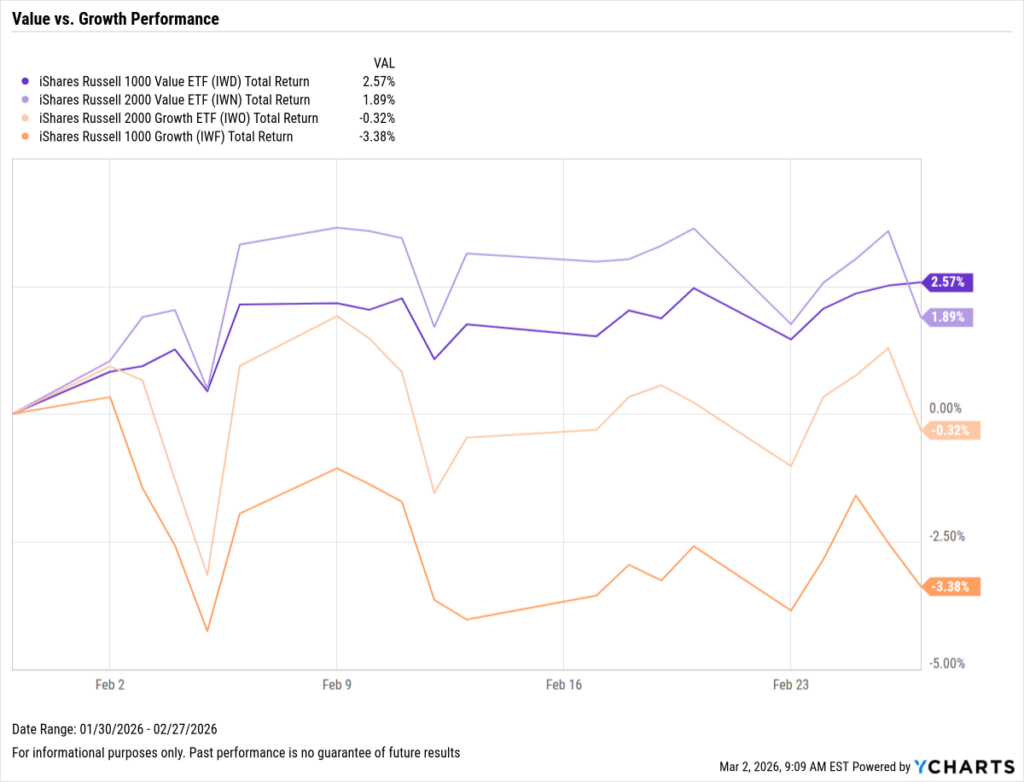
Value vs. Growth Performance
Download Visual | Modify in YCharts | View Below Table in YCharts
| Ticker | Name | 1 Month Total Returns | 3 Month Total Returns | 6 Month Total Returns | 1 Year Total Returns |
|---|---|---|---|---|---|
| IWD | iShares Russell 1000 Value ETF | 2.6% | 7.9% | 12.9% | 18.1% |
| IWN | iShares Russell 2000 Value ETF | 1.9% | 9.0% | 14.7% | 24.9% |
| IWO | iShares Russell 2000 Growth ETF | -0.3% | 2.4% | 9.3% | 21.8% |
| IWF | iShares Russell 1000 Growth | -3.4% | -5.4% | 1.2% | 14.5% |
US Sector Movement
Download Visual | Modify in YCharts | View Below Table in YCharts
| Ticker | Sector | 1 Month Total Returns | 3 Month Total Returns | 6 Month Total Returns | 1 Year Total Returns |
|---|---|---|---|---|---|
| XLU | Utilities | 10.4% | 6.1% | 14.8% | 23.9% |
| XLE | Energy | 9.5% | 24.7% | 25.8% | 27.0% |
| XLB | Materials | 8.4% | 20.1% | 16.9% | 22.7% |
| XLP | Cons Staples | 7.8% | 14.3% | 13.1% | 11.3% |
| XLI | Industrial | 7.1% | 15.6% | 17.4% | 31.7% |
| XLRE | Real Estate | 5.8% | 6.3% | 5.5% | 5.1% |
| XLV | Health Care | 3.5% | 2.0% | 17.6% | 9.5% |
| XLC | Com Svc | -1.7% | 2.6% | 6.7% | 17.1% |
| XLY | Cons Disc | -3.6% | -1.0% | 1.2% | 9.1% |
| XLK | Technology | -3.6% | -2.9% | 6.0% | 23.8% |
| XLF | Financial | -3.8% | -3.2% | -4.1% | -0.1% |
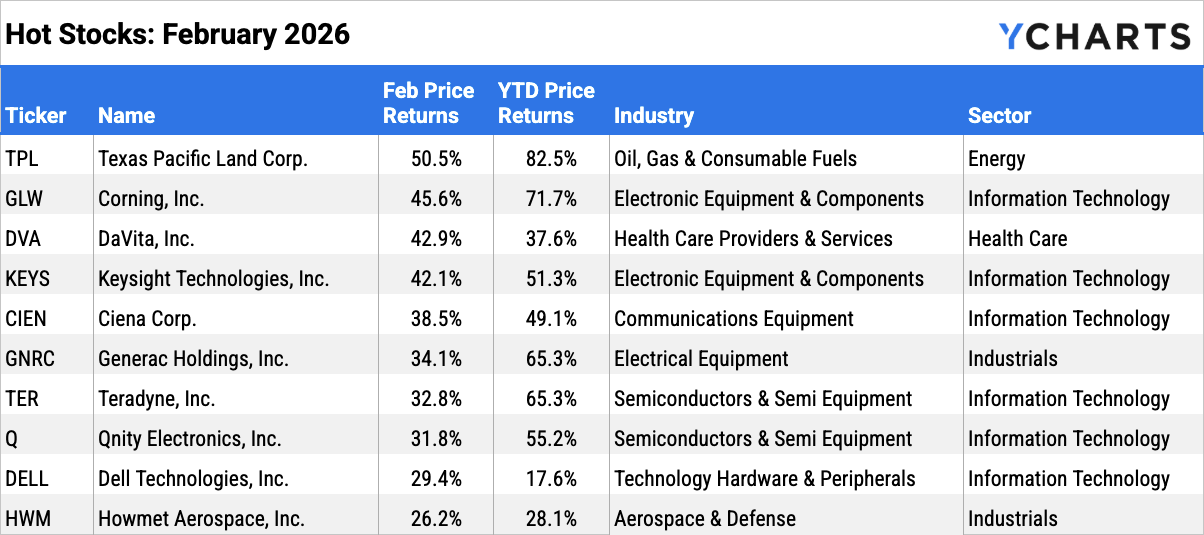
Hot Stocks: Top 10 S&P 500 Performers of February 2026
Download Visual | Modify in YCharts
| Symbol | Name | 1 Month Price Returns | YTD Price Returns | Industry | Sector |
|---|---|---|---|---|---|
| TPL | Texas Pacific Land Corp. | 50.5% | 82.5% | Oil, Gas & Consumable Fuels | Energy |
| GLW | Corning, Inc. | 45.6% | 71.7% | Electronic Equipment, Instruments & Components | Information Technology |
| DVA | DaVita, Inc. | 42.9% | 37.6% | Health Care Providers & Services | Health Care |
| KEYS | Keysight Technologies, Inc. | 42.1% | 51.3% | Electronic Equipment, Instruments & Components | Information Technology |
| CIEN | Ciena Corp. | 38.5% | 49.1% | Communications Equipment | Information Technology |
| GNRC | Generac Holdings, Inc. | 34.1% | 65.3% | Electrical Equipment | Industrials |
| TER | Teradyne, Inc. | 32.8% | 65.3% | Semiconductors & Semiconductor Equipment | Information Technology |
| Q | Qnity Electronics, Inc. | 31.8% | 55.2% | Semiconductors & Semiconductor Equipment | Information Technology |
| DELL | Dell Technologies, Inc. | 29.4% | 17.6% | Technology Hardware, Storage & Peripherals | Information Technology |
| HWM | Howmet Aerospace, Inc. | 26.2% | 28.1% | Aerospace & Defense | Industrials |
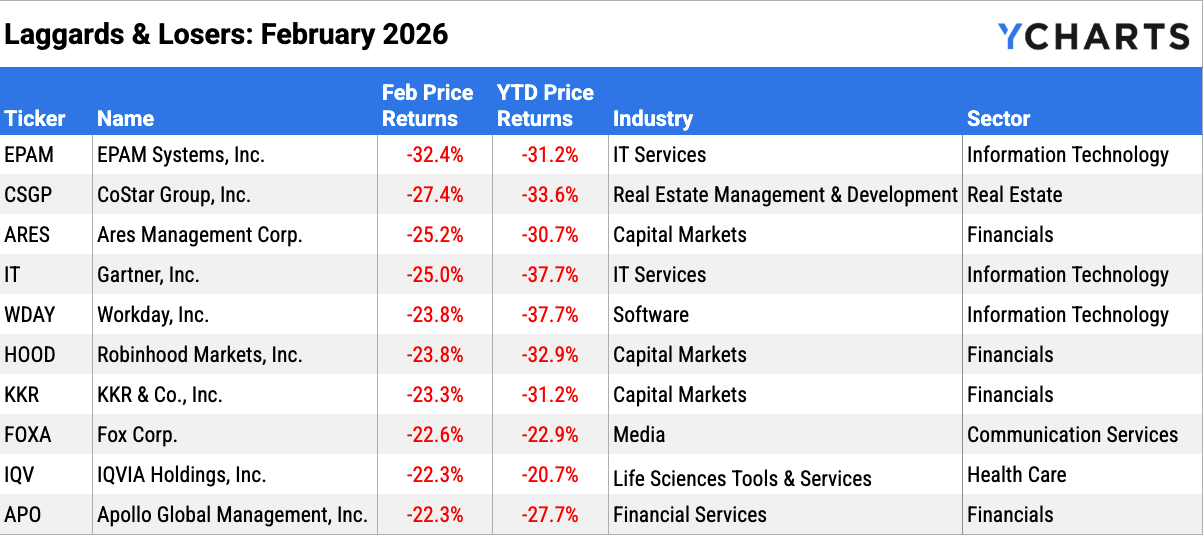
Laggards & Losers: 10 Worst S&P 500 Performers of February 2026
Download Visual | Modify in YCharts
| Symbol | Name | 1 Month Price Returns | YTD Price Returns | Industry | Sector |
|---|---|---|---|---|---|
| EPAM | EPAM Systems, Inc. | -32.4% | -31.2% | IT Services | Information Technology |
| CSGP | CoStar Group, Inc. | -27.4% | -33.6% | Real Estate Management & Development | Real Estate |
| ARES | Ares Management Corp. | -25.2% | -30.7% | Capital Markets | Financials |
| IT | Gartner, Inc. | -25.0% | -37.7% | IT Services | Information Technology |
| WDAY | Workday, Inc. | -23.8% | -37.7% | Software | Information Technology |
| HOOD | Robinhood Markets, Inc. | -23.8% | -32.9% | Capital Markets | Financials |
| KKR | KKR & Co., Inc. | -23.3% | -31.2% | Capital Markets | Financials |
| FOXA | Fox Corp. | -22.6% | -22.9% | Media | Communication Services |
| IQV | IQVIA Holdings, Inc. | -22.3% | -20.7% | Life Sciences Tools & Services | Health Care |
| APO | Apollo Global Management, Inc. | -22.3% | -27.7% | Financial Services | Financials |
Featured Market News and YCharts Insights
Explaining the Blue Owl Headlines to Clients
3 Ways National Accounts Teams Can Strengthen Platform Relationships
Five Things You Should Expect From Your Proposal Software
New Hamilton Lane Benchmarks Now Available in YCharts
Largest Crypto ETFs: January 2026
The Best Performing International ETFs over the Last 10 Years
Economic Data Overview: Inflation and Labor Conditions Improve, Housing Activity Falls Sharply
Employment
The unemployment rate decreased by 0.1 percentage points to 4.3%, and 130,000 jobs were added to the U.S. economy, according to the most recent nonfarm payrolls report. This came in well above the Dow Jones estimate of 55,000. The US Labor Force Participation Rate also increased by 0.1 percentage points to 62.50% in January.
Consumers and Inflation
The US inflation rate fell to 2.40% in January, approaching the Fed’s 2% target, though core inflation rose to 3.09%. The CME FedWatch tool indicates less than a 3% chance of the first rate cut in 2026 during the FOMC’s next meeting on March 18th. Rates were held steady at 3.50-3.75% in January, the first pause in cuts since September.
Production and Sales
The US ISM Manufacturing PMI increased MoM for the first time since September, up to 52.6, into expansion territory for the first time since February of 2025. The Services PMI remained unchanged in January at 53.8. The YoY US Producer Price Index sits at 2.88% in January, while the US Retail and Food Services Sales fell by 0.02% on the month.
Housing
Existing Home Sales fell sharply by 8.43% MoM in January, the largest monthly decline since April of 2020. The Median Sales Price of Existing Homes decreased to $396,800, the first reading below $400,000 in 11 months.
Mortgage rates were largely unchanged in January, ending the month at 5.44% for the 15-year and 5.98% for the 30-year. The US New Single-Family Home Sales fell by 1.72% in December, following growth of 15.55% in November.
Commodities
Gold posted another great month, increasing by 7.93%, leaving SPDR Gold Shares ETF (GLD) trading at $483.75 per share. Silver had a volatile February, though it ultimately advanced another 12.66% on the month.
Oil prices moved slightly as geopolitical tensions continued to raise concerns. Brent crude fell by 0.48% for the month to $71.90 per barrel, as WTI increased by 2.88% to $66.36.
Cryptocurrencies
Major cryptocurrencies continued struggling in February, with Bitcoin falling for the fifth straight month. Bitcoin fell by 21.7% to $65,883.99 per coin. Ethereum experienced a steeper decline, falling 28.5% to $1,931.32.
Since the start of 2025, they are down 28.9% and 42.5% respectively.
Fixed Income Performance: Insights into Bond ETFs and Treasury Yields
US Treasury Yield Curve
1 Month Treasury Rate: 3.74%
3 Month Treasury Rate: 3.67%
6 Month Treasury Rate: 3.60%
1 Year Treasury Rate: 3.48%
2 Year Treasury Rate: 3.38%
3 Year Treasury Rate: 3.39%
5 Year Treasury Rate: 3.51%
10 Year Treasury Rate: 4.97%
20 Year Treasury Rate: 4.57%
30 Year Treasury Rate: 4.64%
Download Visual | Modify in YCharts
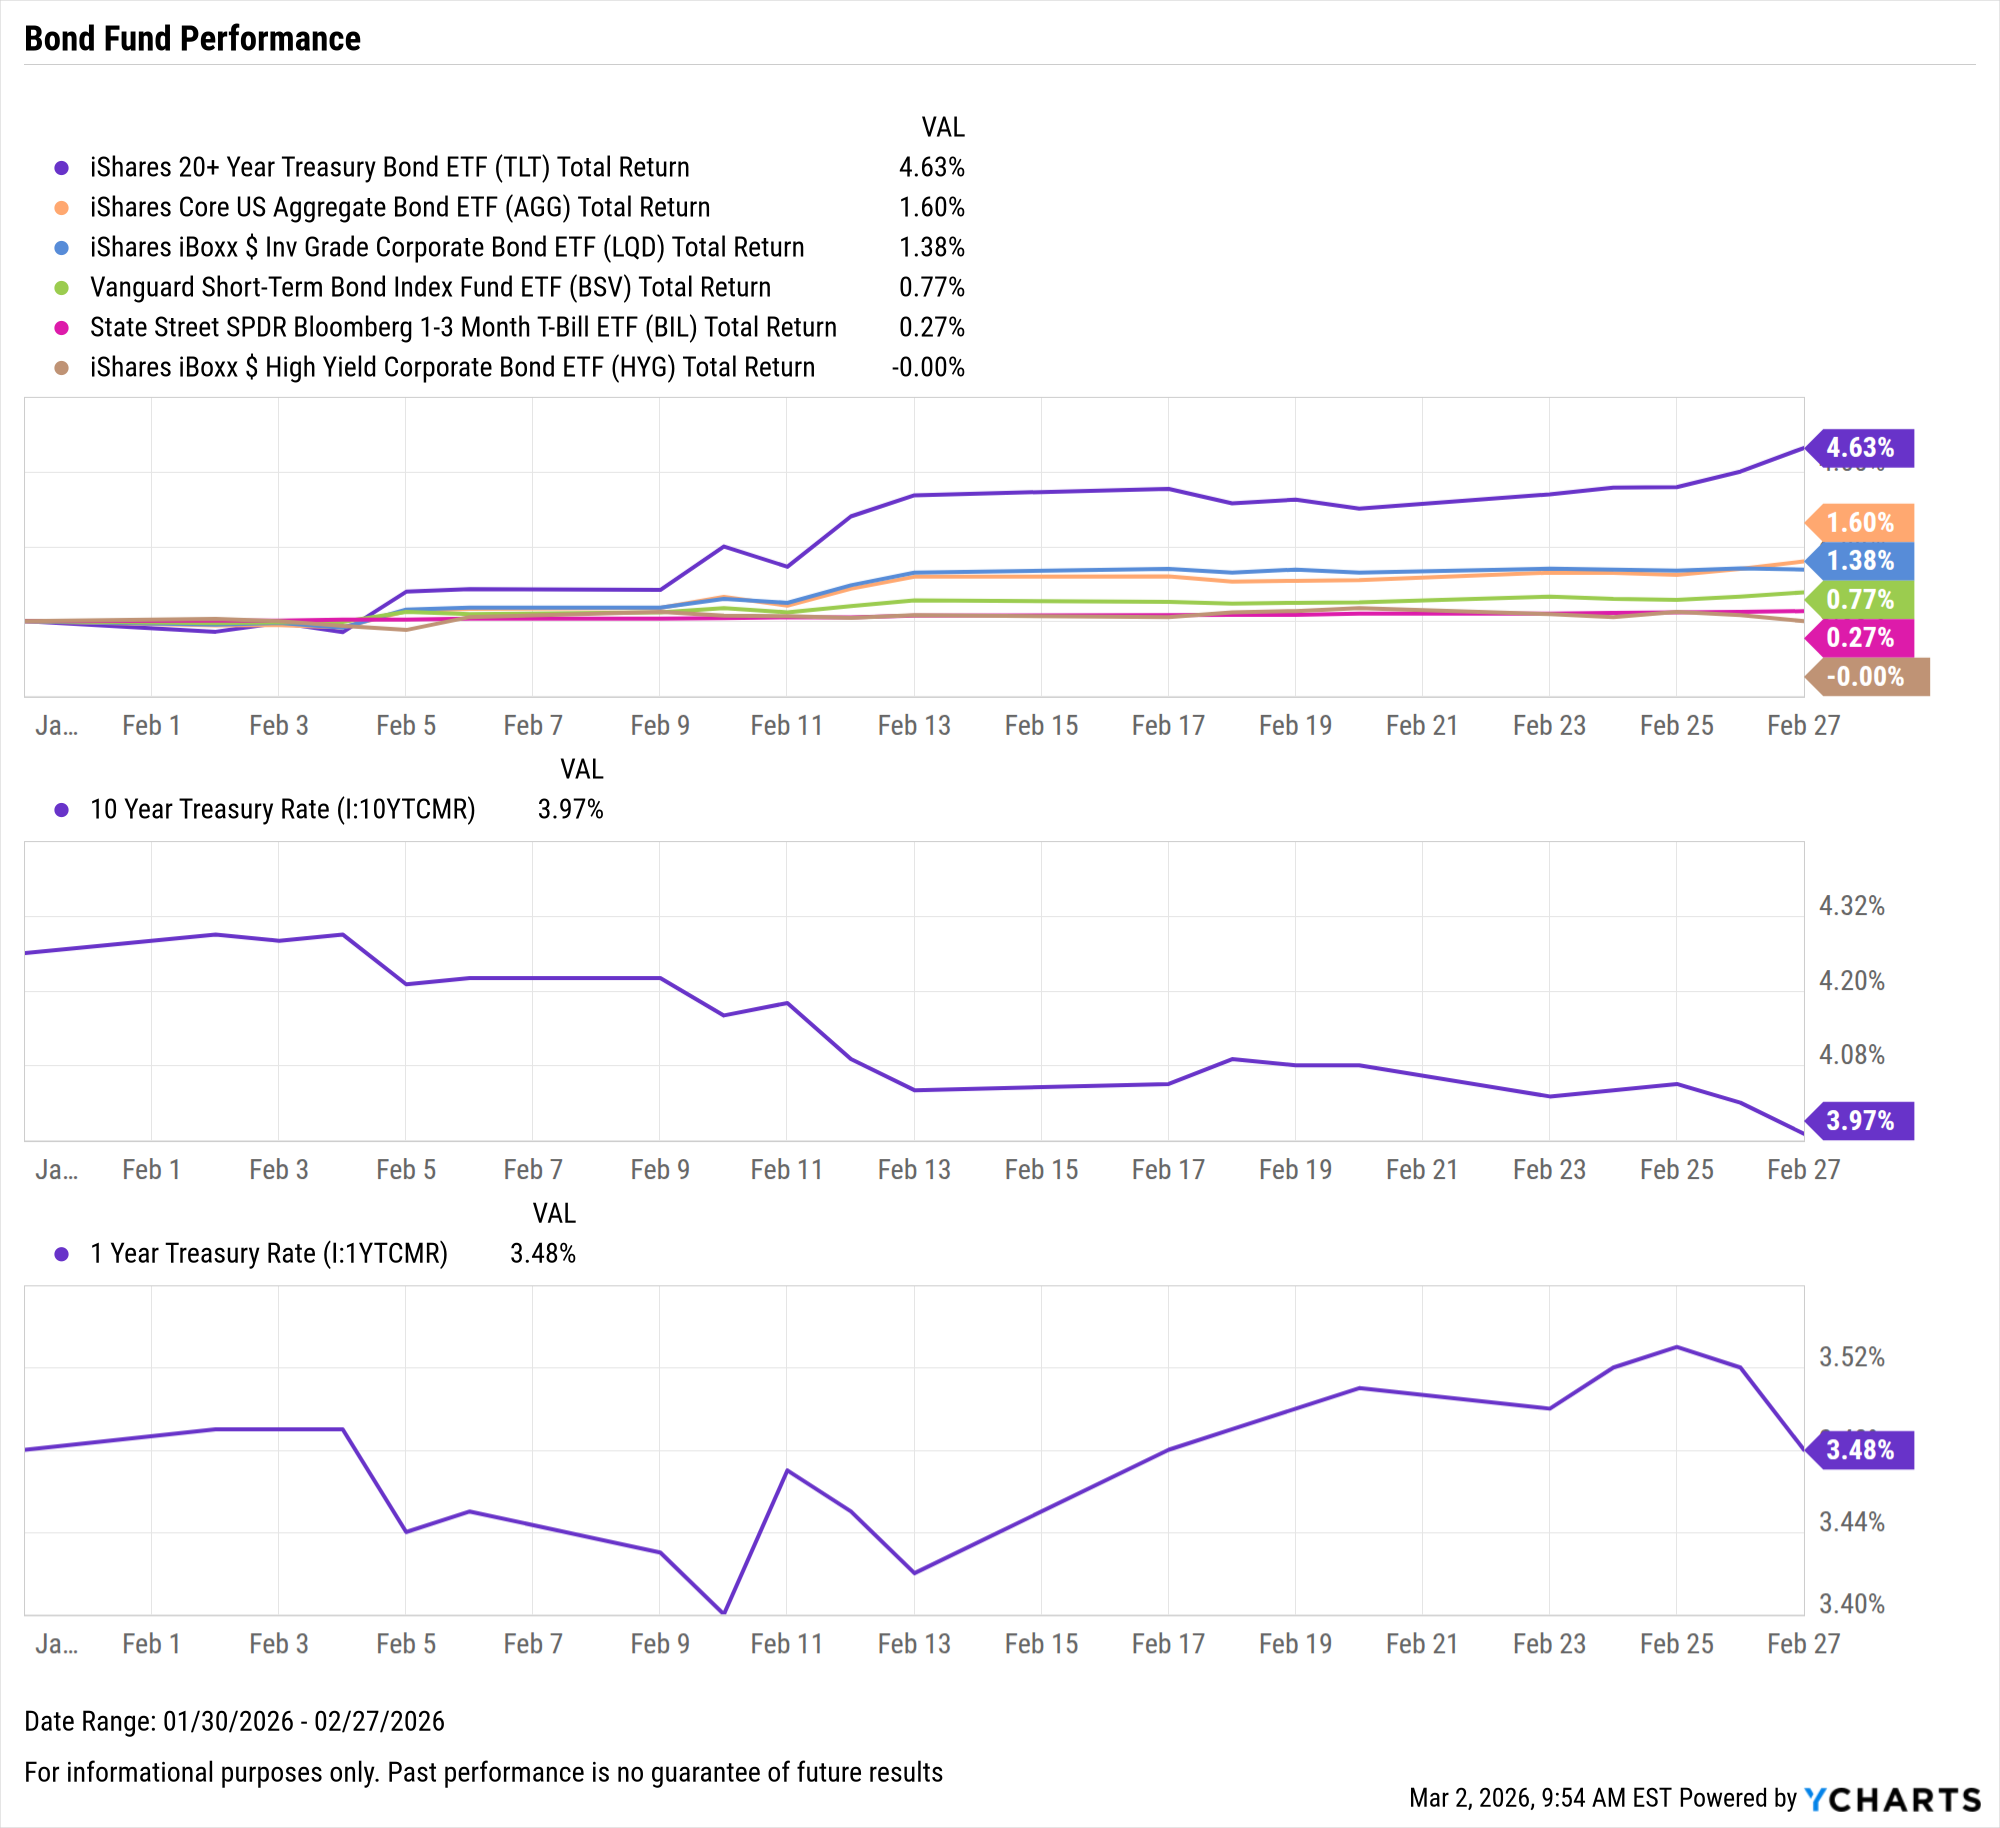
Bond Fund Performance
Download Visual | Modify in YCharts | View Below Table in YCharts
| Ticker | Name | 1 Month Total Returns | 3 Month Total Returns | 6 Month Total Returns | 1 Year Total Returns |
|---|---|---|---|---|---|
| TLT | iShares 20+ Year Treasury Bond ETF | 4.6% | 1.8% | 7.2% | 2.7% |
| AGG | iShares Core US Aggregate Bond ETF | 1.6% | 1.6% | 4.0% | 6.2% |
| LQD | iShares iBoxx $ Inv Grade Corporate Bond ETF | 1.4% | 1.0% | 4.0% | 6.6% |
| BSV | Vanguard Short-Term Bond Index Fund ETF | 0.8% | 1.2% | 2.4% | 5.5% |
| BIL | State Street SPDR Bloomberg 1-3 Month T-Bill ETF | 0.3% | 0.9% | 1.9% | 4.0% |
| HYG | iShares iBoxx $ High Yield Corporate Bond ETF | 0.0% | 1.1% | 2.7% | 6.8% |
As 2026 continues to unfold, monitor the trends in markets and economic data that will determine how clients perform this year. Download the visual aids directly from YCharts, and contact us for customized access to these charts.
Have a great March! 📈
Whenever you’re ready, there are three ways YCharts can help you:
1. Looking for a tool to help you better communicate market events?
Email us at hello@ycharts.com or call (866) 965-7552. You’ll be directly in touch with one of our Chicago-based team members.
2. Want to test out YCharts for free?
Start a no-risk 7-Day Free Trial.
3. Download a copy of the Monthly Market Wrap slide deck:
Disclaimer
©2026 YCharts, Inc. All Rights Reserved. YCharts, Inc. (“YCharts”) is not registered with the U.S. Securities and Exchange Commission (or with the securities regulatory authority or body of any state or any other jurisdiction) as an investment adviser, broker-dealer or in any other capacity, and does not purport to provide investment advice or make investment recommendations. This report has been generated through application of the analytical tools and data provided through ycharts.com and is intended solely to assist you or your investment or other adviser(s) in conducting investment research. You should not construe this report as an offer to buy or sell, as a solicitation of an offer to buy or sell, or as a recommendation to buy, sell, hold or trade, any security or other financial instrument. For further information regarding your use of this report, please go to: ycharts.com/about/disclosure
Next Article
The 10 Best Performing Stocks in the Last 25 YearsRead More →