Monthly Market Wrap: August 2023
Welcome back to the Monthly Market Wrap from YCharts, where we break down the most important trends for advisors and their clients in this monthly market review. As always, feel free to download and share any visuals with clients and colleagues, or on social media.
Speaking of visuals: be sure to download our free Monthly Market Wrap slide deck, containing all charts featured in the Market Wrap + more.
Get the Monthly Market Wrap slide deck sent straight to your inbox. Download Here:August 2023 Market Summary
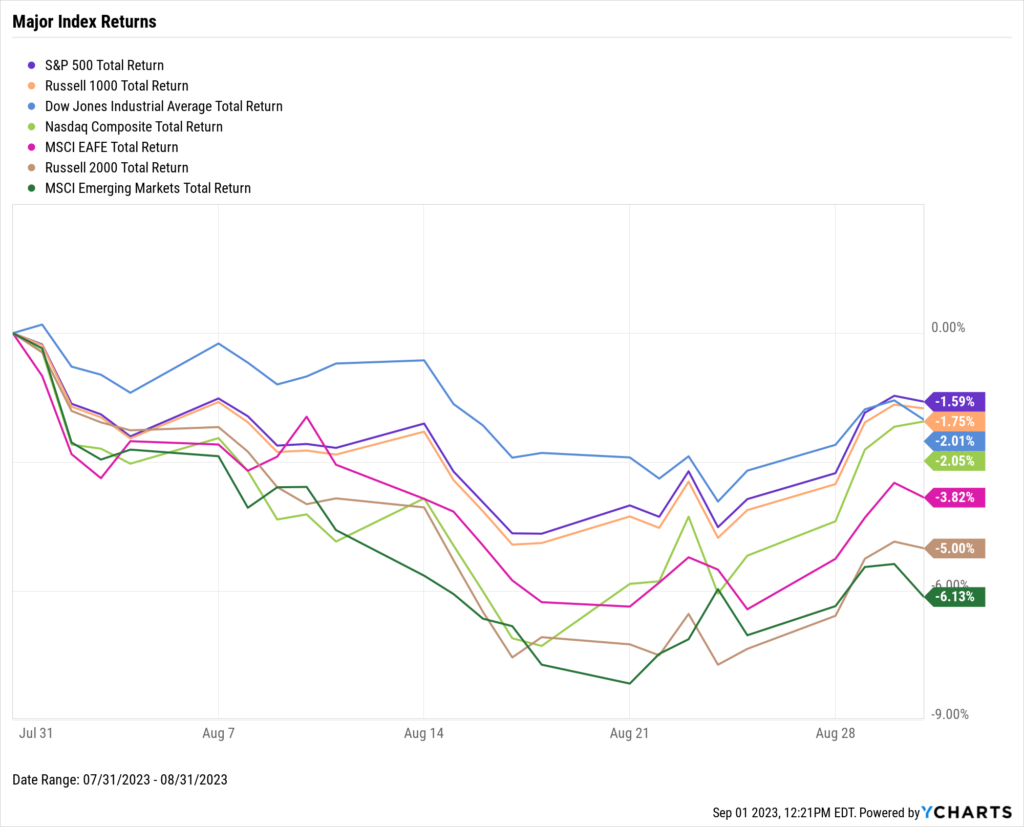
Stocks took a breather in August as the S&P 500 fell 1.6%, the Dow Jones Industrial Average slipped 2.0%, and the NASDAQ ended 2.1% lower. It was a disappointing month globally–EAFE sank 3.8% in August and Emerging Markets tumbled 6.1%. Nonetheless, August didn’t subtract too much from the upbeat year-to-date performance of major US indices. The NASDAQ is still up 34.1% in 2023, the S&P 500 is 17.4% higher, and the Dow 4.8%.
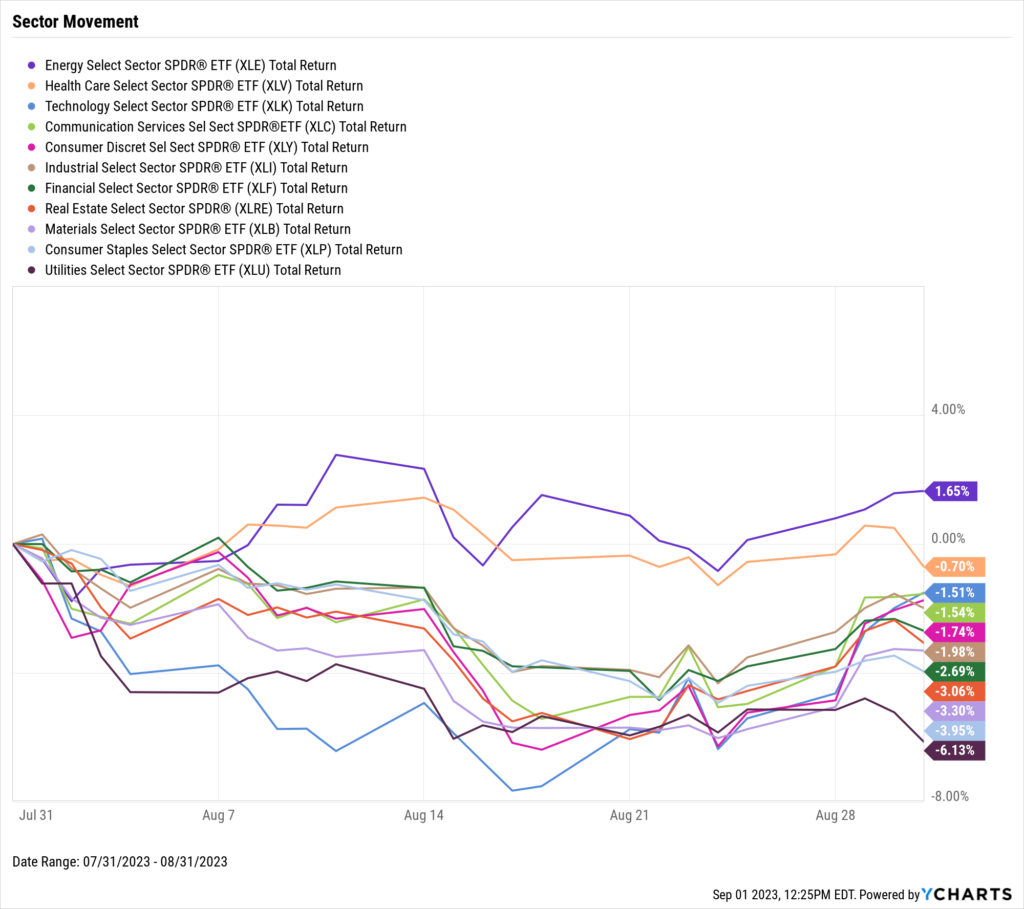
Energy was the only US stock sector that posted a positive return in August, up 1.6%. Utilities was the laggard of the remaining ten sectors, down 6.1%.
Unemployment rose by three-tenths in August to 3.8%, even as the labor force participation rate grew. Inflation crept back up above 3%, while Core Inflation fell to 4.65%. The Median Sales Price of Existing Homes leveled off this month, and mortgage rates reached 20-year highs. Gas prices rose in August even as the price of Brent and WTI crude oil traveled in opposite directions this month.
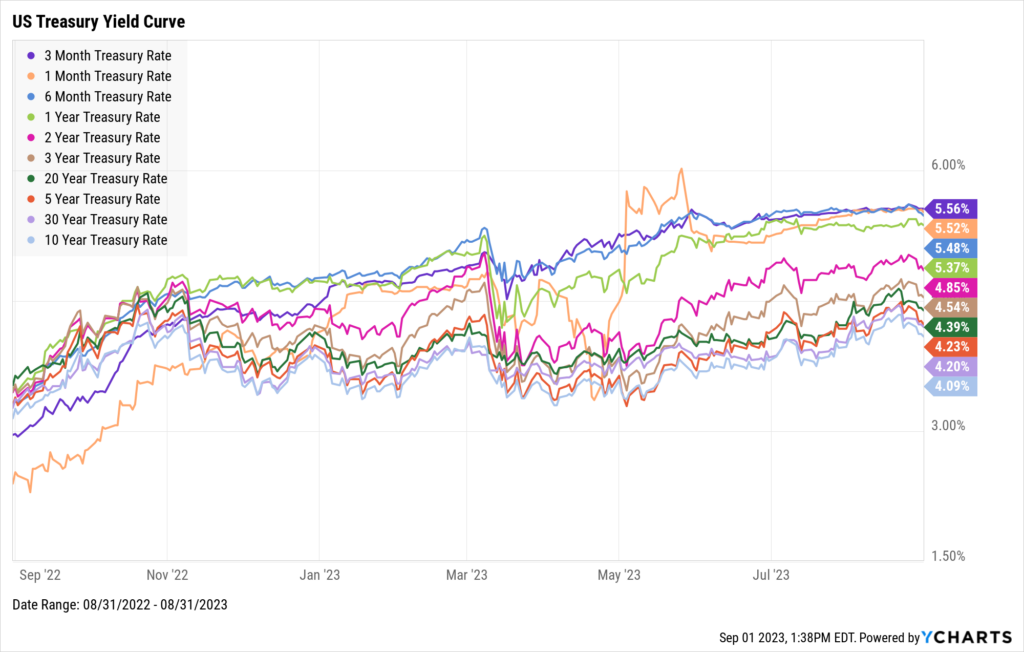
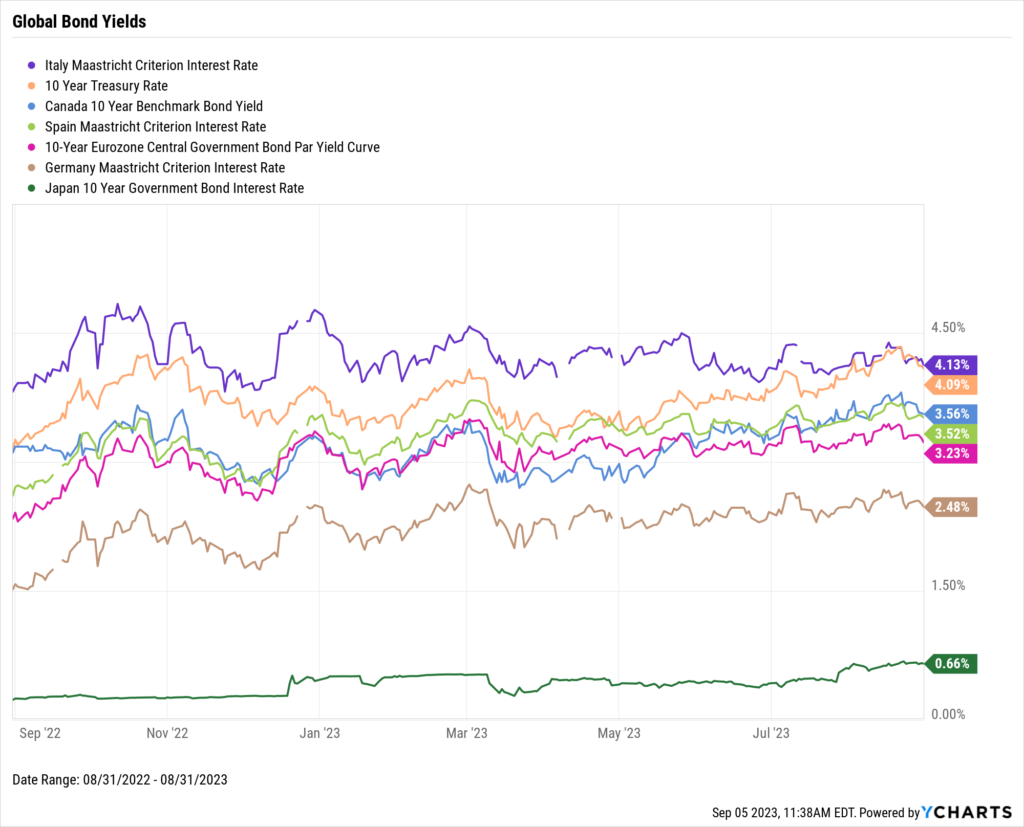
US Treasury yields were largely flat in August, echoing the rather muted performance from equities. The 3-Month Treasury Bill remains the highest-yielding US treasury instrument at 5.56%, and the 10-Year is the lowest at 4.09%. In global fixed income, the yield on Japan’s 10 Year Government Bond rose by 5 basis points to 0.66%.
Jump to Fixed Income Performance
Want access to full-year charts and data as well? Download our Monthly Market Wrap Slide Deck for more:Off the YCharts! The Rise of NVIDIA
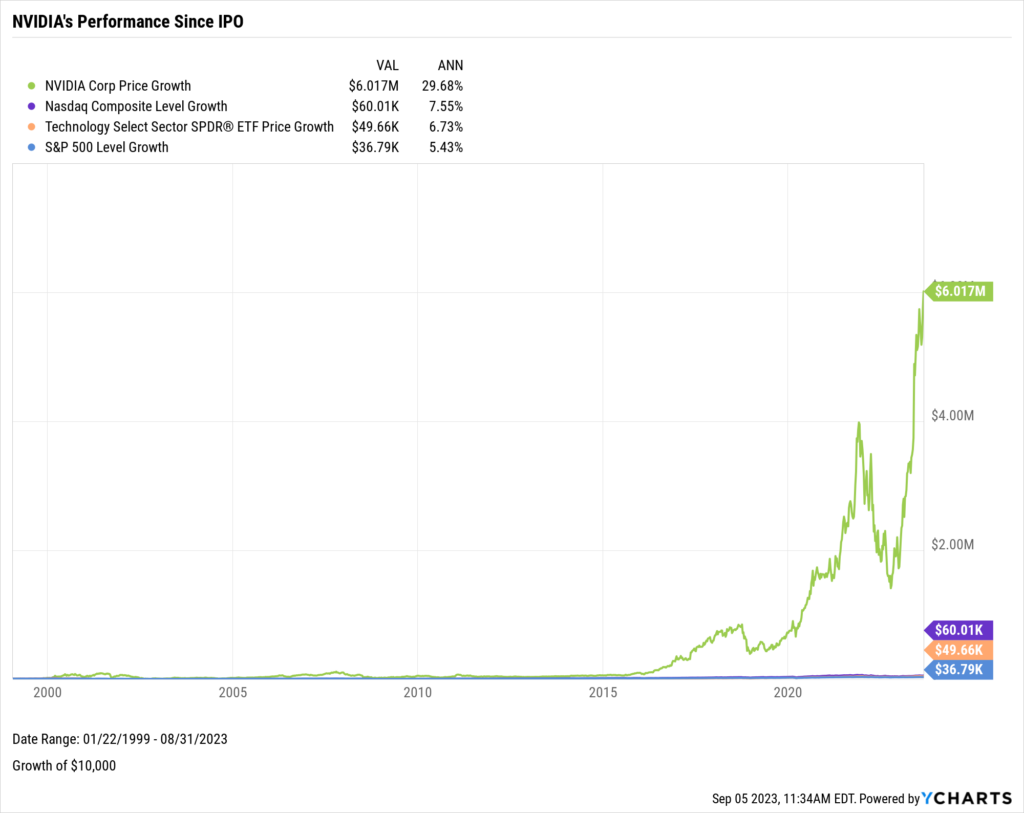
Talk about a truly “off the charts” performance.
The rise of NVIDIA (NVDA) has been all the talk lately.Explosive growth in data center and AI chip sales has propelled NVIDIA to be the best YTD performer in both the S&P 500 and NASDAQ indices by a longshot. We explained the rise of NVDA in 5 charts.
If you invested $10,000 into NVIDIA at its IPO back in January of 1999, that investment would be worth over $6 million today. NVIDIA’s annualized return of nearly 30% (60,070% total) dwarfs even the widely respected performances of the NASDAQ, S&P 500, and even the Technology Sector (XLK) since 1999.
Download Visual | Modify in YCharts
Equity Performance
Major Indexes
Download Visual | Modify in YCharts | View Below Table in YCharts
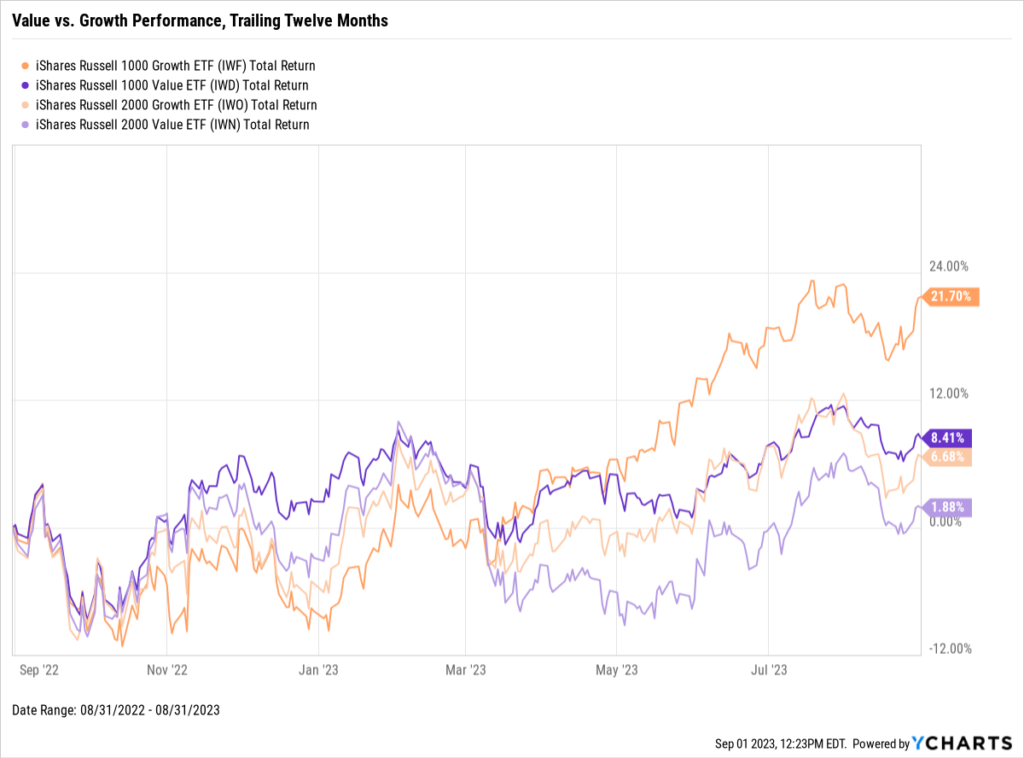
Value vs. Growth Performance, Trailing Twelve Months
Download Visual | Modify in YCharts | View in Comp Tables
US Sector Movement
Download Visual | Modify in YCharts | View Below Table in YCharts
Hot Stocks: Top 10 S&P 500 Performers of August 2023
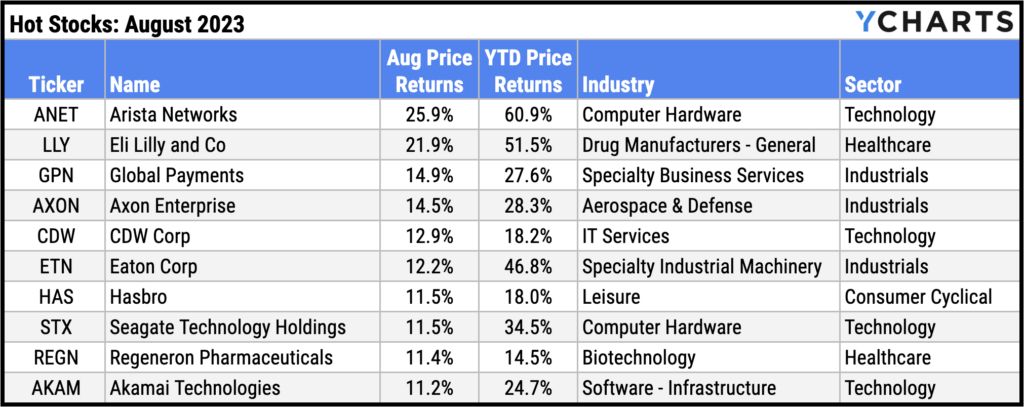
Download Visual | Modify in YCharts
Laggards & Losers: 10 Worst S&P 500 Performers of August 2023
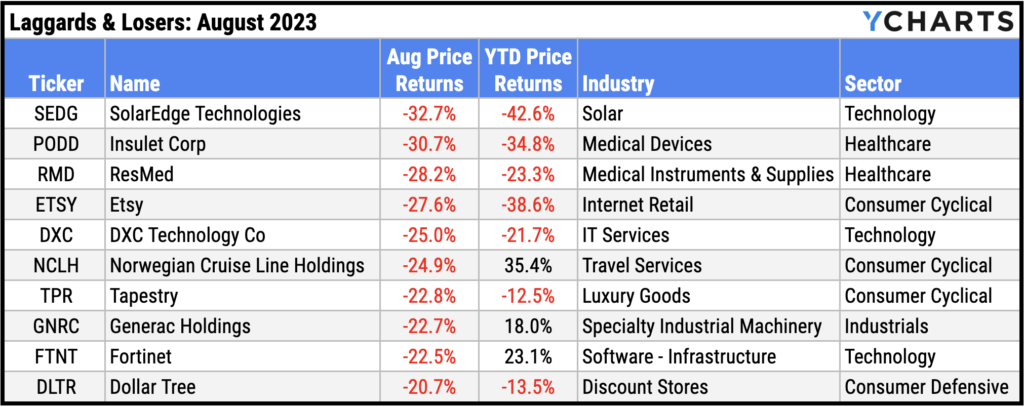
Download Visual | Modify in YCharts
Featured Market & Advisor News
Money-Market Fund Assets Climb To Fresh Record $5.58 Trillion (FA-Mag)
Betting on Bonds: Capitalizing on Fixed Income After Rising Rates (YCharts)
Business leaders show growing optimism in US economy (InvestmentNews)
The Magnificent Seven Stocks: Post-Q2 Earnings Recap (YCharts)
Fed Officials Say Rates Close to Peak, More Increases Possible (WealthManagement.com)
The Rise of NVIDIA in 5 Charts (YCharts)
Economic Data
Employment
August’s unemployment rate rose to 3.8%, three-tenths higher than July’s figure of 3.5%. However, the labor force participation rate grew by two-tenths to 62.8%. 187,000 jobs were added in August, surpassing nonfarm payrolls expectations of 170,000.
Consumers and Inflation
After dipping below 3% for the first time in over two years, Inflation inched higher in July to 3.18%, up from 2.97% in June. Core Inflation did fall in July to 4.65%. The US Consumer Price Index rose a slight 0.17% in July, while MoM US Personal Spending rose at a higher MoM clip for the second straight month to 0.79%. The last action taken by the Federal Reserve was raising the benchmark Target Federal Funds Rate by 25 basis points to 5.50% at its July 26th meeting. This was the 11th rate hike in the Fed’s last 12 meetings.
Production and Sales
The US ISM Manufacturing PMI rebounded in August by 1.2 points to 47.6. However, as it’s still below 50, the key manufacturing index remains in contraction territory. US Retail and Food Services Sales grew by 0.73% MoM in July, and the YoY US Producer Price Index rose 0.80%.
Housing
MoM US New Single-Family Home Sales increased 4.4% in July, following a June in which new home sales contracted. However, US Existing Home Sales sank for the 16th month out of the last 18, down 2.2% in July. The mixed housing data resulted in the Median Sales Price of Existing Homes leveling off, slipping 0.8% to $406,700. Mortgage rate increases were largely negligible in July; 15-Year and 30-Year Mortgage Rates closed out the month at 6.55% and 7.18%, respectively. The 30-year mortgage rate has not been this high since early 2001.
Commodities
The price of Gold fell 2.8% in August, up from $1,970.70 to $1,915.50. Oil prices were mixed in August; the price of WTI per barrel slipped 1.4% to $80.65 while Brent inched 0.2% higher to $85.42. The average price of regular gas rose 1.6% in August despite the mixed data, up 6 cents per gallon to $3.93 as of month’s end.
Cryptocurrencies
Crypto assets pulled back further in August. The price of Bitcoin slumped by 6.8% to $27,297 as of August 31st, and Ethereum dropped by 8.4% to $1,705. Nonetheless, 2023 has been a solid rebound year for crypto. Bitcoin is up 64% and Ethereum is 41.9% higher.
Fixed Income
US Treasury Yield Curve
1 Month Treasury Rate: 5.52%
3 Month Treasury Rate: 5.56%
6 Month Treasury Rate: 5.48%
1 Year Treasury Rate: 5.37%
2 Year Treasury Rate: 4.85%
3 Year Treasury Rate: 4.54%
5 Year Treasury Rate: 4.23%
10 Year Treasury Rate: 4.09%
20 Year Treasury Rate: 4.39%
30 Year Treasury Rate: 4.20%
Download Visual | Modify in YCharts
Global Bonds
Italy Long Term Bond Interest Rate: 4.13%
10 Year Treasury Rate: 4.09%
Canada 10 Year Benchmark Bond Yield: 3.55%
Spain Long Term Bond Interest Rate: 3.52%
10-Year Eurozone Central Government Bond Par Yield: 3.23%
Germany Long Term Bond Interest Rate: 2.48%
Japan 10 Year Government Bond Interest Rate: 0.66%
Download Visual | Modify in YCharts
Have a great September! 📈
Get the Monthly Market Wrap slide deck sent straight to your inbox. Download Here:Next Article
Empower High-Net-Worth Clients with SMAs and YChartsRead More →