Empower High-Net-Worth Clients with SMAs and YCharts
Separately Managed Accounts (SMAs) are becoming increasingly popular among financial advisors. A 2022 Broadridge survey revealed that 62% of financial advisors use SMAs, and 56% plan to increase their usage over the next two years.
Despite this trend, Sarah, a seasoned financial advisor, was at a crossroads when her longstanding client, Emily, expressed interest in a more tailored investment approach involving SMAs. Sarah recognized the opportunity to expand her expertise. However, she soon realized that the landscape for SMAs is quite different from that of ETFs and Mutual Funds, with a noticeable scarcity of public comparison tools available.
YCharts fills this gap. With YCharts, advisors like Sarah are adding value for their clients by including the most appropriate SMAs in their strategy.
What is a Separately Managed Account (SMA)?
Separately Managed Accounts (SMAs) have been a part of the investment landscape since the early 1970s. SMAs are customized investment portfolios designed to suit a specific client’s needs. Unlike mutual funds or ETFs, where assets are pooled, SMAs allow clients to have direct ownership of individual securities. This offers unparalleled levels of transparency, customization, and control.
SMAs are particularly beneficial for high-net-worth individuals and institutional investors seeking customized investment strategies. The ownership structure of a SMA provides unique advantages, especially when it comes to taxes.
In contrast to a mutual fund, where you can incur unearned capital gains taxes – a tax liability from portfolio gains that occurred before you invested in the fund, SMAs eliminate this issue. Since assets are owned directly by the investor, unearned capital gains are no longer a concern.
Additionally, a SMA investor usually has some influence to direct the portfolio manager to sell specific securities to attempt to equalize gains and losses across an investor’s entire portfolio for a given year to reduce the capital gains taxes owed.
Researching Separately Managed Accounts
After further conversations, Sarah discerns that Emily is keen on having more of a growth tilt in her portfolio. YCharts provides Sarah with multiple tools to accomplish this. For example, she can utilize the Fund Screener to sift through SMAs with a growth orientation and a filter to see the top 5 percent of performers on an annualized basis over three years.
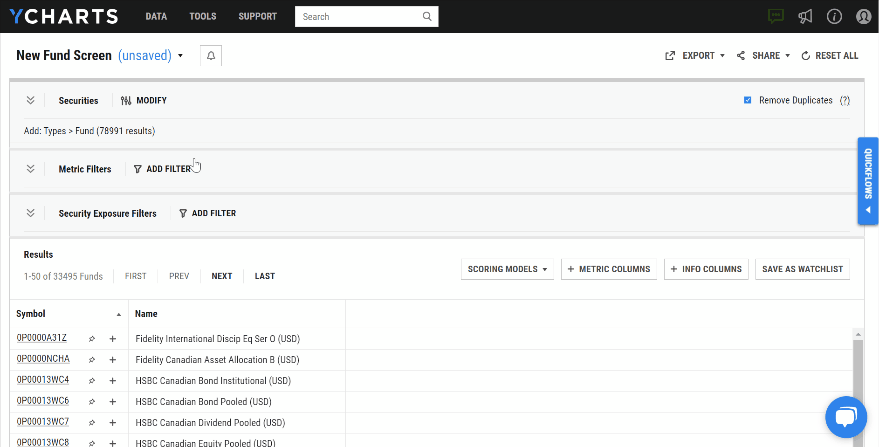
Alternatively, if Sarah already knows of a SMA that aligns with Emily’s goal, she can employ the quickflows function directly on the quote page. With just a couple of clicks, Sarah can identify similar SMAs.
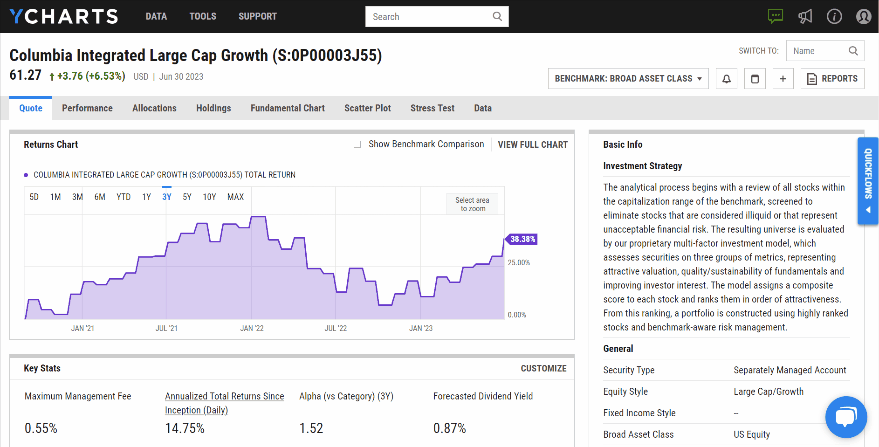
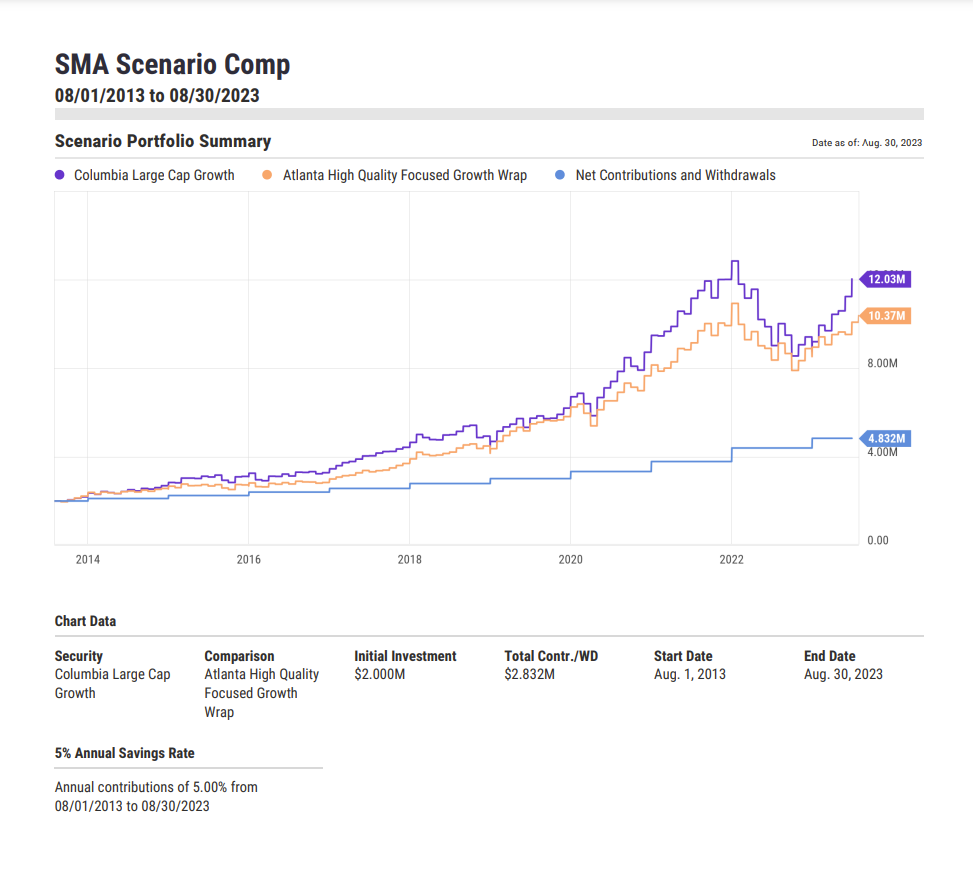
Subsequently, Sarah can compare funds based on high-priority criteria and employ Fundamental Charts or Scenarios to craft compelling visuals.
Schedule a demo to get access to SMA Data
According to the new SEC Marketing Rule 206(4)-1, modifications have been implemented in how YCharts portrays SMA performance. By default, performance calculations are represented as net of fees (instead of gross).
Presenting Separately Managed Accounts
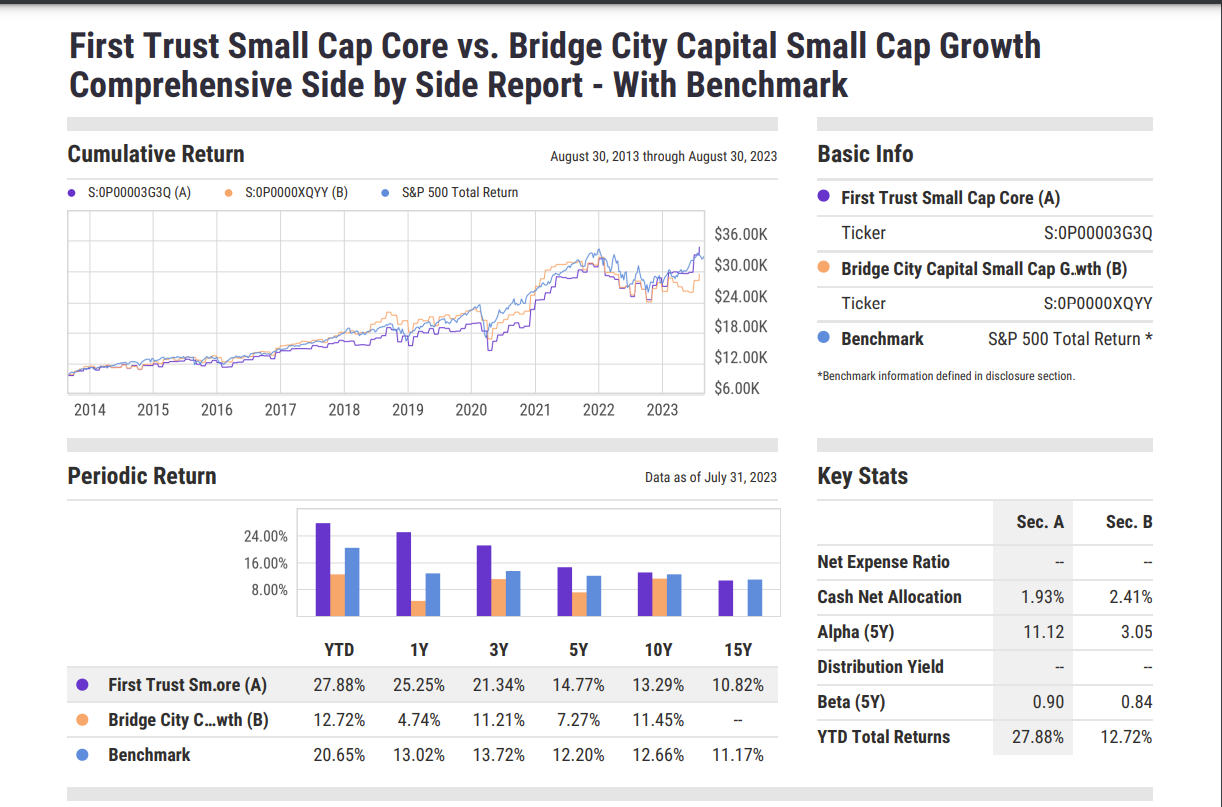
Once Sarah has shortlisted the SMAs she intends to recommend to Emily, she can leverage the Report Builder feature to craft a comprehensive comparison report. She can illustrate the performance of different SMAs and even demonstrate how Emily’s portfolio would have performed with and without the selected SMA.
Schedule a demo to get access to SMA Data
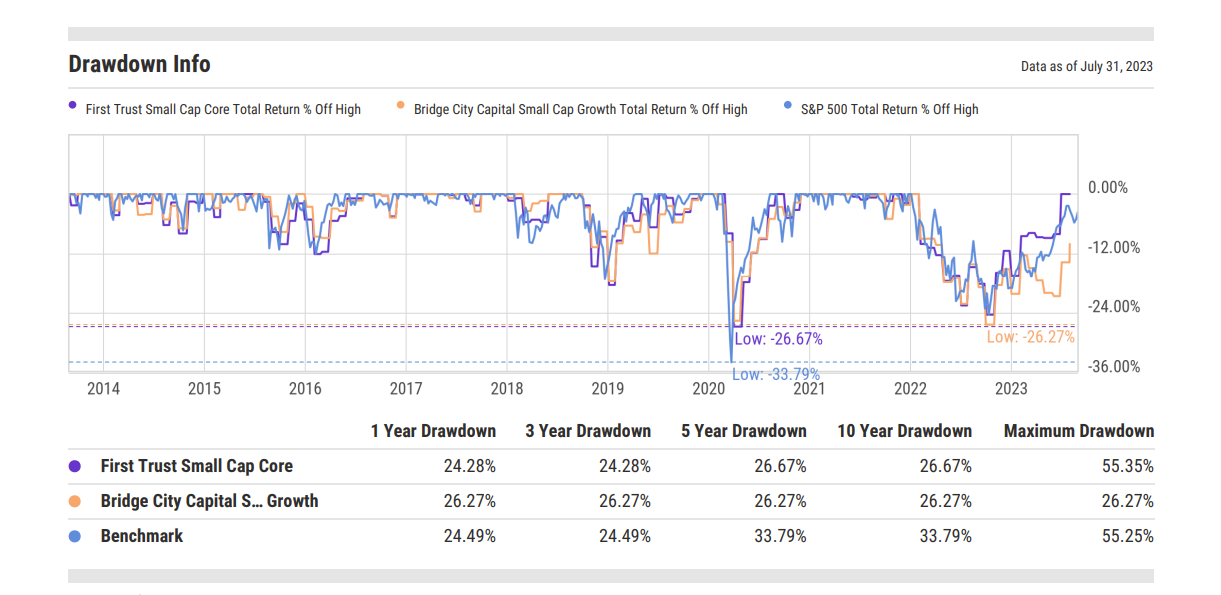
Regardless of the report she opts for, Sarah can incorporate the insights she previously developed in Fundamental Charts or Scenarios into her client presentation or even showcase the drawdown information for both SMAs.
Schedule a demo to get access to SMA Data
These client-centric reports are not only instrumental in facilitating discussions with existing clients like Emily, but YCharts also provides valuable tools for an advisor trying to acquire new business.
Connect with YCharts
To get in touch, contact YCharts via email at hello@ycharts.com or by phone at (866) 965-7552
Interested in adding YCharts to your technology stack? Sign up for a 7-Day Free Trial.
Disclaimer
©2023 YCharts, Inc. All Rights Reserved. YCharts, Inc. (“YCharts”) is not registered with the U.S. Securities and Exchange Commission (or with the securities regulatory authority or body of any state or any other jurisdiction) as an investment adviser, broker-dealer or in any other capacity, and does not purport to provide investment advice or make investment recommendations. This report has been generated through application of the analytical tools and data provided through ycharts.com and is intended solely to assist you or your investment or other adviser(s) in conducting investment research. You should not construe this report as an offer to buy or sell, as a solicitation of an offer to buy or sell, or as a recommendation to buy, sell, hold or trade, any security or other financial instrument. For further information regarding your use of this report, please go to: ycharts.com/about/disclosure
Next Article
The Rise of NVIDIA in 5 ChartsRead More →