Monthly Market Wrap: January 2022
Welcome back to the Monthly Market Wrap from YCharts, where we break down the most important market trends for advisors and their clients every month. As always, feel free to download and share any visuals with clients and colleagues, or on social media.
Want the Monthly Market Wrap sent straight to your inbox? Subscribe below:
Are you based in Canada or following Canadian markets? Check out and subscribe to the Monthly Canada Market Wrap from YCharts.
The Wrap has a new look! Our goal is to give you more shareable insights in an easy-to-read format — let us know how we did or drop a suggestion here.
January 2022 Market Summary
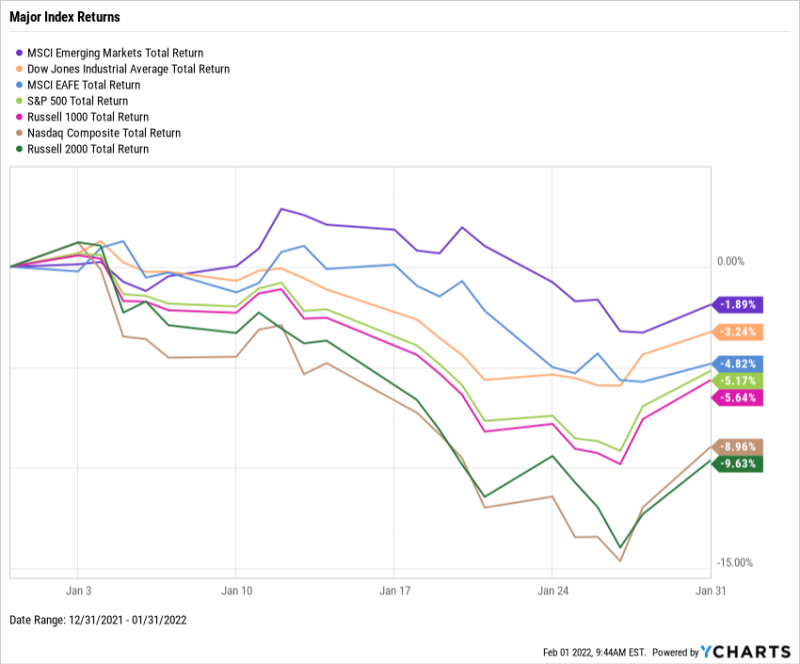
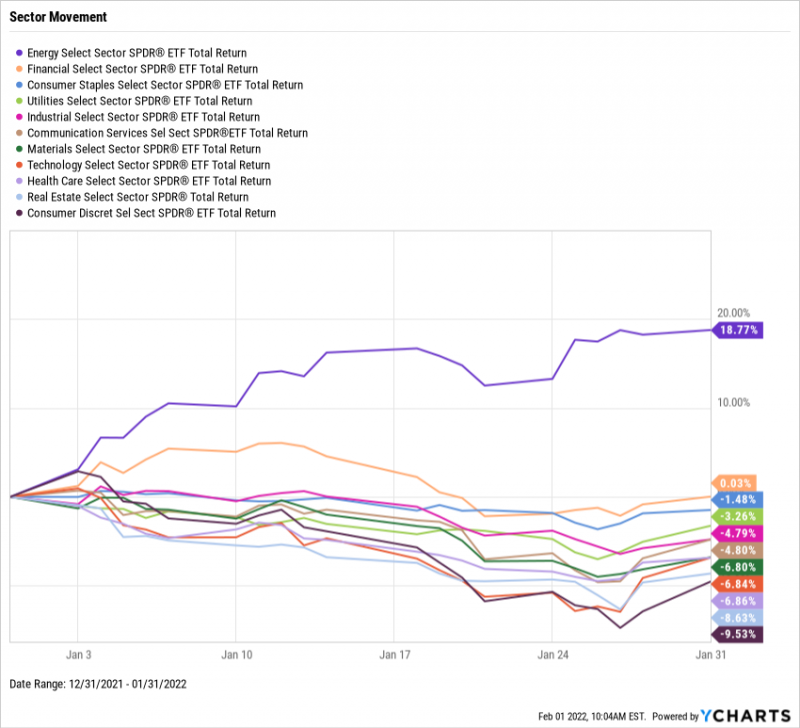
Equities were off to a rough start in 2022, as the S&P 500 fell 5.2% and the Nasdaq 9%. Only one sector was positive in January: Energy, which shot 18.8% higher as tensions between Russia and Ukraine fueled the possibility of reduced oil supply. Though Financials were flat, Consumer Discretionary and other cyclical sectors took the worst hits in January.
US treasury rates got a lift in January on news that the Federal Reserve would accelerate the timeline for raising rates. (Hint: stocks didn’t take too kindly to this, nor to speculation by some analysts that 6 to 7 rate hikes could come this year.) The 6-Month Treasury Rate increased 30 basis points to 0.49%, while the 10-Year rose from 1.52% to 1.79%.
Jump to Fixed Income Performance
We saw the unemployment rate fall below 4% for the first time since February 2020. However, inflation continues to remain at an elevated 7%. Instruments perceived as inflation “hedges” or “safe havens” have failed to take off as well. The price of gold fell 1% in January and has traded sideways over the past twelve months, while the new kids on the inflation hedge block, cryptocurrencies, plummeted in January.
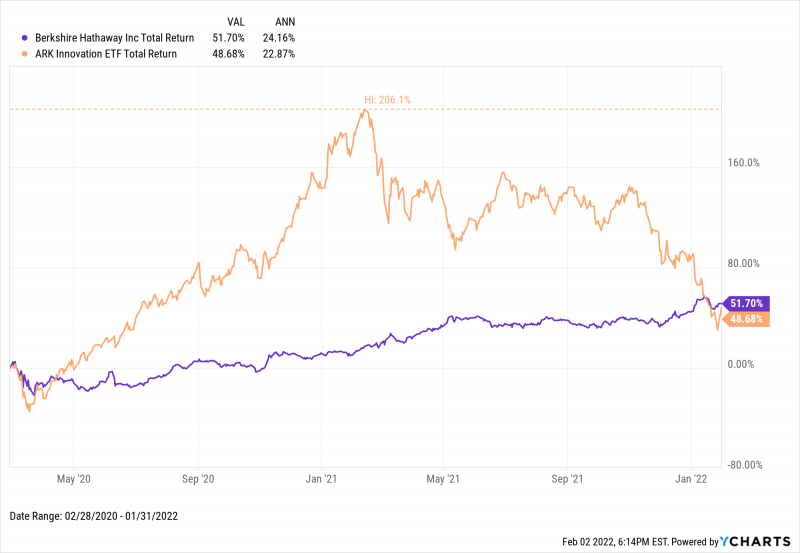
Off the YCharts! Follow the Arc of ARK, or is Berkshire Hathaway the Way?
Warren Buffett once said, “Charlie (Munger) and I would much rather earn a lumpy 15 percent over time than a smooth 12 percent.” But over the past 22 months, perhaps Buffett has never seen anything quite as “lumpy” as Cathie Wood’s ARK Innovation ETF (ARKK), nor a stock as “smooth” as his own Berkshire Hathaway (BRK.B, BRK.A).
ARKK rose as much as 206.1% since the end of February 2020. However, shares have now been cut by more than half since its peak, to the point where Berkshire Hathaway is outperforming the once high-flying ETF as of January’s end. Berkshire’s smoother trajectory also edged out ARKK’s wilder path on an annualized return basis over the past 22 months.
Download Visual | Modify in YCharts
Equity Performance
Major US Indexes
Download Visual | Modify in YCharts
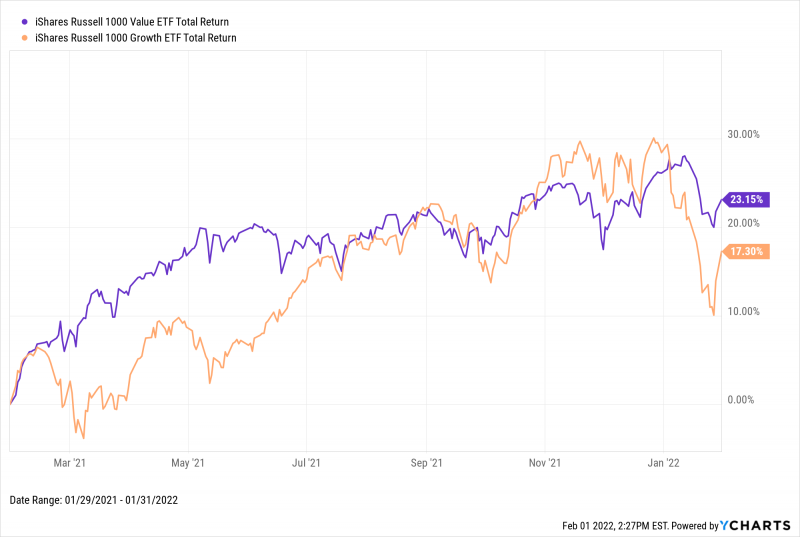
Value vs. Growth Performance
Though equities were down as a whole in January, value stocks took less of a hit. The iShares Russell 1000 Value ETF (IWD) fell 2.4% in January, while its growth counterpart (IWF) sank 8.7%. Value has also outperformed growth by nearly 6 points over the trailing twelve months.
Download Visual | Modify in YCharts
US Sector Movement
Download Visual | Modify in YCharts
Hot Stocks: January’s Top 10 S&P 500 Performers
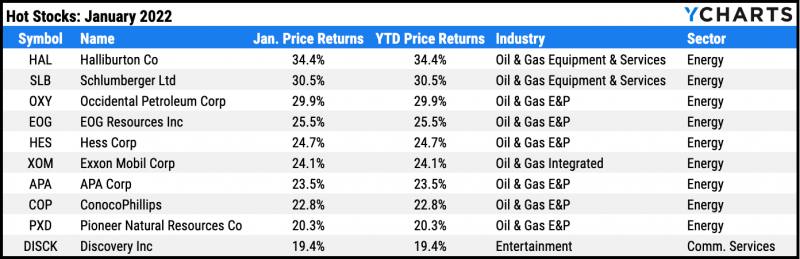
Download Visual | Modify in YCharts
Halliburton (HAL): 34.4%
Schlumberger (SLB): 30.5%
Occidental Petroleum (OXY): 29.9%
EOG Resources (EOG): 25.5%
Hess (HES): 24.7%
Exxon Mobil (XOM): 24.1%
APA (APA): 23.5%
ConocoPhillips (COP): 22.8%
Pioneer Natural Resources (PXD): 20.3%
Discover (DISCK): 19.4%
Laggards & Losers: January’s 10 Worst S&P 500 Performers
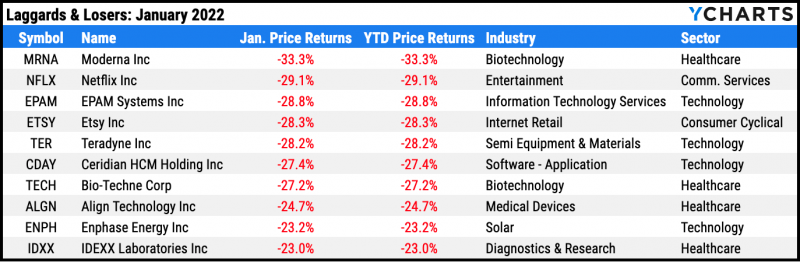
Download Visual | Modify in YCharts
Moderna (MRNA): -33.3%
Netflix (NFLX): -29.1%
EPAM Systems (EPAM): -28.8%
Etsy (ETSY): -28.3%
Teradyne (TER): -28.2%
Ceridian HCM Holding (CDAY): -27.4%
Bio-Techne (TECH): -27.2%
Align Technology (ALGN): -24.7%
Enphase Energy (ENPH): -23.2%
IDEXX Laboratories (IDXX): -23.0%
Fixed Income Performance
US Treasury Yield Curve
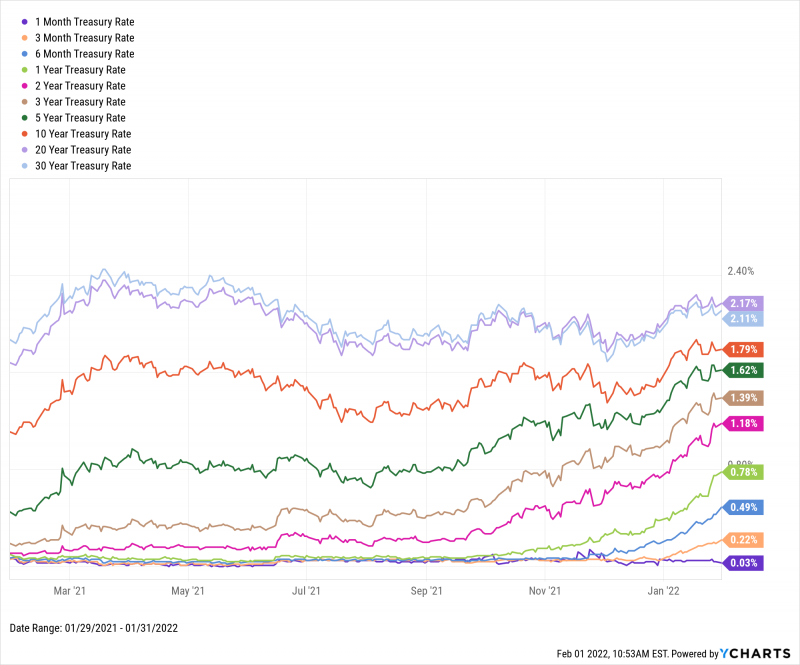
Download Visual | Modify in YCharts
1 Month Treasury Rate: 0.03%
3 Month Treasury Rate: 0.22%
6 Month Treasury Rate: 0.49%
1 Year Treasury Rate: 0.78%
2 Year Treasury Rate: 1.18%
3 Year Treasury Rate: 1.39%
5 Year Treasury Rate: 1.62%
10 Year Treasury Rate: 1.79%
20 Year Treasury Rate: 2.17%
30 Year Treasury Rate: 2.11%
Global Bonds
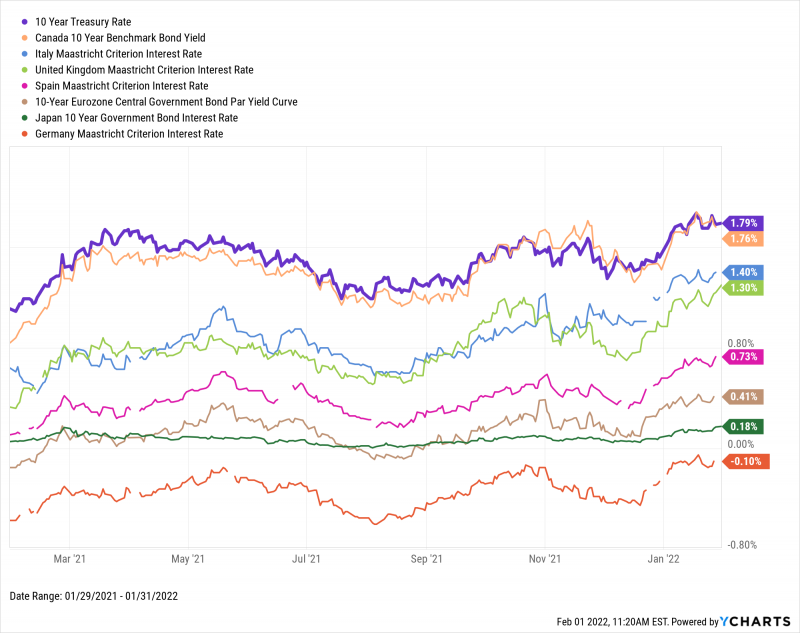
Download Visual | Modify in YCharts
10 Year Treasury Rate: 1.79%
Canada 10 Year Benchmark Bond Yield: 1.76%
Italy Long Term Bond Interest Rate: 1.40%
United Kingdom Long Term Bond Interest Rate: 1.30%
Spain Long Term Bond Interest Rate: 0.78%
10-Year Eurozone Central Government Bond Par Yield: 0.41%
Japan 10 Year Government Bond Interest Rate: 0.18%
Germany Long Term Bond Interest Rate: -0.10%
Featured Market & Advisor News
Fed Officials Stress Not Jamming Brakes on Economy As Hikes Loom (FA-Mag)
Can You Hedge Inflation with an ETF? Or Bitcoin? (YCharts)
60/40 Portfolio Suffers Worst Loss Since March 2020 (InvestmentNews)
2021 Fund Flows: Fixed Income & Large Blend Win, Growth Loses (YCharts)
ETF Trading Surges to Record as Bulls and Bears Play Tug-of-War (WealthManagement.com)
Economic Update — Reviewing Q4 2021 (YCharts)
Economic Data
Employment
The unemployment rate fell 30 basis points to 3.9% in December, while weekly claims for unemployment ticked up to 260,000 for the week of January 22nd. The labor force participation rate stayed flat MoM at 61.9%, which is 1.5 percentage points below its pre-pandemic level.
Production and Sales
US Retail and Food Services Sales had its worst monthly decline since February 2021, falling 1.9% in December. The US ISM Manufacturing PMI continued its downward trend in December, falling 1.2 points to 57.6, it’s weakest reading since November 2020, though anything above 50 indicates expansion in the manufacturing sector.
Housing
The US housing market saw a record month of activity. Following a November in which US New Single Family Houses Sold grew 11.7% MoM, that figure was 11.9% in December. At the same time, Existing Home Months’ Supply fell to 1.8, its lowest reading on record. The strong housing activity caused the US Existing Home Average Sales Price to remain near its high at $372,200 as of December’s end.
Consumers and Inflation
December’s year-over-year US Inflation print came in at 7.0%, while the YoY US Core Inflation Rate was 5.5%. This resulted in the US Consumer Price Index rising 0.5% MoM. Prices outpaced spending on a MoM basis for the third straight month, as consumer spending (PCE) increased just 0.4%.
Gold
The price of Gold in USD was $1,788.20 per ounce at January’s end. The SPDR Gold Shares ETF (GLD) slipped 1.5% in January, while the VanEck Gold Miners ETF (GDX) fell 5.6%.
Oil
Oil prices reached 7-year highs last month. The WTI Daily Spot Price was $89.16 per barrel as of January 31st, and the Brent Daily Spot Price sat at $92.35.
Cryptocurrencies
The price of Bitcoin was $37,983 as of January 31st, down 19.5% in the month and off 43.0% from its all time high. Ethereum stood at $2,610, representing a 44.2% retracement, and Cardano ended the month at $1.04.
Have a great February! 📈
If you haven’t yet, subscribe to the YCharts Monthly Market Wrap here: