Monthly Market Wrap: January 2023
Welcome back to the Monthly Market Wrap from YCharts, where we break down the most important market trends for advisors and their clients every month. As always, feel free to download and share any visuals with clients and colleagues, or on social media.
Speaking of visuals: check out our new Monthly Market Wrap slide deck, containing all charts featured in the Market Wrap + more.
January 2023 Market Summary
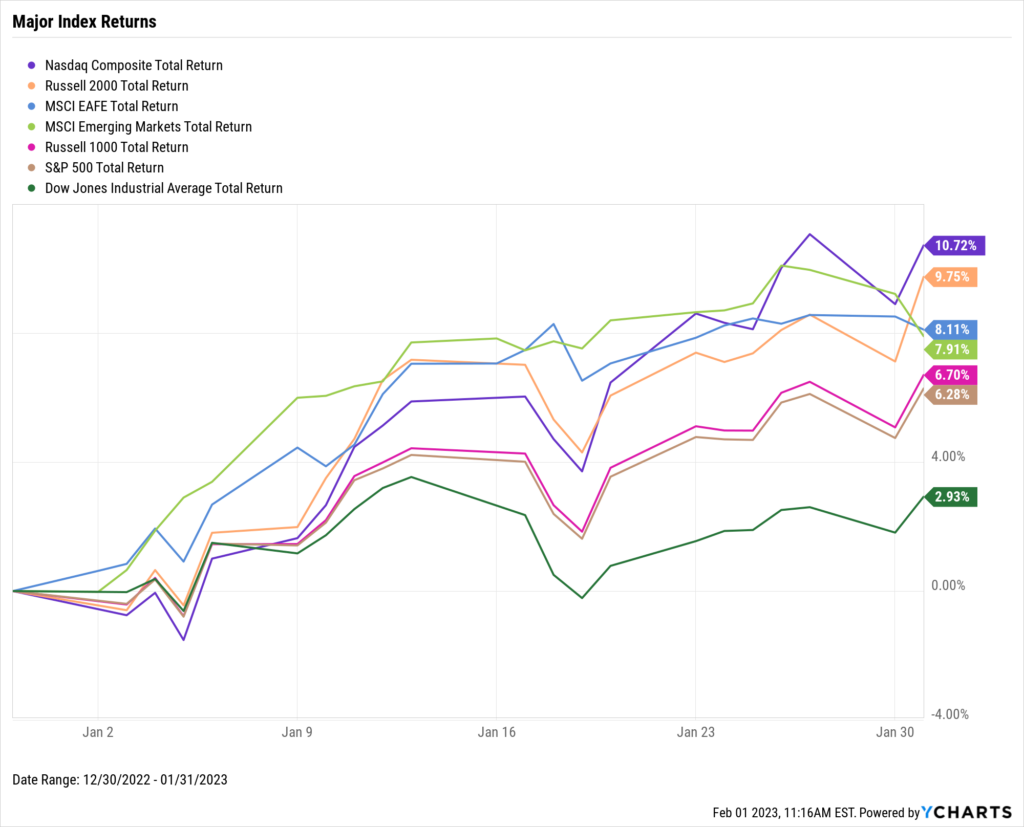
Stocks started the year off strong with the NASDAQ leading the way for US equities. After a largely sour 2022 for the growth-heavy index, it soared 10.7% higher in January, while the small-cap Russell 2000 also jumped 9.8%. The widely-tracked S&P 500 advanced 6.3%, though January was relatively underwhelming for blue chips, as the Dow Jones Industrial Average rose 2.9%. Nonetheless, equities were off to the races across the board (and world) in January.
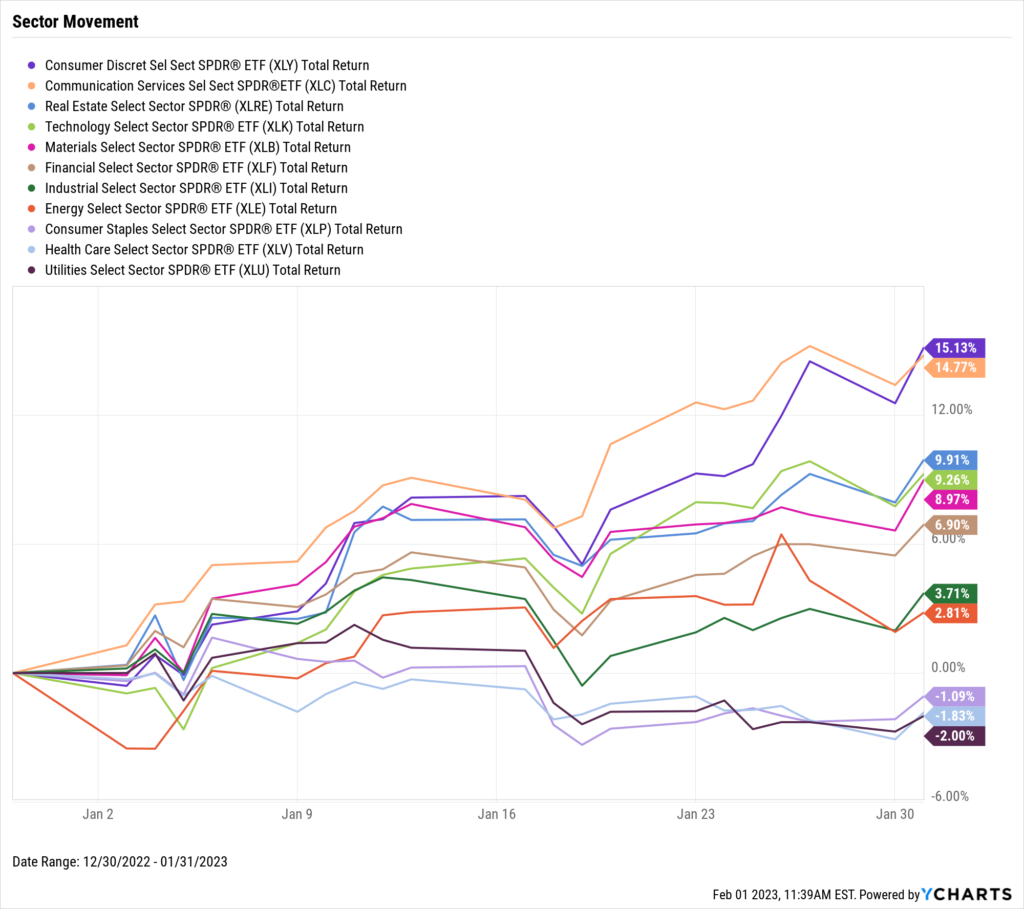
Eight of the 11 S&P 500 sectors were higher in January. After an 11.4% decline in December, the Consumer Discretionary sector went from worst to first in January, logging a 15.1% gain. Communication Services was not far behind with a 14.8% increase. At the bottom of the list were the less economically-sensitive sectors of Consumer Staples, Health Care, and Utilities, as investors largely went risk-on.
Inflation slowed for the sixth straight month to 6.45% YoY, and core inflation fell a quarter of a percentage point as well. The gap between new and existing home sales widened—US New Single-Family Home Sales MoM grew for the third straight month, but Existing Home Sales contracted 1.5%, marking its 11th consecutive monthly fall. The median national existing home price also declined 1.5%. In the world of crypto, Bitcoin and Ethereum each soared well over 30% last month, marking quite a turnaround from last year when both cryptocurrencies plummeted around 65%.
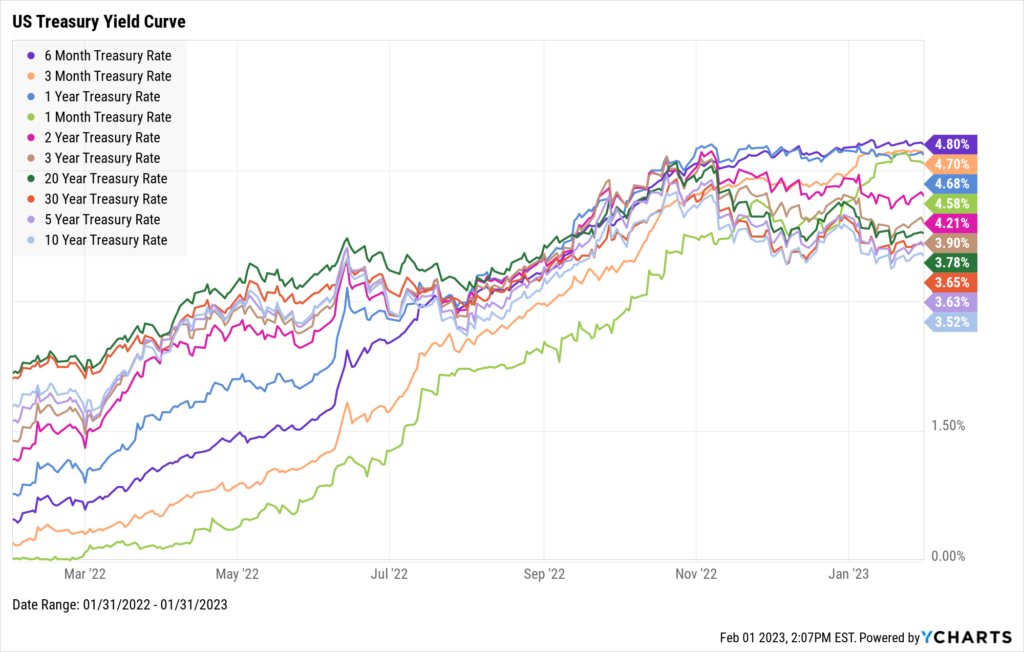
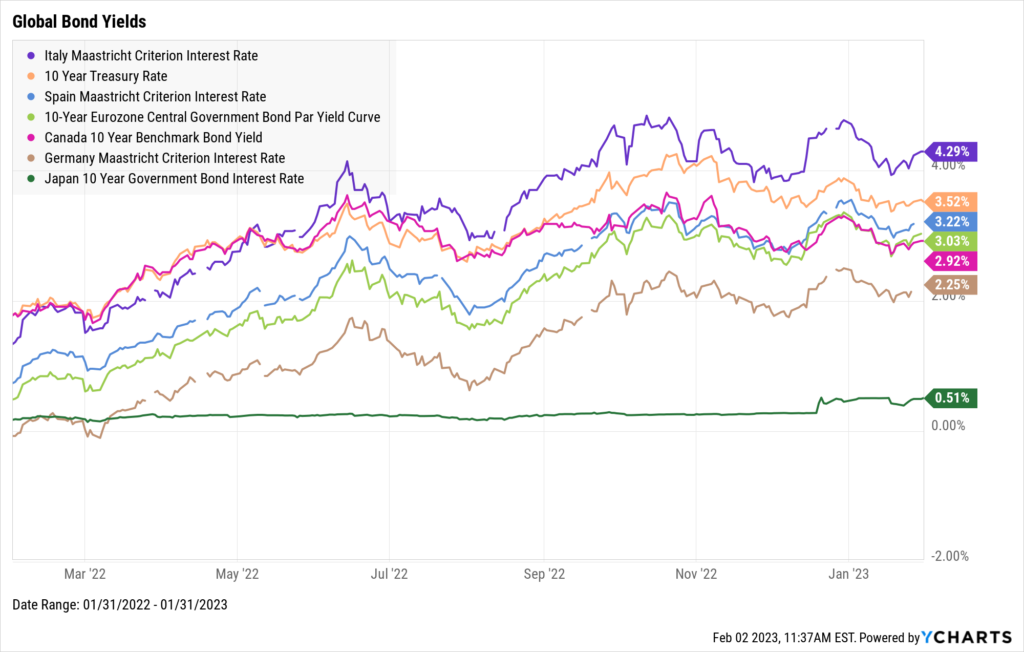
Yields on longer-term treasuries fell while those with short-term maturities rose. The 5-Year, 10-Year, and 20-Year rates all declined by 36 basis points. On the flip side, yields on the 1-Month, 3-Month, and 6-Month Treasury Bills increased in January. The 1-Month saw the largest increase across the yield curve, at 46 basis points. Globally, Japan’s 10 Year Government Bond Interest Rate increased by six basis points.
Jump to Fixed Income Performance
Want access to full-year charts and data as well? Download our Monthly Market Wrap Slide Deck for more:Off the YCharts! Starting the Year Off Right
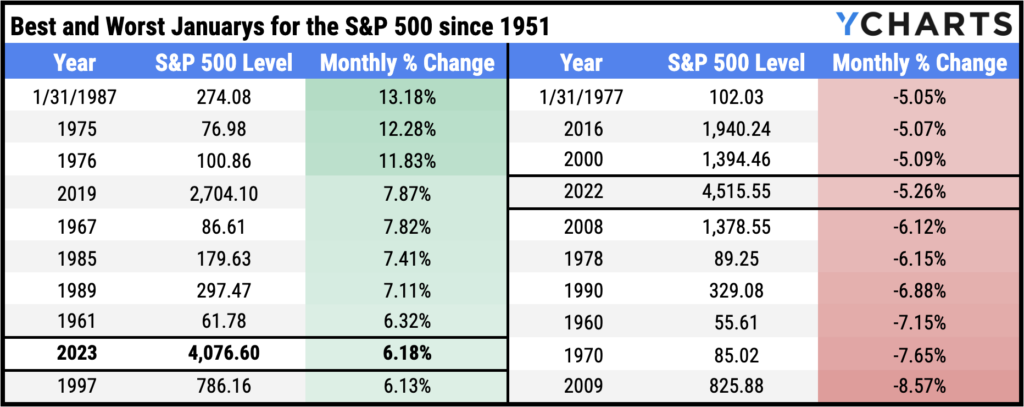
January was certainly a solid start for stocks, regardless of their shapes and sizes. The month was so good, in fact, that January 2023 has made the S&P 500’s All-Time Top10 highlight reel.
Looking at S&P 500 monthly returns since 1951, January 2023 stands as the ninth-best start to any year. It’s quite the rebound from last year, considering 2022 produced the seventh-worst January in the last 70+ years.
Download Visual | Modify Data in Timeseries Analysis
Equity Performance
Major Indexes
Download Visual | Modify in YCharts | View Below Table in YCharts
Value vs. Growth Performance, Trailing Twelve Months
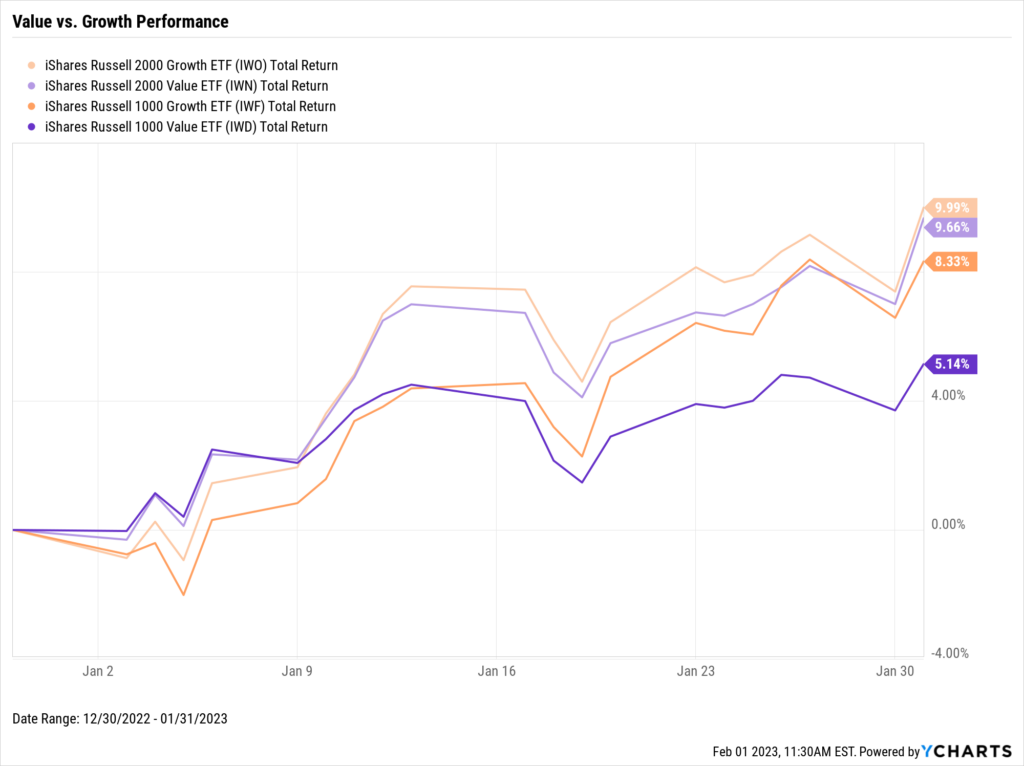
Small-cap value and growth stocks, represented by the iShares Russell 2000 Value (IWN) and Growth (IWO) ETFs, each surged nearly 10% in January. Large-cap Growth (IWF) was not far behind with an 8.3% pop, and Large-cap Value (IWD) also managed to finish 5.1% higher.
Zooming out, January was a big help to stocks as lookback returns became a lot less negative. Both Large and Small-cap value stocks ended the month within 1% of being back to even on a TTM basis. Large-cap growth exited bear market territory, and Small-cap Growth is now just -6.3% in the last 12 months, as of January 31st.
Download Visual | Modify in YCharts
US Sector Movement
Download Visual | Modify in YCharts | View Below Table in YCharts
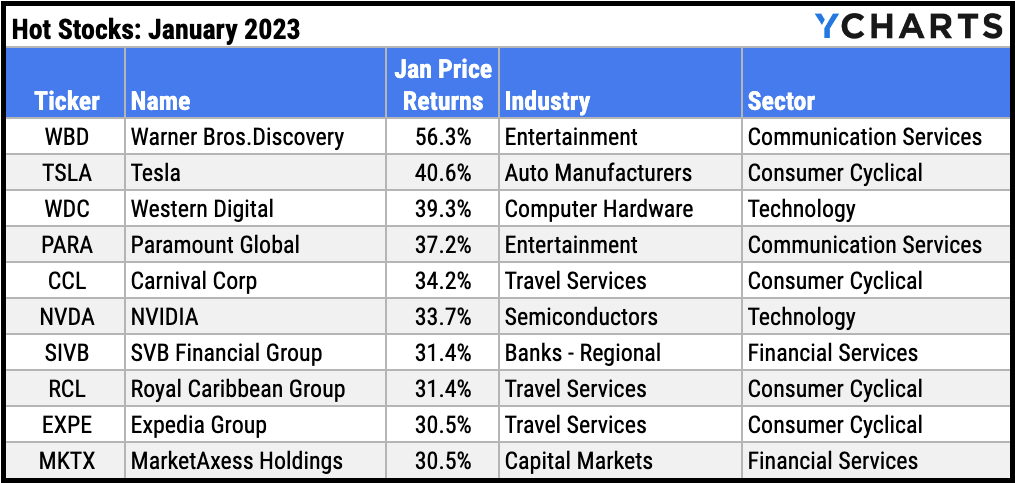
Hot Stocks: Top 10 S&P 500 Performers of January 2023
Warner Bros.Discovery (WBD): 56.3% gain in January
Tesla (TSLA): 40.6%
Western Digital (WDC): 39.3%
Paramount Global (PARA): 37.2%
Carnival Corp (CCL): 34.2%
NVIDIA (NVDA): 33.7%
SVB Financial Group (SIVB): 31.4%
Royal Caribbean Group (RCL): 31.4%
Expedia Group (EXPE): 30.5%
MarketAxess Holdings (MKTX): 30.5%
Download Visual | Modify in YCharts
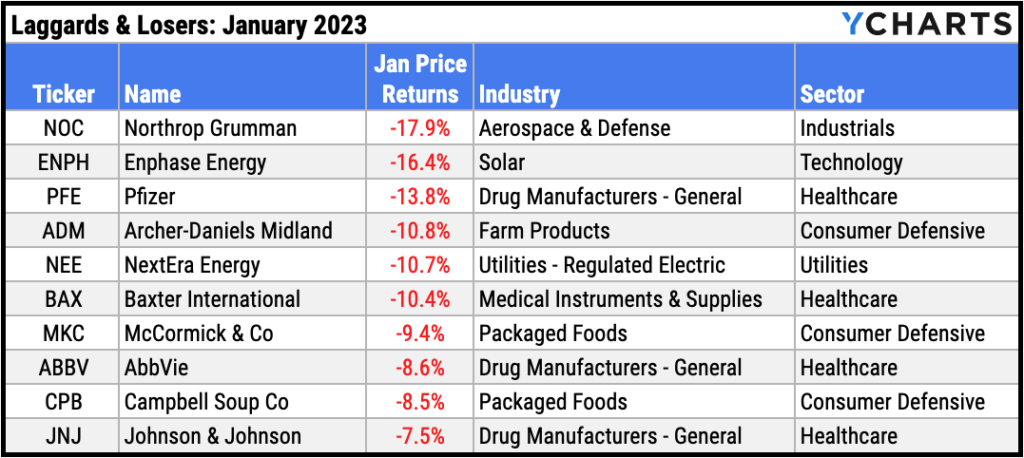
Laggards & Losers: 10 Worst S&P 500 Performers of January 2023
Northrop Grumman (NOC): -17.9% decline in January
Enphase Energy (ENPH): -16.4%
Pfizer (PFE): -13.8%
Archer-Daniels Midland (ADM): -10.8%
NextEra Energy (NEE): -10.7%
Baxter International (BAX): -10.4%
McCormick & Co (MKC): -9.4%
AbbVie (ABBV): -8.6%
Campbell Soup Co (CPB): -8.5%
Johnson & Johnson (JNJ): -7.5%
Download Visual | Modify in YCharts
Featured Market & Advisor News
Housing Market Cools With Prices Down 2.5% From June Peak (FA-Mag)
2022 Fund Flows: Investor Moves Confirm Recession Worries (YCharts)
More advisors are jumping on the bitcoin bandwagon (InvestmentNews)
Are Advisors Communicating Enough with Their Clients? (YCharts)
Bond Market’s Reset Breathes Life Into Battered 60/40 Funds (WealthManagement.com)
Is the Housing Market Going to Crash? (YCharts)
Economic Data
Employment
December’s unemployment rate fell back to a pre-pandemic low of 3.5%. The labor force participation rate notched up 0.1 percentage points to 62.3%, though labor force participation is still 1.1 points below its February 2020 high. 223,000 jobs were added in the final month of 2022, topping nonfarm payroll expectations of 200,000 and bringing the aggregate total jobs created in 2022 to 4.5 million.
Consumers and Inflation
US Inflation cooled down for the sixth straight month, falling 0.66 percentage points to 6.45%. YoY US Core Inflation dipped a quarter of a percentage point to 5.71%. The MoM US Consumer Price Index slipped 0.1%, and MoM US Personal Spending contracted 0.2%. Lastly, the Federal Reserve raised the Upper Limit Target Federal Funds Rate by 25 points to 4.75% at its February 1st meeting, the first rate hike of just 25 bps since March 2022.
Production and Sales
The US ISM Manufacturing PMI fell deeper into contraction territory in January. At 47.4, January’s reading marks the eighth consecutive monthly decline for the indicator, and also its lowest reading since May 2020. MoM US Retail and Food Services Sales declined 1.2% MoM in December, though the US Retail Trade Inventory/Sales Ratio rose slightly to 1.24 as of November 2022.
Housing
MoM US New Single-Family Home Sales increased 2.3% in December, three months removed from a plummet of nearly 15%. Existing housing data wasn’t as cheerful, however—MoM US Existing Home Sales declined 1.5% in December, marking the 11th consecutive monthly decline for existing home sales. Slower sales once again translated into lower home prices; the Median Sales Price of Existing Homes also declined by 1.5% to $366,900, falling for a sixth straight month. On a brighter note, 15-Year and 30-Year Mortgage Rates continued to fall from their November ‘22 highs, down to 5.17% and 6.13% respectively.
Commodities
Gold started the year strong with a 6.0% gain in January, bringing its price to $1,923.10 per ounce as of January 27th. Oil price movement was mixed in January—the price of WTI per barrel declined 2.7% to $77.97 while Brent increased 2.2% to $84.61. Nonetheless, prices for both WTI and Brent are more than 36% lower than their highs set in March of last year. Trips to the pump did get more expensive in January, as the average price of regular gas rose 39 cents (12.2% MoM) to $3.59 per gallon.
Cryptocurrencies
As we pointed out in our recent Economic Update Webinar covering Q4 2022, Bitcoin and Ethereum each tumbled around 65% last year. However, Bitcoin surged 37.2% in January and Ethereum jumped 30.6%. Is this a signal that the worst is over for crypto, or just another hill on the crypto-coaster?
Fixed Income
US Treasury Yield Curve
1 Month Treasury Rate: 4.58%
3 Month Treasury Rate: 4.70%
6 Month Treasury Rate: 4.80%
1 Year Treasury Rate: 4.68%
2 Year Treasury Rate: 4.21%
3 Year Treasury Rate: 3.90%
5 Year Treasury Rate: 3.63%
10 Year Treasury Rate: 3.52%
20 Year Treasury Rate: 3.78%
30 Year Treasury Rate: 3.65%
Download Visual | Modify in YCharts
Global Bonds
Italy Long Term Bond Interest Rate: 4.29%
10 Year Treasury Rate: 3.52%
Spain Long Term Bond Interest Rate: 3.22%
10-Year Eurozone Central Government Bond Par Yield: 3.03%
Canada 10 Year Benchmark Bond Yield: 2.92%
Germany Long Term Bond Interest Rate: 2.25%
Japan 10 Year Government Bond Interest Rate: 0.51%
Download Visual | Modify in YCharts
Have a great February! 📈
Get the Monthly Market Wrap slide deck sent straight to your inbox. Download Here:Next Article
2022 Fund Flows: Investor Moves Confirm Recession WorriesRead More →