Monthly Market Wrap: May 2022
Welcome back to the Monthly Market Wrap from YCharts, where we review and break down the most important market trends for advisors and their clients every month. As always, feel free to download and share any visuals with clients and colleagues, or on social media.
Want the Monthly Market Wrap sent straight to your inbox? Subscribe below:
Are you based in Canada or following Canadian markets? Check out and subscribe to the Monthly Canada Market Wrap from YCharts.
May 2022 Market Summary
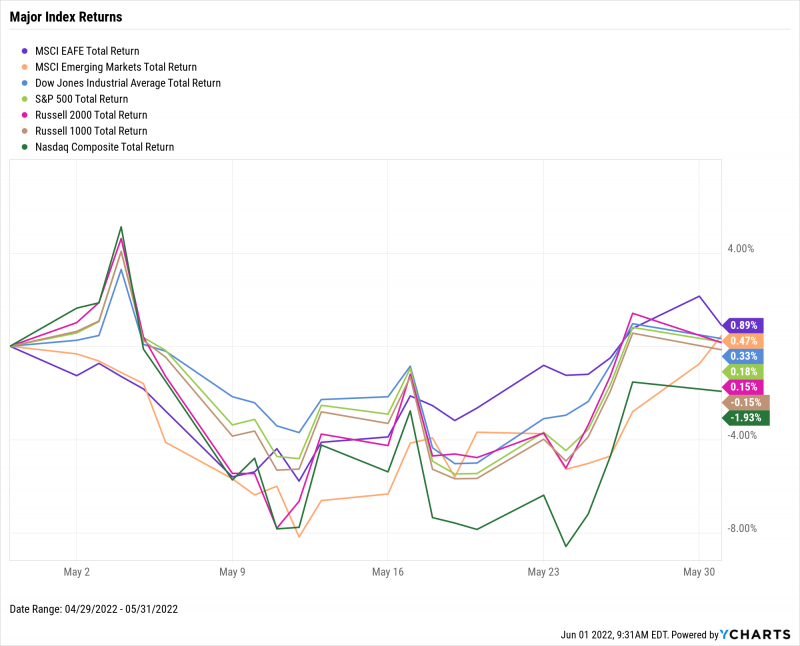
US equities ended May about flat, tumbling early in the month but making up that lost ground later on. The S&P 500 eked out a monthly gain of 0.2% after being down as much as 5.5%, while the Dow Jones Industrial Average edged up 0.3%. Both the Russell 1000 and Russell 2000 finished the month right around the unchanged mark. Though the NASDAQ ended up 1.9% lower, the growth-heavy index bounced back from an 8.6% decline early on in May. Year to date, the Dow is down 8.4%, the S&P 500 is 12.8% lower, and the NASDAQ continues residing in bear market territory, down 22.5%.
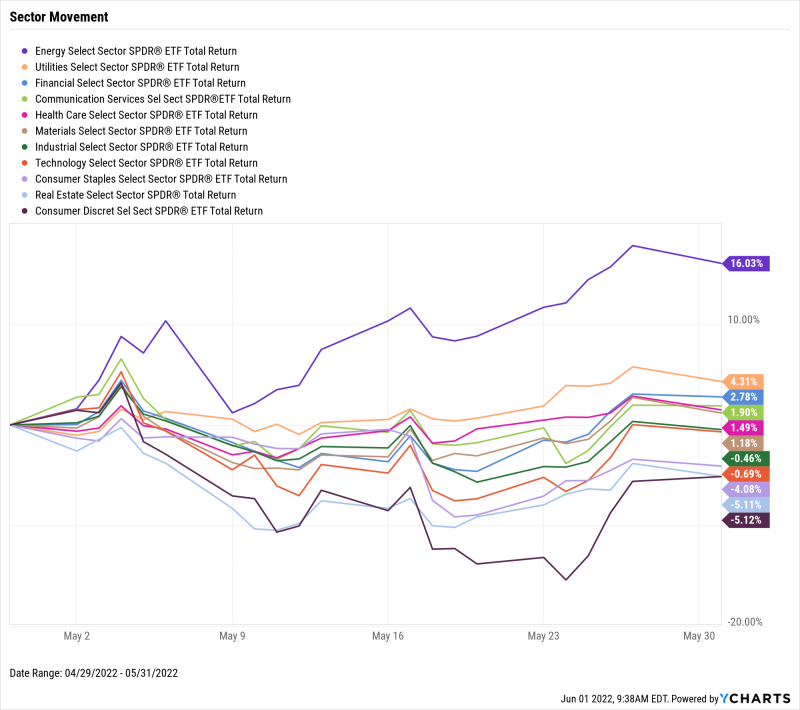
Energy was the biggest winner in May, closing the month 16% higher while the other ten sectors were evenly split between positive and negative. Utilities rose 4.3%, the most of any other sector, while Consumer Discretionary’s 5.1% decline lagged all others, marking another contrast in recent performance between defensive and cyclical sectors.
Believe it or not, the inflation rate declined for the first time in seven months, down to 8.26% per April data. However, some areas of the economy, and notably the real estate sector, couldn’t ignore the fact that inflation remains at 40-year highs. Sales for new single-family homes plunged 16.6%, and existing home sales were down for the third straight month as well. May 2022 also set a new high for pain felt at the pump, with US Retail Gas Prices reaching a record $4.73 per gallon.
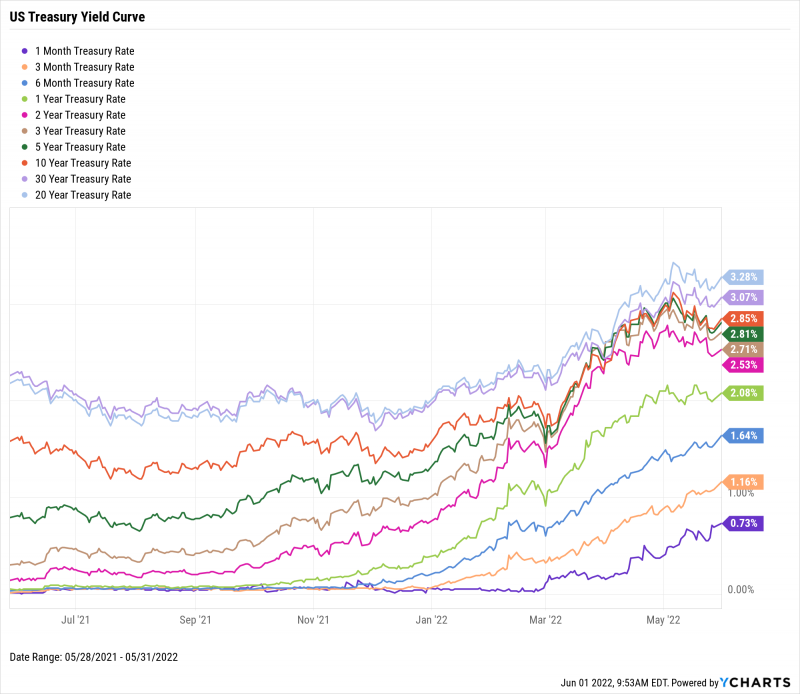
Short and long-term interest rates increased significantly in May, but yields on all medium-term treasury notes declined. The rate on 1-Month T-Bills nearly doubled over the course of the month to 0.73%, while the 3-Month T-Bill rate surpassed 1% for the first time in over two years, closing out May at 1.16%. Accelerated rate hikes by the Federal Reserve have been the primary driver of short-term interest rates. 20-Year and 30-Year Bonds were both above 3% at May’s end, yielding 3.28% and 3.07% respectively. With the exception of those 30-Year and 20-Year rates, the yield curve became more normalized in May.
Jump to Fixed Income Performance
Off the YCharts! How Hungry Is the Bear?
It’s no secret that the world is pretty crazy right now.
Inflation is at a 40-year high, road trips to see grandma have never been more expensive, and the NASDAQ is in bear market territory, to name a few noteworthy events. For a lot of investors, the NASDAQ’s 20% fall from its all-time high is especially concerning because it’s the second such decline in as many years.
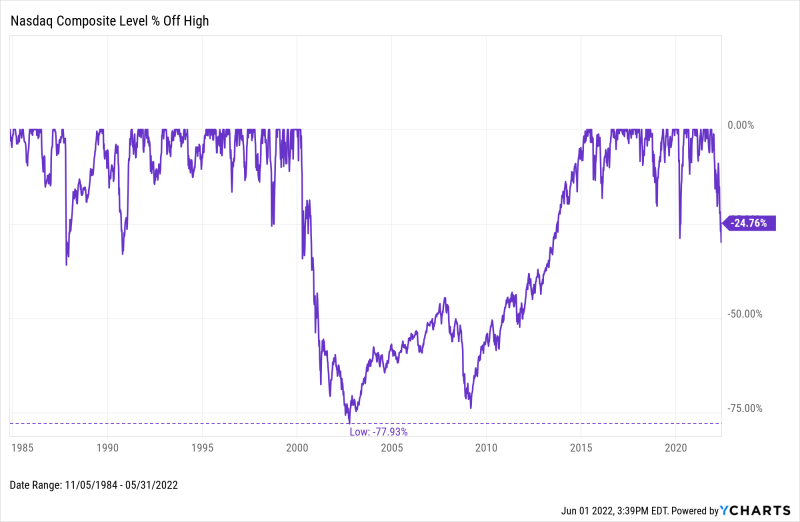
But how severe is the current NASDAQ drawdown, historically speaking? Toward the end of May, the NASDAQ Composite Index was down by as much as 29.9% from its all-time high set on November 19th, 2021. For comparison, there are four other NASDAQ drawdowns on record which were equally or more severe than the one incurred last month.
Today, it feels like every high-flying NASDAQ name is down 70% or more, making this current bear an especially hungry one. But, excluding the Dot-Com Bubble and the ‘08 Financial Crisis, the NASDAQ’s four next largest drawdowns have been right around the 30% mark, matching how far the index has sunk in 2022.
Is this an indication the bear might be getting ready for hibernation?
Download Visual | Modify in YCharts
Equity Performance
Major US Indexes
Download Visual | Modify in YCharts
Value vs. Growth Performance, Trailing Twelve Months
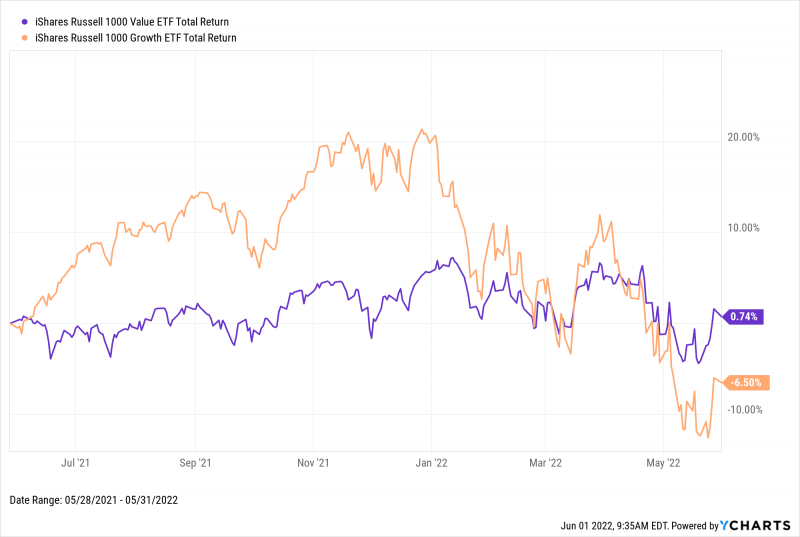
If you bought into the iShares Russell 1000 Value ETF (IWD) one year ago, that investment would be barely positive as of May 31st, 2022. However, relative to its counterpart at month’s end, Value has outperformed Growth (IWF) by 7.2 percentage points over the last twelve months. Year-to-date, Value is down 4.6%, and Growth is 22% lower, thanks in part to an additional 2.3% decline in May.
Download Visual | Modify in YCharts
US Sector Movement
Download Visual | Modify in YCharts
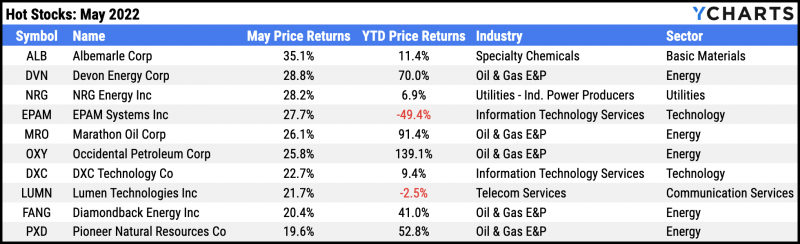
Hot Stocks: Top 10 S&P 500 Performers of May 2022
Albemarle (ALB): 35.1% gain in May
Devon Energy (DVN): 28.8%
NRG Energy (NRG): 28.2%
EPAM Systems (EPAM): 27.7%
Marathon Oil (MRO): 26.1%
Occidental Petroleum (OXY): 25.8%
DXC Technology (DXC): 22.7%
Lumen Technologies (LUMN): 21.7%
Diamondback Energy (FANG): 20.4%
Pioneer Natural Resources (PXD): 19.6%
Download Visual | Modify in YCharts
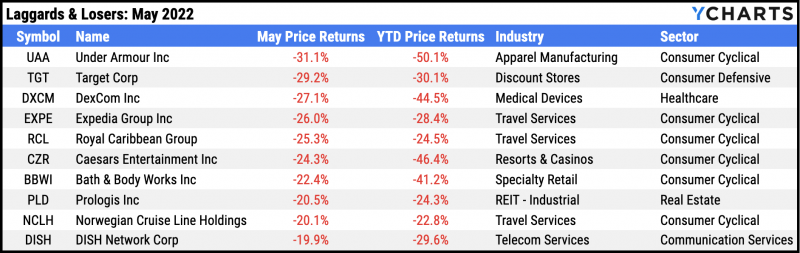
Laggards & Losers: 10 Worst S&P 500 Performers of May 2022
Under Armour (UAA): -31.1% decline in May
Target (TGT): -29.2%
DexCom (DXCM): -27.1%
Expedia (EXPE): -26.0%
Royal Caribbean (RCL): -25.3%
Caesars Entertainment (CZR): -24.3%
Bath & Body Works (BBWI): -22.4%
Prologis (PLD): -20.5%
Norwegian Cruise Line Holdings (NCLH): -20.1%
DISH Network (DISH): -19.9%
Download Visual | Modify in YCharts
Economic Data
Employment
The unemployment rate remained unchanged in April at 3.6%, but the labor force participation rate declined by 0.2% to 62.2%. Despite US unemployment falling back to its pre-pandemic lows, labor force participation has yet to recover in the same way, sitting 1.2 percentage points below its February 2020 level. 210,000 initial jobless claims were filed during the week of May 21st, a notable increase from the 53-year low of 168,000 recorded in the first week of April.
Production and Sales
US Retail and Food Services Sales managed to grow 0.9% in April despite increased cost pressures on the sector. The US ISM Manufacturing PMI also rose 0.7 points to a reading of 56.1 for May, keeping it firmly in the “expansion” range of 50 or greater.
Housing
Following a double-digit decline in March, the number of New US Single-Family Houses Sold tumbled another 16.6% in April. This marked the fourth straight monthly decline in new home sales as well as the largest single-month decline since July 2013. Signs of weakening demand showed through elsewhere as well—Existing Home Sales slipped 2.4% in April and Existing Home Months’ Supply rose 0.3 points to 2.2. However, the US Existing Home Average Sales Price reached another all-time high in April of $397,600, marking the third consecutive monthly increase.
Consumers and Inflation
Inflation…declined in April? That’s right, after rising seven straight months to levels not seen in 40 years, the US Inflation Rate and US Core Inflation Rate each fell by 0.3% to 8.26% and 6.16%, respectively. The US Consumer Price Index rose just 0.3% in April, a considerable change from last month’s 1.2% increase. Consumer spending (PCE) also increased 0.2% in April.
Gold
The price of Gold in USD fell for the second straight month to $1,851.30 per ounce. Following a losing April for both the SPDR Gold Shares ETF (GLD) and VanEck Gold Miners ETF (GDX), May brought additional losses to the gold-focused ETFs, of 3.3% and 9.3% respectively. The outflows from gold and gold miners came as the US Dollar strengthened, despite inflation’s weakening of the dollar’s purchasing power.
Oil
Oil continued climbing in May, with the per-barrel daily spot prices of WTI and Brent rising to $110.32 and $115.13 respectively. The surges in oil costs sent US gas prices to all-time highs, $4.73 per gallon of regular gas and $5.40 per gallon of premium. Ouch.
Cryptocurrencies
Major cryptocurrencies suffered another month of significantly lower price action in May. One Bitcoin was worth $31,741 as of May 31st, a decline of 20.1% which followed a 17.9% drop in the month of April. Ethereum fell below $2,000 for the first time in ten months, to $1,996 at the end of May, while Cardano tumbled another 32.3% in May to 57 cents per coin. Year to date, Bitcoin is down 32.7%, Ethereum is off 46.3%, and Cardano is 58% lower.
Featured Market & Advisor News
Americans’ Savings Rate Drops To Lowest Since 2008 As Inflation Bites (FA-Mag)
Inverted Yield Curve: What It Means and How to Navigate It (YCharts)
Mass outflows hit every asset class as recession fears climb (InvestmentNews)
Do You Know Your Exposure To Mega Cap Stocks? (YCharts)
JPMorgan Plans to Hire 1,300 More Advisors Over Next Three Years (WealthManagement.com)
Is the 60/40 Portfolio Drowning? (YCharts)
Fixed Income Performance
US Treasury Yield Curve
1 Month Treasury Rate: 0.73%
3 Month Treasury Rate: 1.16%
6 Month Treasury Rate: 1.64%
1 Year Treasury Rate: 2.08%
2 Year Treasury Rate: 2.53%
3 Year Treasury Rate: 2.71%
5 Year Treasury Rate: 2.81%
10 Year Treasury Rate: 2.85%
20 Year Treasury Rate: 3.28%
30 Year Treasury Rate: 3.07%
Download Visual | Modify in YCharts
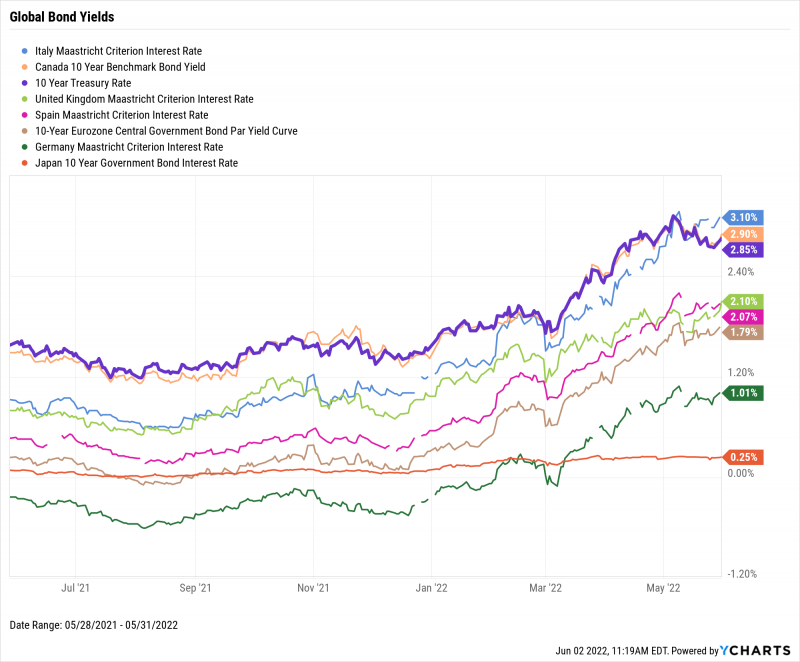
Global Bonds
Italy Long Term Bond Interest Rate: 3.10%
Canada 10 Year Benchmark Bond Yield: 2.90%
10 Year Treasury Rate: 2.85%
United Kingdom Long Term Bond Interest Rate: 2.10%
Spain Long Term Bond Interest Rate: 2.07%
10-Year Eurozone Central Government Bond Par Yield: 1.79%
Germany Long Term Bond Interest Rate: 1.01%
Japan 10 Year Government Bond Interest Rate: 0.25%
Download Visual | Modify in YCharts
Have a great June! 📈
If you haven’t yet, subscribe to the YCharts Monthly Market Wrap here: