New on YCharts: Client-Friendly Data Table PDFs
YCharts users have a new way to share their investment insights with clients! Data views built in Comp Tables—a tool that creates clean, formatted data tables using securities, metrics, and custom scores of your choosing—are now exportable as client and printer-friendly PDFs.
Whether comparing securities, evaluating your firm’s model portfolios, or auditing a holdings list, these new communication outputs also include dynamically-built disclosures to elevate your conversations with clients and colleagues alike.
Take a peak at several example outputs here, and read on below for ideas on how you can leverage the new Comp Table PDFs.
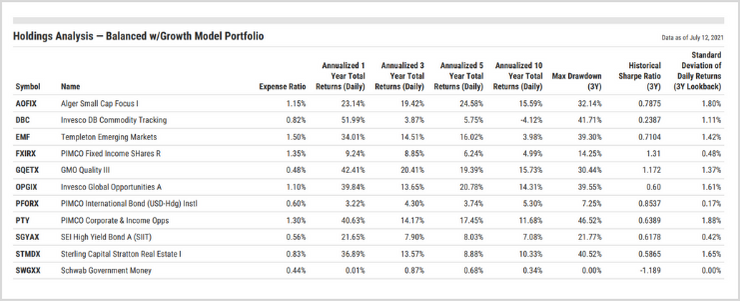
Portfolio Holdings – Performance & Risk Metrics
Model Portfolio Evaluation – Annualized Performance
Stock Comparison – Valuation Ratios & Custom Score
To create a PDF from Comp Tables, simply click the “Export” button then select “Download PDF” from the dropdown. The maximum number of columns per PDF is eight.
Click to open YCharts Comp Tables
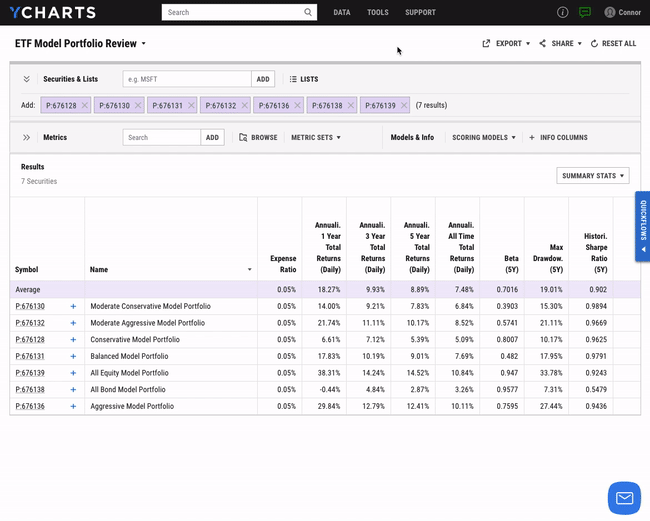
Review a Client’s Holdings in a Meeting
Create a conversation-starter for your next client meeting by assembling a rundown of all their portfolio holdings.
Presenting performance and risk metrics alongside other key information, such as fund expense ratios, sets the stage for any recommendations and gets clients thinking critically about their portfolio composition. Disclosures are automatically added to the report based on the data and securities included, helping you answer any questions with just the turn of a page.
If your portfolios are loaded into YCharts, simply click “Lists” then “My Lists” in the Security Browser Menu, and select “Model Portfolio Holdings” to quickly call up holdings for any portfolio or strategy.
Download Visual | Click to view in YCharts
Evaluate Your Model Portfolio Offerings
For better and more productive conversations during investment committee meetings, share a PDF reviewing your models’ performance with all attendees.
A table with all your model offerings plus historic performance and risk metrics is a simple but effective way to align the group around strategic priorities and points of concern.
ALSO NEW: Evaluate Portfolios with Custom Time Period Columns
Have better and more productive conversations during client meetings by sharing real, tangible insights. Add your various model portfolios to Comp Tables, then create custom period columns for important timeframes, such as the 2008 financial crisis, the historic 11-year bull market that followed, and the 2020 covid-19 pandemic recession.
Share a PDF of the analysis with your clients to reveal performance and risk insights from market troughs to peaks, and vice versa. These comparisons are more relatable to investors, and are also great conversation starters. Plus, it’s a simple but effective way to show the benefits of diversification. In Comp Tables, click “Custom Period” in the Metrics menu to create a timeframe-based performance column.
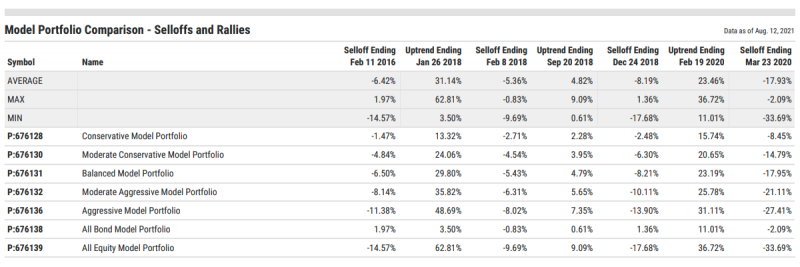
View a sample PDF | Click to view in YCharts
Compare Stocks Using Ratios & a Custom Score
Build a comparison table for a group of stocks (or funds) using the factors that are most important to your investment selection. Custom Scoring Models, another YCharts feature integrated with Comp Tables, can be added to clearly communicate your top choices from a peer set.
The example below uses popular valuation metrics and a custom PE/Growth Score, in the rightmost column, to compare the 30 constituents of the Dow Jones Industrial Average. Historical returns data is also included on subsequent pages by way of dynamic disclosures, which automatically update based on the components of your data table.
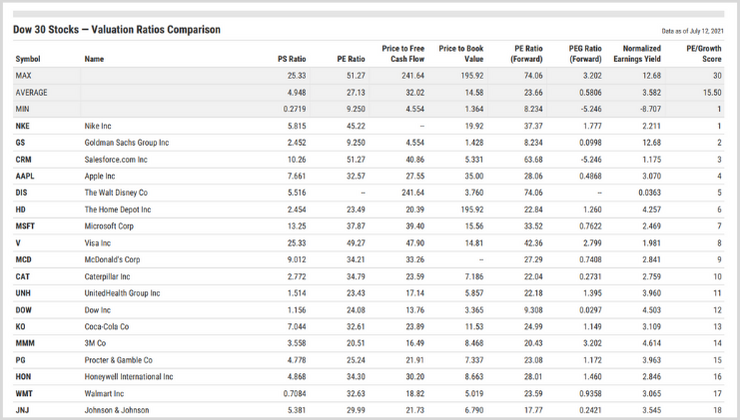
Download Visual | Click to view in YCharts
Elevate Your Client Communication and Presentations
Effectively communicating your investment insights is arguably even more important than arriving at those insights in the first place.
Comp Tables PDFs, along with Fundamental Charts, FINRA-reviewed Portfolio Reports, and Custom PDF Reports enable advisors to expertly share their strategies with clients and prospects, leading to better outcomes and stronger relationships.
Connect With YCharts
To get in touch, contact YCharts via email at hello@ycharts.com or by phone at (866) 965-7552
Interested in adding YCharts to your technology stack? Sign up for a 7-Day Free Trial.
Disclaimer
©2021 YCharts, Inc. All Rights Reserved. YCharts, Inc. (“YCharts”) is not registered with the U.S. Securities and Exchange Commission (or with the securities regulatory authority or body of any state or any other jurisdiction) as an investment adviser, broker-dealer or in any other capacity, and does not purport to provide investment advice or make investment recommendations. This report has been generated through application of the analytical tools and data provided through ycharts.com and is intended solely to assist you or your investment or other adviser(s) in conducting investment research. You should not construe this report as an offer to buy or sell, as a solicitation of an offer to buy or sell, or as a recommendation to buy, sell, hold or trade, any security or other financial instrument. For further information regarding your use of this report, please go to: ycharts.com/about/disclosure
Next Article
New on YCharts: FINRA Reviewed Portfolio ReportsRead More →