
S&P 500 Target Date Indices Are Now on YCharts
Interested in testing out YCharts for free?
Start 7-Day Free TrialTarget date funds now hold more than $4.8 trillion, and in most 401(k) plans, they’re where participants’ money goes by default. That makes the Qualified Default Investment Alternative (QDIA) decision one of the most consequential choices a plan committee makes.
So when you’re across the table from a plan advisor or committee chair, you’ll eventually hear some version of: “How do we know your glide path is the right one for our participants?”
You know there’s no single right answer. A glide path is the schedule a target date fund follows to shift from stocks to bonds as participants approach retirement. And every provider designs its own.
The result: in the year a target-date fund (TDF) reaches its target retirement date, the average TDF holds about 44% in stocks, but funds range from just under 30% to just over 50%, according to the Investment Company Institute.
Your colleagues in other channels already know how to handle moments like this.
From externals to model portfolio teams, they pull out the iPad, punch in an index or a competitor’s ticker, and show the advisor exactly how their strategy solves the problem right there in the meeting.
Now, DCIO and retirement teams can make the same move.
The S&P Target Date Index Series is now live in YCharts. Each vintage reflects the consensus asset allocation of the target date marketplace, so it shows what the typical glide path actually delivered.
Put every vintage of your series next to its matching index in seconds, and give the committee a clear answer on how your lineup stacks up.
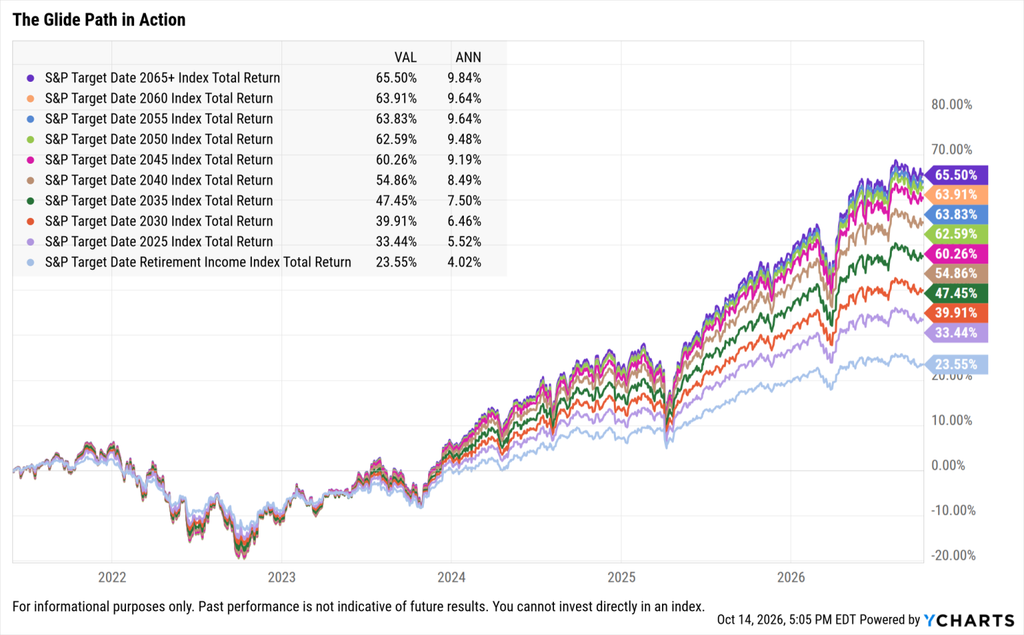
Table of Contents
Three Ways to Use the S&P Target Date Indices
1. Benchmark Each Vintage:
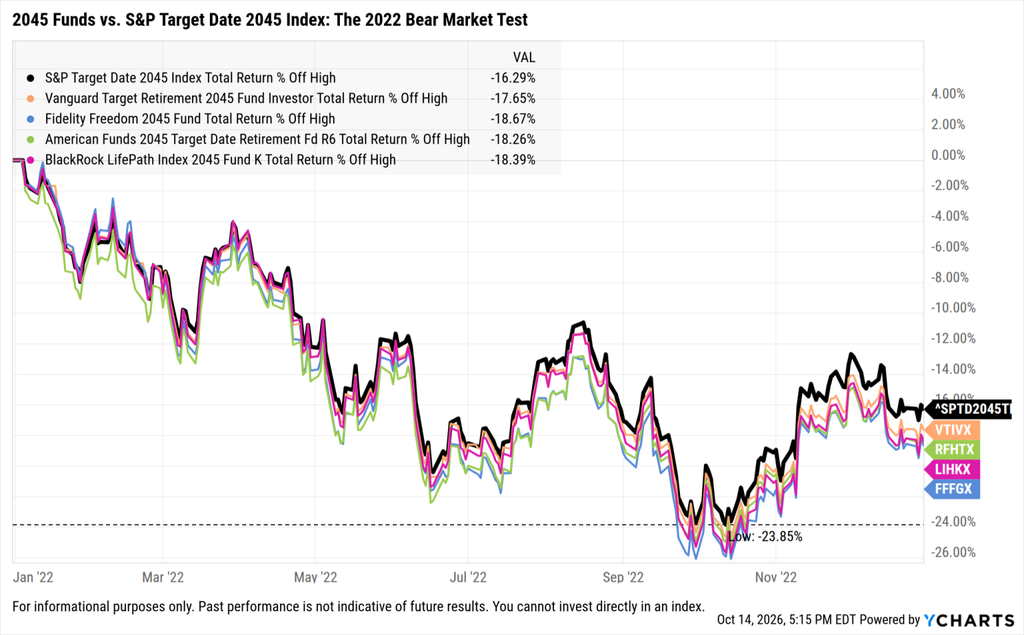
Chart your 2030, 2045, or 2060 fund against its matching S&P vintage in the same time series.
Because target date funds are the default investment for most 401(k) participants, they face more fiduciary scrutiny than anything else on the menu. Any committee reviewing its QDIA will want to see how the series performed against a market-consensus benchmark.
2. Show the full cycle:
We know a point-in-time performance chart alone won’t win you a 401(k) or 403(b) menu placement. That’s why YCharts lets you layer in macroeconomic indicators, rolling returns, and drawdowns, so the committee sees the relationship across a full market cycle.
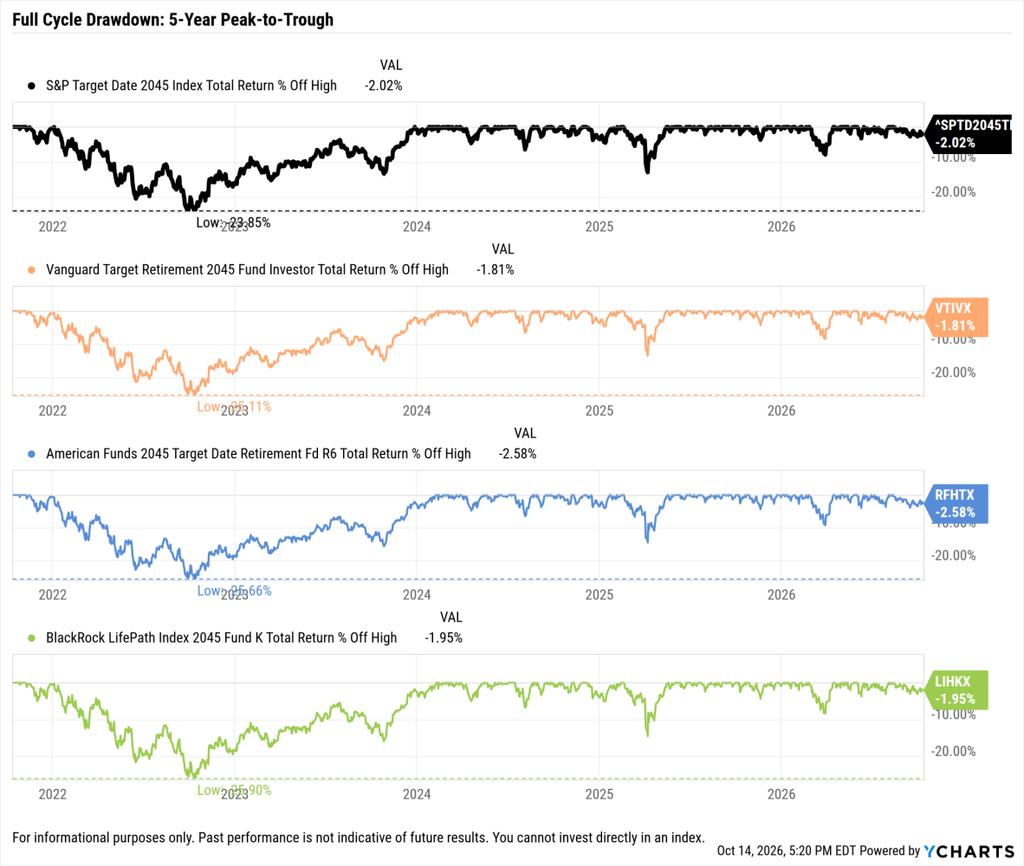
Plan consultants care about more than return.
3. Compare risk, not just return:
Use scatter plots and risk metrics to position each vintage relative to the index using standard deviation, Sharpe ratio, maximum drawdown, and more.
It’s never been easier to show a committee how your glide path’s ride compares to the benchmark for participants nearing retirement.
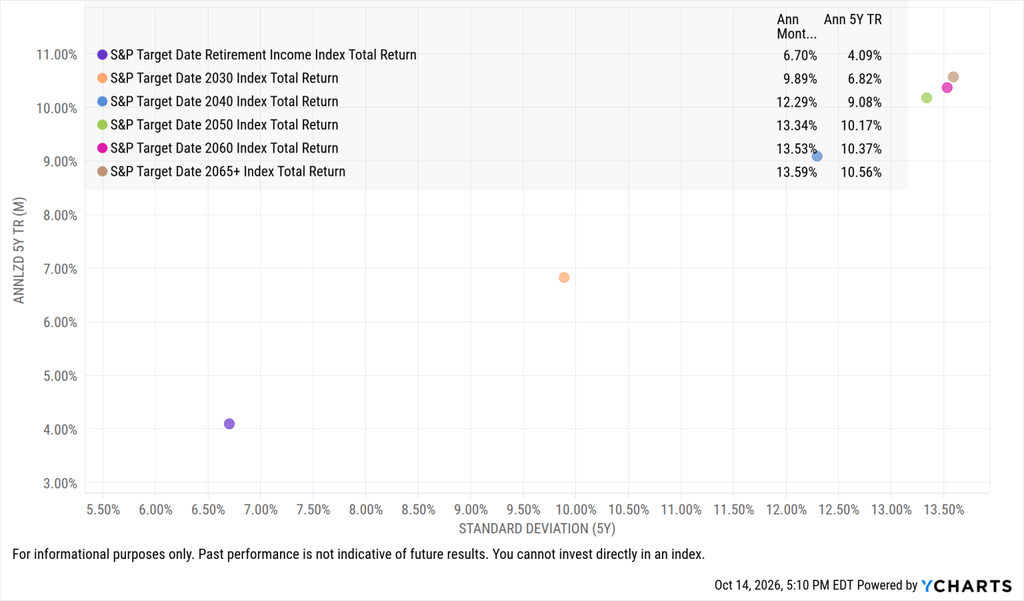
Whether your glide path is built ‘to’ or ‘through’ retirement, visuals like these, along with other tools like Scenarios, Tables, or Reports, can enhance your presentation in finals or annual plan reviews and help you win the placement.
Get Started
Search for the S&P Target Date Indices by name or vintage using Quickflows or the top search bar in YCharts to add them to charts or Comparison Tables.
If you’d like a walkthrough tailored to your target date series, reach out, and we’ll set up a session with your team.
Frequently Asked Questions (FAQ):
What are the S&P Target Date Indices?
A series of indices, one per vintage, that reflects the consensus asset allocation of the target date marketplace.
What is a glide path?
The schedule a target date fund follows to shift from stocks to bonds as participants approach retirement.
Why do target date funds need a benchmark?
As the default investment in most 401(k) plans, they face more fiduciary scrutiny than any other option on the menu.
How can DCIO and retirement teams use the indices on YCharts?
To benchmark each vintage, show performance across a full market cycle, and compare risk metrics like standard deviation and Sharpe ratio.
How do you find S&P 500 Target Date indices in YCharts?
Search for the S&P Target Date Indices by name or vintage using Quickflows or the top search bar
Ready to Move On From Your Investment Research and Analytics Platform?
Follow YCharts Social Media to Unlock More Content!
Next Article
Initial Market Reaction to the 2026 Midterms ResultsRead More →