The 10 Best Performing ETFs Over the Last 10 Years
Updated as of: June 2, 2026
In 2025, the ETF industry reached a new high with $1.5 trillion in net inflows, reshuffling market share leaders across various asset classes and peer groups.
Notably, several strategies that captured increased market share benefited significantly from robust long-term performance. Below, we explore some of the top-performing ETFs across different timeframes.

Access innovation without making a narrow bet. FWD (The AB Disruptors ETF) actively invests in market-leading innovators across sectors and geographies—offering diversified exposure to themes like AI, cloud, fintech and digital technology in one forward-looking ETF.
Now, let’s dive into the best-performing ETFs of the past decade.
To create this list, we analyzed the entire ETF universe using the YCharts Fund Screener to find the best-performing ETFs on a 1-year, 3-year, 5-year, 10-year basis (excluding leveraged and inverse ETFs). We also observed funds with the lowest max drawdowns during this period, as well.
Click to jump to a section:
- Best-Performing ETFs in the Last Year
- Best-Performing ETFs in the Last 3 Years
- Best-Performing ETFs in the Last 5 Years
- Best-Performing ETFs in the Last 10 Years
- What Was the Growth of $10,000 Over the Last 10 Years?
Looking for lists of the best performing mutual funds? Check out our analysis on the Best Performing Mutual Funds here.
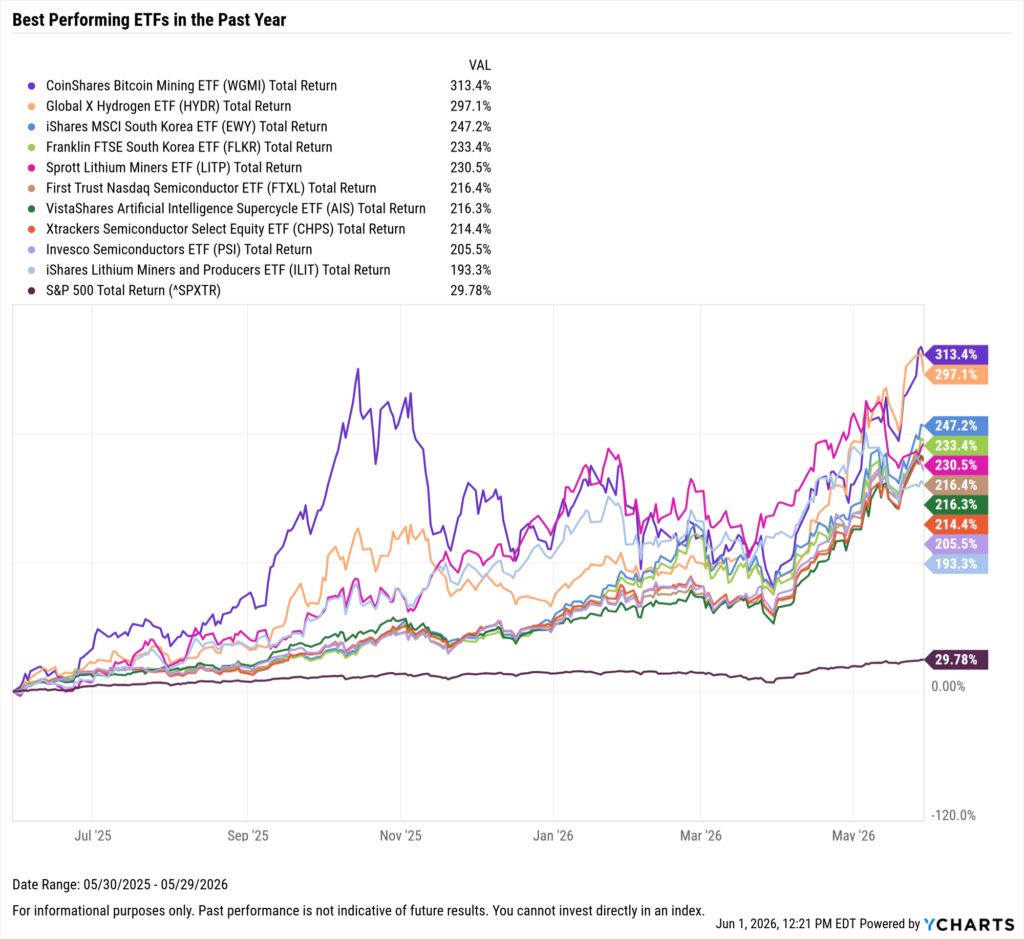
Best Performing ETFs in the Last Year
These are the top-performing ETFs over the past year, as of May 31, 2026.
| Symbol | Name | 1 Year Total Returns (Monthly) | Total Returns Since Inception (Monthly) | Net Expense Ratio | Share Class Assets Under Management | Peer Group Name |
|---|---|---|---|---|---|---|
| WGMI | CoinShares Bitcoin Mining ETF | 313.42% | 153.07% | 0.75% | $447,991,352 | Specialty/Miscellaneous Funds |
| HYDR | Global X Hydrogen ETF | 297.09% | -38.54% | 0.50% | $167,956,725 | Alternative Energy Funds |
| EWY | iShares MSCI South Korea ETF | 247.21% | 1348.42% | 0.59% | $24,140,622,305 | Pacific Ex Japan Funds |
| FLKR | Franklin FTSE South Korea ETF | 233.41% | 223.10% | 0.09% | $1,023,990,676 | Pacific Ex Japan Funds |
| LITP | Sprott Lithium Miners ETF | 230.51% | -6.28% | 0.65% | $62,987,080 | Basic Materials Funds |
| FTXL | First Trust Nasdaq Semiconductor ETF | 216.39% | 1263.30% | 0.60% | $2,516,564,887 | Science & Technology Funds |
| AIS | VistaShares Artificial Intelligence Supercycle ETF | 216.31% | 205.54% | 0.75% | $697,229,179 | Global Science/Technology Funds |
| CHPS | Xtrackers Semiconductor Select Equity ETF | 214.38% | 269.27% | 0.15% | $89,580,609 | Global Science/Technology Funds |
| PSI | Invesco Semiconductors ETF | 205.46% | 3308.54% | 0.56% | $2,637,922,419 | Science & Technology Funds |
| ILIT | iShares Lithium Miners and Producers ETF | 193.32% | -7.06% | 0.47% | $25,657,521 | Basic Materials Funds |
Start a Free Trial to See Full Rankings | View & Modify in Fund Screener
Download Visual | Modify in YCharts
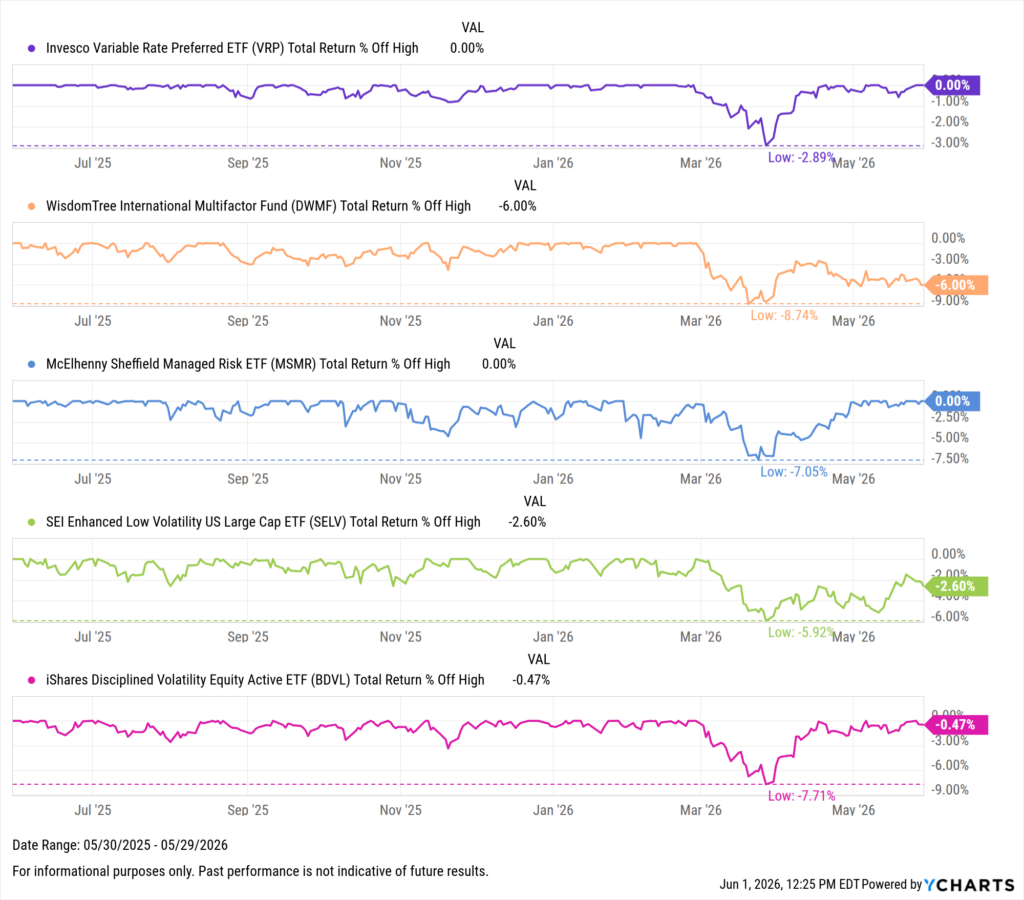
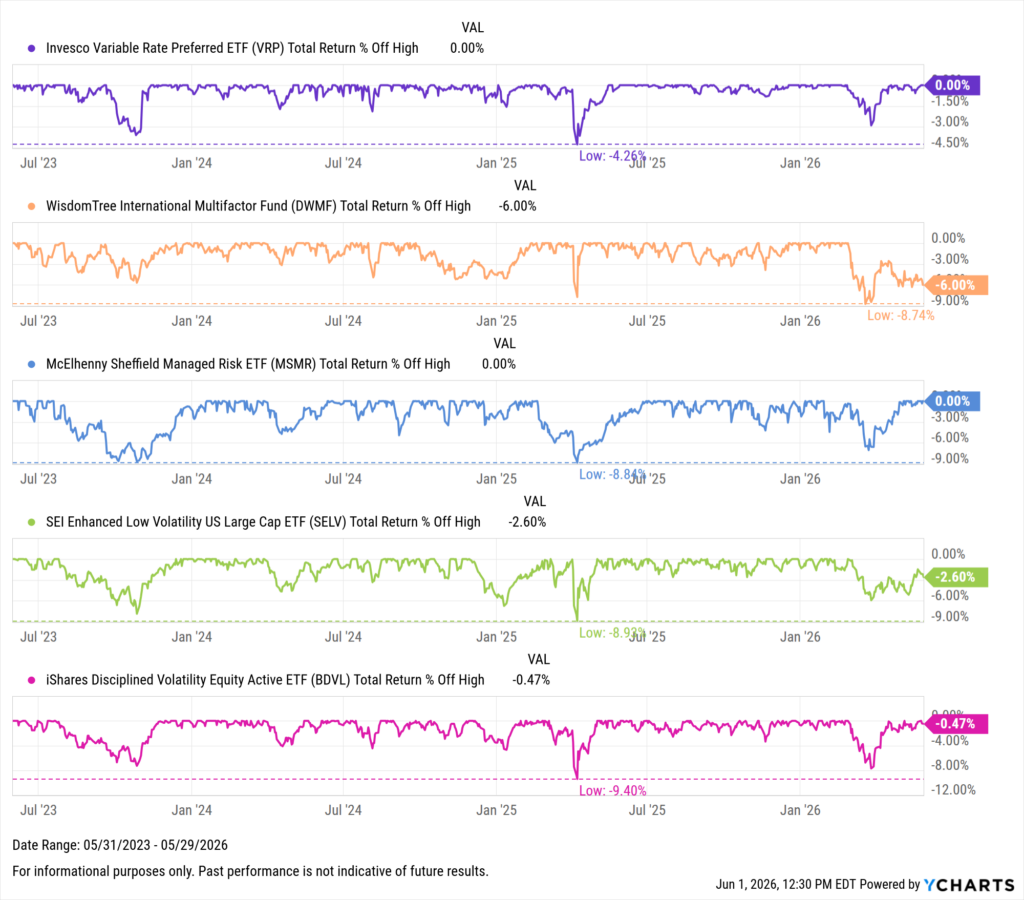
Equity ETFs with the Lowest Drawdown in the Last Year
As of May 31st, 2026, these equity ETFs had the lowest drawdown over the last year. The chart below can be expanded to comprehensively depict the peak-to-trough performance of the observed funds.
| Symbol | Name | Max Drawdown (1Y) | Net Expense Ratio | Share Class Assets Under Management | Peer Group Name |
|---|---|---|---|---|---|
| VRP | Invesco Variable Rate Preferred ETF | 8.59% | 0.50% | $2,862,090,365 | Equity Income Funds |
| DWMF | WisdomTree International Multifactor Fund | 8.74% | 0.38% | $37,217,426 | International Multi-Cap Value |
| MSMR | McElhenny Sheffield Managed Risk ETF | 8.84% | 1.06% | $180,144,387 | Multi-Cap Core Funds |
| SELV | SEI Enhanced Low Volatility US Large Cap ETF | 8.93% | 0.15% | $235,975,932 | Multi-Cap Value Funds |
| BDVL | iShares Disciplined Volatility Equity Active ETF | 9.40% | 0.40% | $1,720,930,220 | Global Multi-Cap Core |
| HEDG | Equable Shares Hedged Equity ETF | 9.92% | 0.96% | $401,130,027 | Large-Cap Core Funds |
| GSWO | Goldman Sachs ActiveBeta World Equity ETF | 9.97% | 0.25% | $1,716,312,293 | Global Multi-Cap Value |
| USMV | iShares MSCI USA Min Vol Factor ETF | 10.28% | 0.15% | $23,088,140,978 | Multi-Cap Core Funds |
| VFMV | Vanguard US Minimum Volatility ETF | 10.35% | 0.13% | $421,086,190 | Multi-Cap Value Funds |
| HDV | iShares Core High Dividend ETF | 10.49% | 0.08% | $13,406,717,133 | Equity Income Funds |
Start a Free Trial to See Full Rankings | View & Modify in Fund Screener
Download Visual | Modify in YCharts
Sign up for our free monthly Fund Flow Report to stay updated on how assets are moving in and out of these strategies:
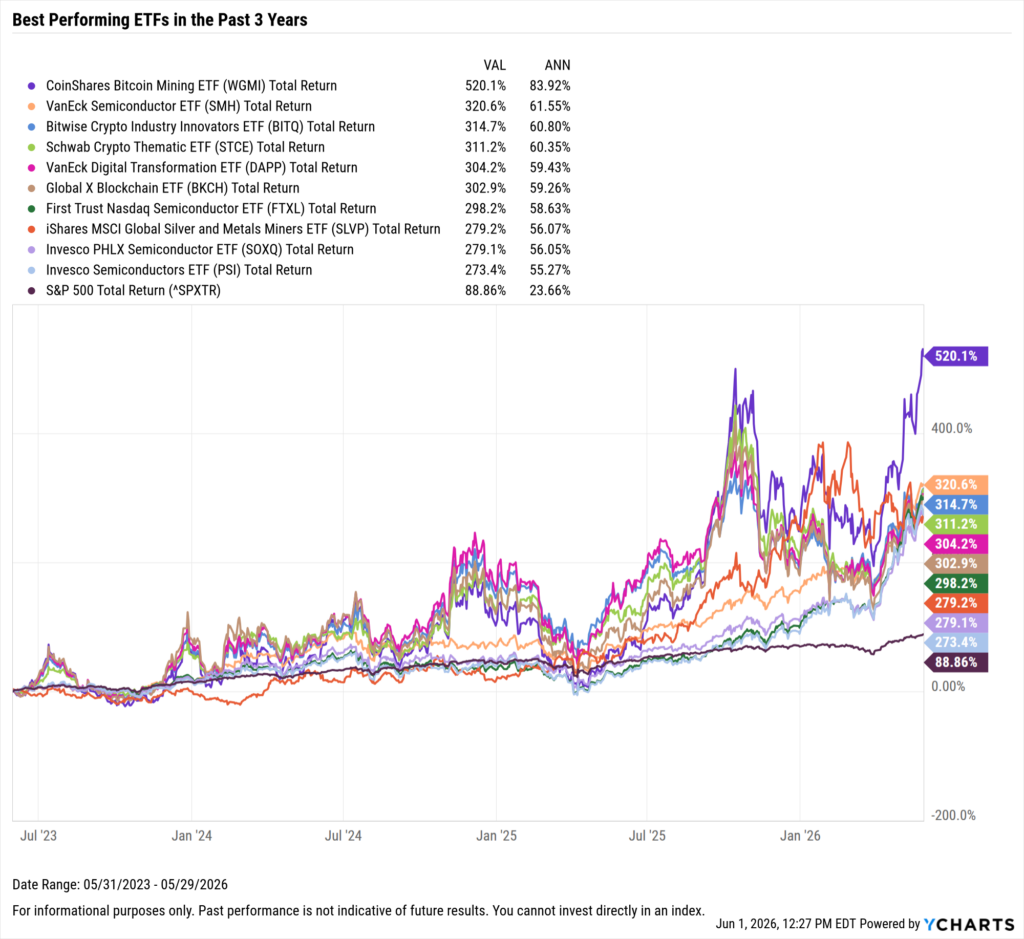
Best Performing ETFs in the Last 3 Years
These are the top-performing ETFs on an annualized basis between June 1, 2023 and May 31, 2026.
| Symbol | Name | 3 Year Total Returns (Monthly) | Annualized 3 Year Total Returns (Monthly) | Net Expense Ratio | Share Class Assets Under Management | Peer Group Name |
|---|---|---|---|---|---|---|
| WGMI | CoinShares Bitcoin Mining ETF | 520.08% | 83.72% | 0.75% | $447,991,352 | Specialty/Miscellaneous Funds |
| SMH | VanEck Semiconductor ETF | 320.55% | 61.41% | 0.35% | $67,822,489,502 | Science & Technology Funds |
| BITQ | Bitwise Crypto Industry Innovators ETF | 314.67% | 60.66% | 0.85% | $501,560,607 | Specialty/Miscellaneous Funds |
| STCE | Schwab Crypto Thematic ETF | 311.20% | 60.21% | 0.30% | $334,955,636 | Specialty/Miscellaneous Funds |
| DAPP | VanEck Digital Transformation ETF | 304.20% | 59.29% | 0.52% | $499,524,303 | Global Science/Technology Funds |
| BKCH | Global X Blockchain ETF | 302.88% | 59.12% | 0.50% | $389,697,861 | Global Science/Technology Funds |
| FTXL | First Trust Nasdaq Semiconductor ETF | 298.19% | 58.50% | 0.60% | $2,516,564,887 | Science & Technology Funds |
| SLVP | iShares MSCI Global Silver and Metals Miners ETF | 279.21% | 55.94% | 0.39% | $999,437,003 | Precious Metals Equity Funds |
| SOXQ | Invesco PHLX Semiconductor ETF | 279.11% | 55.93% | 0.19% | $2,413,548,792 | Science & Technology Funds |
| PSI | Invesco Semiconductors ETF | 273.41% | 55.14% | 0.56% | $2,637,922,419 | Science & Technology Funds |
Start a Free Trial to See Full Rankings | View & Modify in Fund Screener
Download Visual | Modify in YCharts
Equity ETFs with the Lowest Drawdown in the Last 3 Years
As of May 31, 2026, these equity ETFs had the lowest drawdown over the last three years. The chart below can be expanded to comprehensively depict the peak-to-trough performance of the observed funds.
| Symbol | Name | Max Drawdown (3Y) | Net Expense Ratio | Share Class Assets Under Management | Peer Group Name |
|---|---|---|---|---|---|
| VRP | Invesco Variable Rate Preferred ETF | 8.59% | 0.50% | $2,862,090,365 | Equity Income Funds |
| DWMF | WisdomTree International Multifactor Fund | 8.74% | 0.38% | $37,217,426 | International Multi-Cap Value |
| MSMR | McElhenny Sheffield Managed Risk ETF | 8.84% | 1.06% | $180,144,387 | Multi-Cap Core Funds |
| SELV | SEI Enhanced Low Volatility US Large Cap ETF | 8.93% | 0.15% | $235,975,932 | Multi-Cap Value Funds |
| BDVL | iShares Disciplined Volatility Equity Active ETF | 9.40% | 0.40% | $1,720,930,220 | Global Multi-Cap Core |
| HEDG | Equable Shares Hedged Equity ETF | 9.92% | 0.96% | $401,130,027 | Large-Cap Core Funds |
| GSWO | Goldman Sachs ActiveBeta World Equity ETF | 9.97% | 0.25% | $1,716,312,293 | Global Multi-Cap Value |
| USMV | iShares MSCI USA Min Vol Factor ETF | 10.28% | 0.15% | $23,088,140,978 | Multi-Cap Core Funds |
| VFMV | Vanguard US Minimum Volatility ETF | 10.35% | 0.13% | $421,086,190 | Multi-Cap Value Funds |
| HDV | iShares Core High Dividend ETF | 10.49% | 0.08% | $13,406,717,133 | Equity Income Funds |
Start a Free Trial to See Full Rankings | View & Modify in Fund Screener
Download Visual | Modify in YCharts
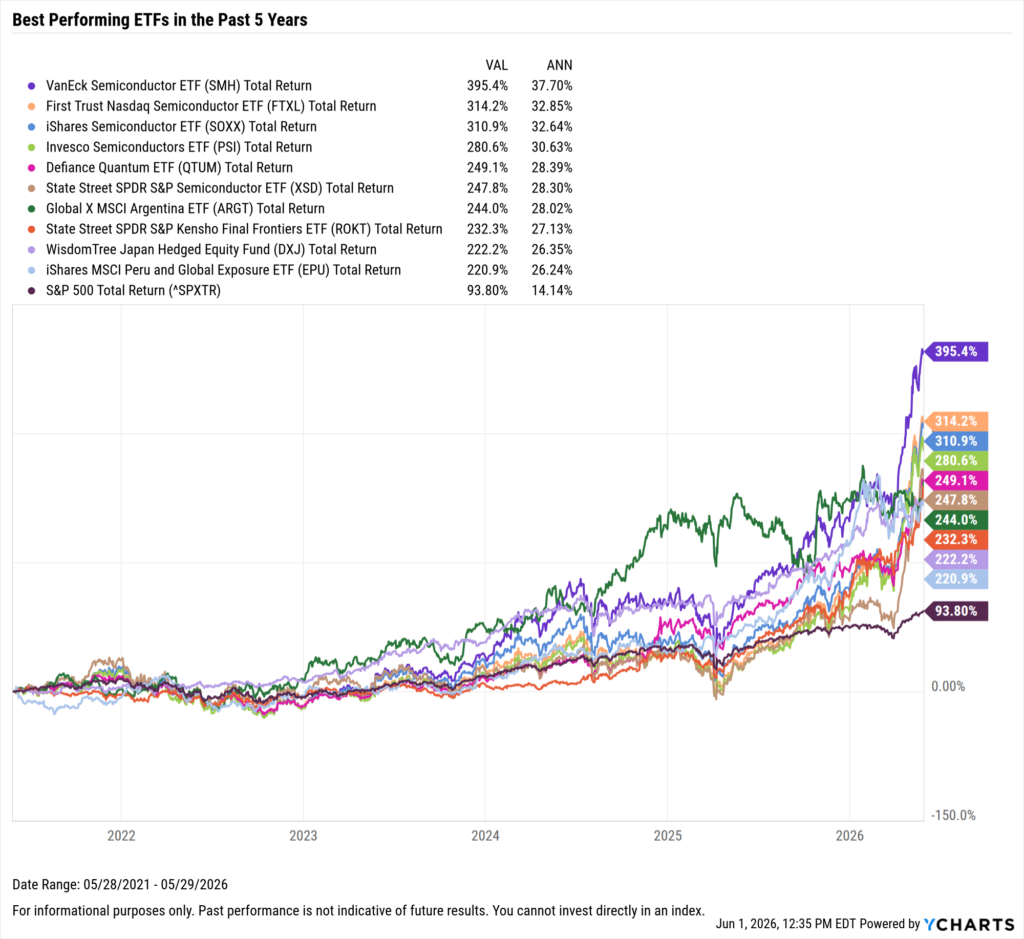
Best Performing ETFs in the Last 5 Years
These are the top-performing ETFs on an annualized basis between June 1, 2021 and May 31, 2026.
| Symbol | Name | 5 Year Total Returns (Monthly) | Annualized 5 Year Total Returns (Monthly) | Net Expense Ratio | Share Class Assets Under Management | Peer Group Name |
|---|---|---|---|---|---|---|
| SMH | VanEck Semiconductor ETF | 395.43% | 37.72% | 0.35% | $67,822,489,502 | Science & Technology Funds |
| FTXL | First Trust Nasdaq Semiconductor ETF | 314.19% | 32.87% | 0.60% | $2,516,564,887 | Science & Technology Funds |
| SOXX | iShares Semiconductor ETF | 310.88% | 32.66% | 0.34% | $38,373,488,686 | Science & Technology Funds |
| PSI | Invesco Semiconductors ETF | 280.63% | 30.65% | 0.56% | $2,637,922,419 | Science & Technology Funds |
| QTUM | Defiance Quantum ETF | 249.09% | 28.41% | 0.40% | $5,701,532,551 | Global Science/Technology Funds |
| XSD | State Street SPDR S&P Semiconductor ETF | 247.84% | 28.31% | 0.35% | $3,453,615,184 | Science & Technology Funds |
| ARGT | Global X MSCI Argentina ETF | 244.05% | 28.03% | 0.59% | $900,721,079 | Latin American Funds |
| ROKT | State Street SPDR S&P Kensho Final Frontiers ETF | 232.34% | 27.15% | 0.45% | $254,547,631 | Alternative Energy Funds |
| DXJ | WisdomTree Japan Hedged Equity Fund | 222.17% | 26.36% | 0.48% | $6,865,754,064 | Japanese Funds |
| EPU | iShares MSCI Peru and Global Exposure ETF | 220.86% | 26.26% | 0.59% | $531,071,058 | Latin American Funds |
Start a Free Trial to See Full Rankings | View & Modify in Fund Screener
Download Visual | Modify in YCharts
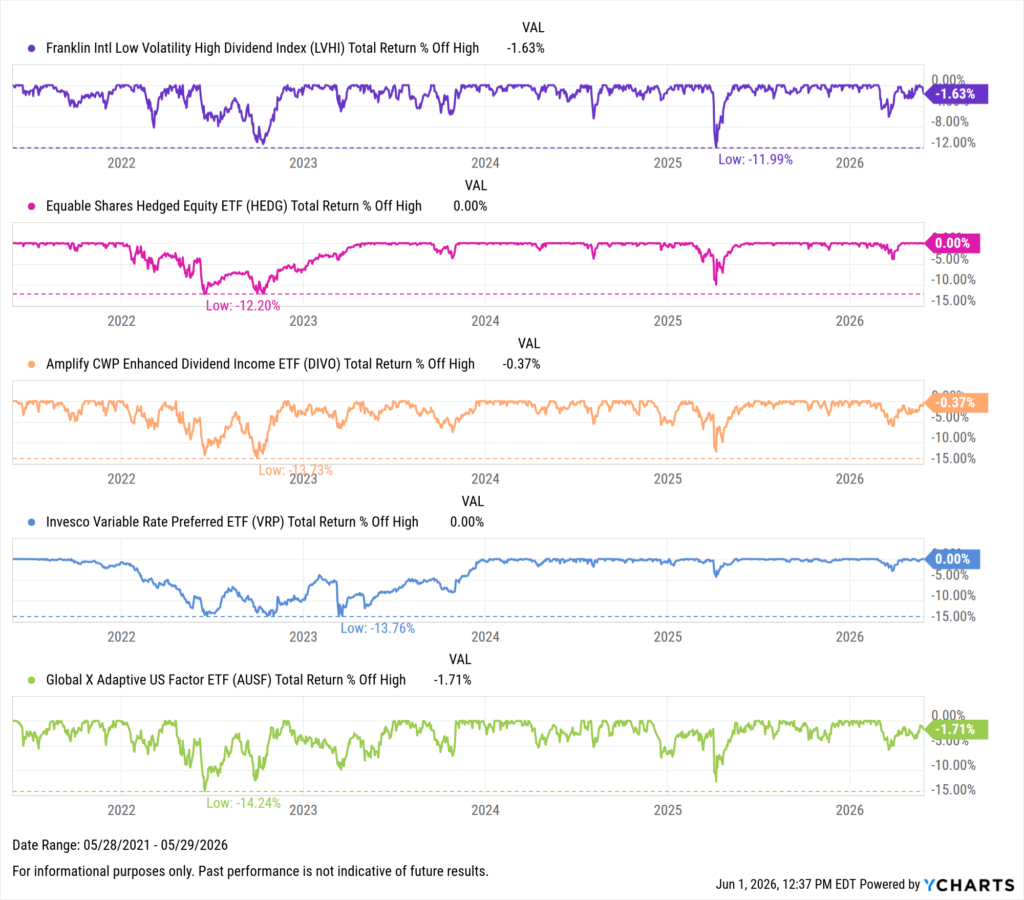
Equity ETFs with the Lowest Drawdown in the Last 5 Years
As of May 31, 2026, these equity ETFs had the lowest drawdown over the last five years. The chart below can be expanded to comprehensively depict the peak-to-trough performance of the observed funds.
| Symbol | Name | Max Drawdown (5Y) | Net Expense Ratio | Share Class Assets Under Management | Peer Group Name |
|---|---|---|---|---|---|
| LVHI | Franklin Intl Low Volatility High Dividend Index | 11.99% | 0.40% | $4,939,520,658 | International Large-Cap Value |
| HEDG | Equable Shares Hedged Equity ETF | 12.20% | 0.96% | $401,130,027 | Large-Cap Core Funds |
| DIVO | Amplify CWP Enhanced Dividend Income ETF | 13.73% | 0.56% | $7,114,858,001 | Equity Income Funds |
| VRP | Invesco Variable Rate Preferred ETF | 13.76% | 0.50% | $2,862,090,365 | Equity Income Funds |
| AUSF | Global X Adaptive US Factor ETF | 14.24% | 0.27% | $848,053,646 | Multi-Cap Value Funds |
| EMLP | First Trust North American Energy Infrastructure | 14.59% | 0.95% | $3,934,600,144 | Energy MLP Funds |
| IAK | iShares US Insurance ETF | 14.74% | 0.38% | $359,465,183 | Financial Services Funds |
| HEFA | iShares Currency Hedged MSCI EAFE ETF | 14.77% | 0.35% | $7,128,045,787 | International Large-Cap Core |
| DDWM | WisdomTree Dynamic International Equity Fund | 14.82% | 0.40% | $1,434,737,874 | International Multi-Cap Value |
| DBEF | Xtrackers MSCI EAFE Hedged Equity ETF | 14.99% | 0.35% | $8,812,167,166 | International Large-Cap Core |
Start a Free Trial to See Full Rankings | View & Modify in Fund Screener
Download Visual | Modify in YCharts
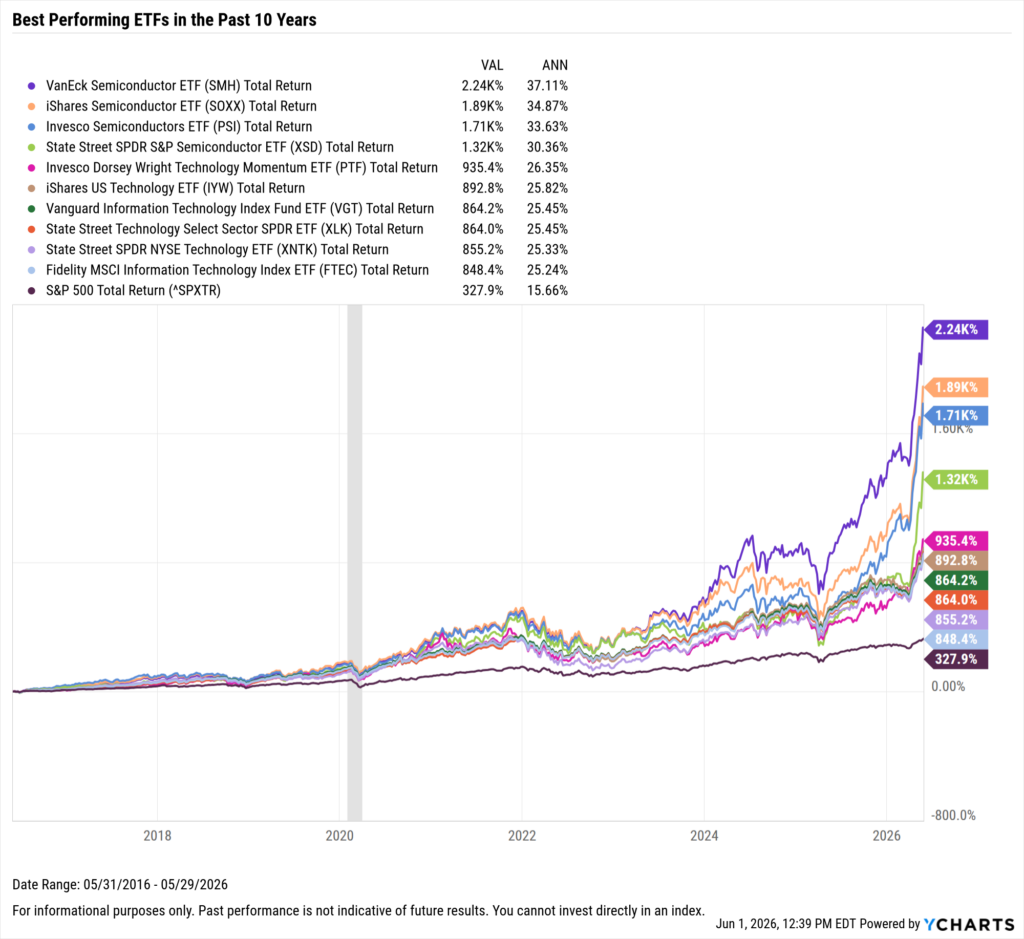
Best Performing ETFs in the Last 10 Years
These are the top-performing ETFs on an annualized basis between June 1, 2016 and May 31, 2026.
| Symbol | Name | 10 Year Total Returns (Monthly) | Annualized 10 Year Total Returns (Monthly) | Net Expense Ratio | Share Class Assets Under Management | Peer Group Name |
|---|---|---|---|---|---|---|
| SMH | VanEck Semiconductor ETF | 2244.37% | 37.09% | 0.35% | $67,822,489,502 | Science & Technology Funds |
| SOXX | iShares Semiconductor ETF | 1887.91% | 34.85% | 0.34% | $38,373,488,686 | Science & Technology Funds |
| PSI | Invesco Semiconductors ETF | 1712.39% | 33.61% | 0.56% | $2,637,922,419 | Science & Technology Funds |
| XSD | State Street SPDR S&P Semiconductor ETF | 1315.19% | 30.34% | 0.35% | $3,453,615,184 | Science & Technology Funds |
| PTF | Invesco Dorsey Wright Technology Momentum ETF | 935.43% | 26.33% | 0.60% | $729,403,895 | Science & Technology Funds |
| IYW | iShares US Technology ETF | 892.78% | 25.80% | 0.38% | $25,224,989,793 | Science & Technology Funds |
| VGT | Vanguard Information Technology Index Fund ETF | 864.19% | 25.43% | 0.09% | $127,188,482,757 | Science & Technology Funds |
| XLK | State Street Technology Select Sector SPDR ETF | 863.96% | 25.43% | 0.08% | $121,664,919,081 | Science & Technology Funds |
| XNTK | State Street SPDR NYSE Technology ETF | 855.23% | 25.32% | 0.35% | $2,184,302,044 | Science & Technology Funds |
| FTEC | Fidelity MSCI Information Technology Index ETF | 848.41% | 25.23% | 0.08% | $21,380,150,905 | Science & Technology Funds |
Start a Free Trial to See Full Rankings | View & Modify in Fund Screener
Download Visual | Modify in YCharts
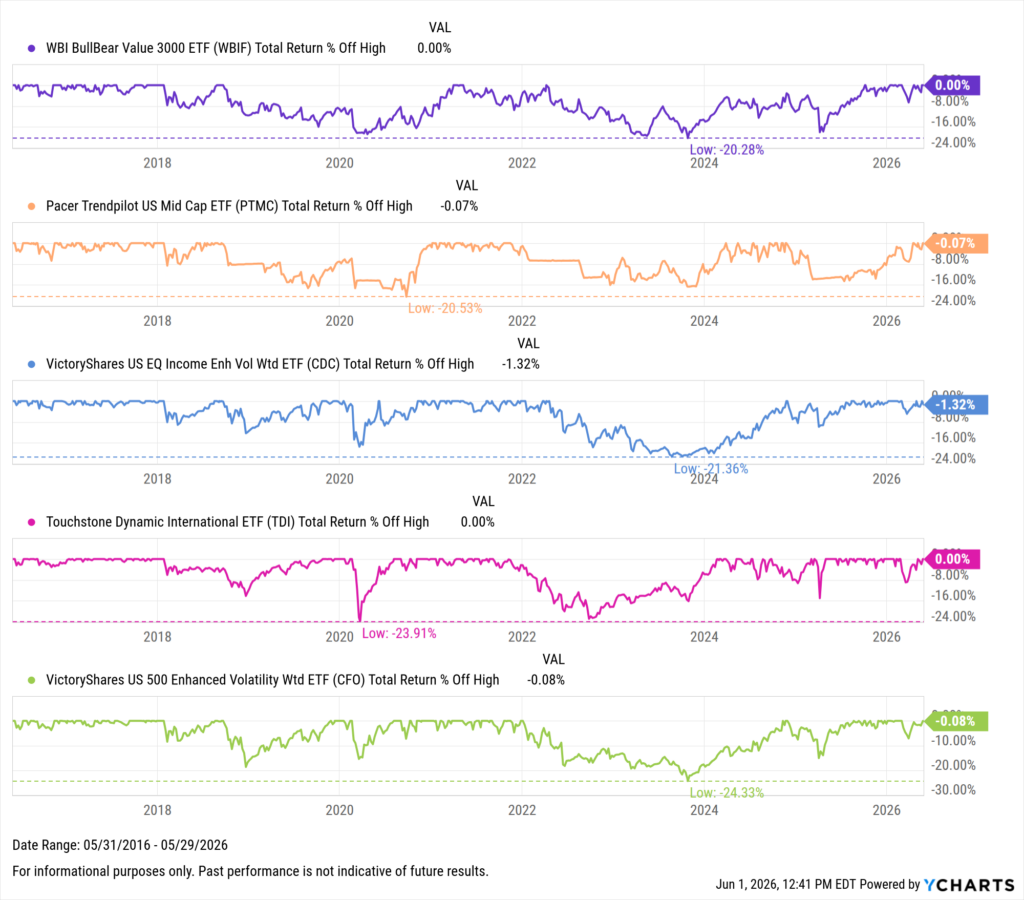
Equity ETFs with the Lowest Drawdown in the Last 10 Years
As of May 31, 2026, these equity ETFs had the lowest drawdown over the last ten years. The chart below can be expanded to comprehensively depict the peak-to-trough performance of the observed funds.
| Symbol | Name | Max Drawdown (10Y) | Net Expense Ratio | Share Class Assets Under Management | Peer Group Name |
|---|---|---|---|---|---|
| WBIF | WBI BullBear Value 3000 ETF | 20.28% | 1.65% | $23,627,188 | Multi-Cap Core Funds |
| PTMC | Pacer Trendpilot US Mid Cap ETF | 20.53% | 0.60% | $397,869,384 | Small-Cap Core Funds |
| CDC | VictoryShares US EQ Income Enh Vol Wtd ETF | 21.36% | 0.35% | $720,355,137 | Multi-Cap Value Funds |
| TDI | Touchstone Dynamic International ETF | 23.91% | 0.65% | $317,703,371 | International Large-Cap Core |
| CFO | VictoryShares US 500 Enhanced Volatility Wtd ETF | 24.33% | 0.35% | $406,778,392 | Multi-Cap Core Funds |
| XLP | State Street Consumer Staples Sel Sect SPDR ETF | 24.50% | 0.08% | $15,065,781,209 | Consumer Goods Funds |
| KXI | iShares Global Consumer Staples ETF | 24.59% | 0.39% | $1,001,906,787 | Consumer Goods Funds |
| RTH | VanEck Retail ETF | 24.99% | 0.35% | $252,553,953 | Consumer Services Funds |
| GMOM | Cambria Global Momentum ETF | 25.02% | 1.01% | $70,582,814 | Global Multi-Cap Core |
| FSTA | Fidelity MSCI Consumer Staples Index ETF | 25.09% | 0.08% | $1,373,611,965 | Consumer Goods Funds |
Start a Free Trial to See Full Rankings | View & Modify in Fund Screener
Download Visual | Modify in YCharts
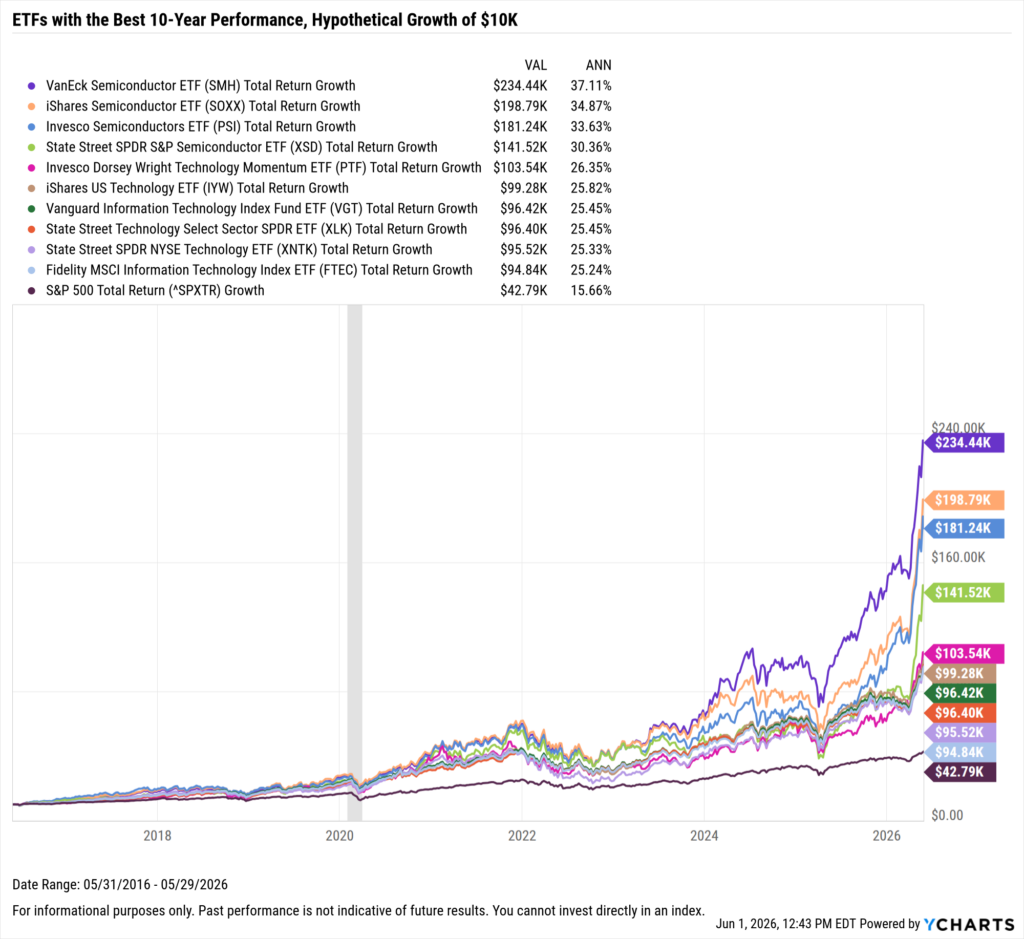
What Was the Growth of $10,000 in the Top ETFs Over the Last 10 Years?
If you invested $10,000 10 years ago into any of the ten best-performing ETFs over the last 10 years, your balance today would be no less than $94K.
The best-performing ETF in the last 10 years was VanEck Semiconductor ETF (SMH). A $10,000 investment into SMH 10 years ago would be worth over $234,000 today. Right behind it was the iShares Semiconductor ETF (SOXX); investing $10,000 into SOXX back in 2016 would’ve turned into nearly $200,000.
Download Visual | Modify in YCharts
Whenever you’re ready, here’s how YCharts can help you:
1. Looking to Move On From Your Investment Research and Analytics Platform?
2. Want to test out YCharts for free?
Start a no-risk 7-Day Free Trial.
3. Sign up for a copy of our Fund Flows Report and Visual Deck to stay on top of ETF trends:
Sign up to recieve a copy of our monthly Fund Flows Report:Disclaimer
©2026 YCharts, Inc. All Rights Reserved. YCharts, Inc. (“YCharts”) is not registered with the U.S. Securities and Exchange Commission (or with the securities regulatory authority or body of any state or any other jurisdiction) as an investment adviser, broker-dealer or in any other capacity, and does not purport to provide investment advice or make investment recommendations. This report has been generated through application of the analytical tools and data provided through ycharts.com and is intended solely to assist you or your investment or other adviser(s) in conducting investment research. You should not construe this report as an offer to buy or sell, as a solicitation of an offer to buy or sell, or as a recommendation to buy, sell, hold or trade, any security or other financial instrument. For further information regarding your use of this report, please go to: ycharts.com/about/disclosure.
Next Article
Monthly Market Wrap: May 2026Read More →