The Best Performing Tech Stocks over the Last 10 Years
Updated as of: April 13, 2026
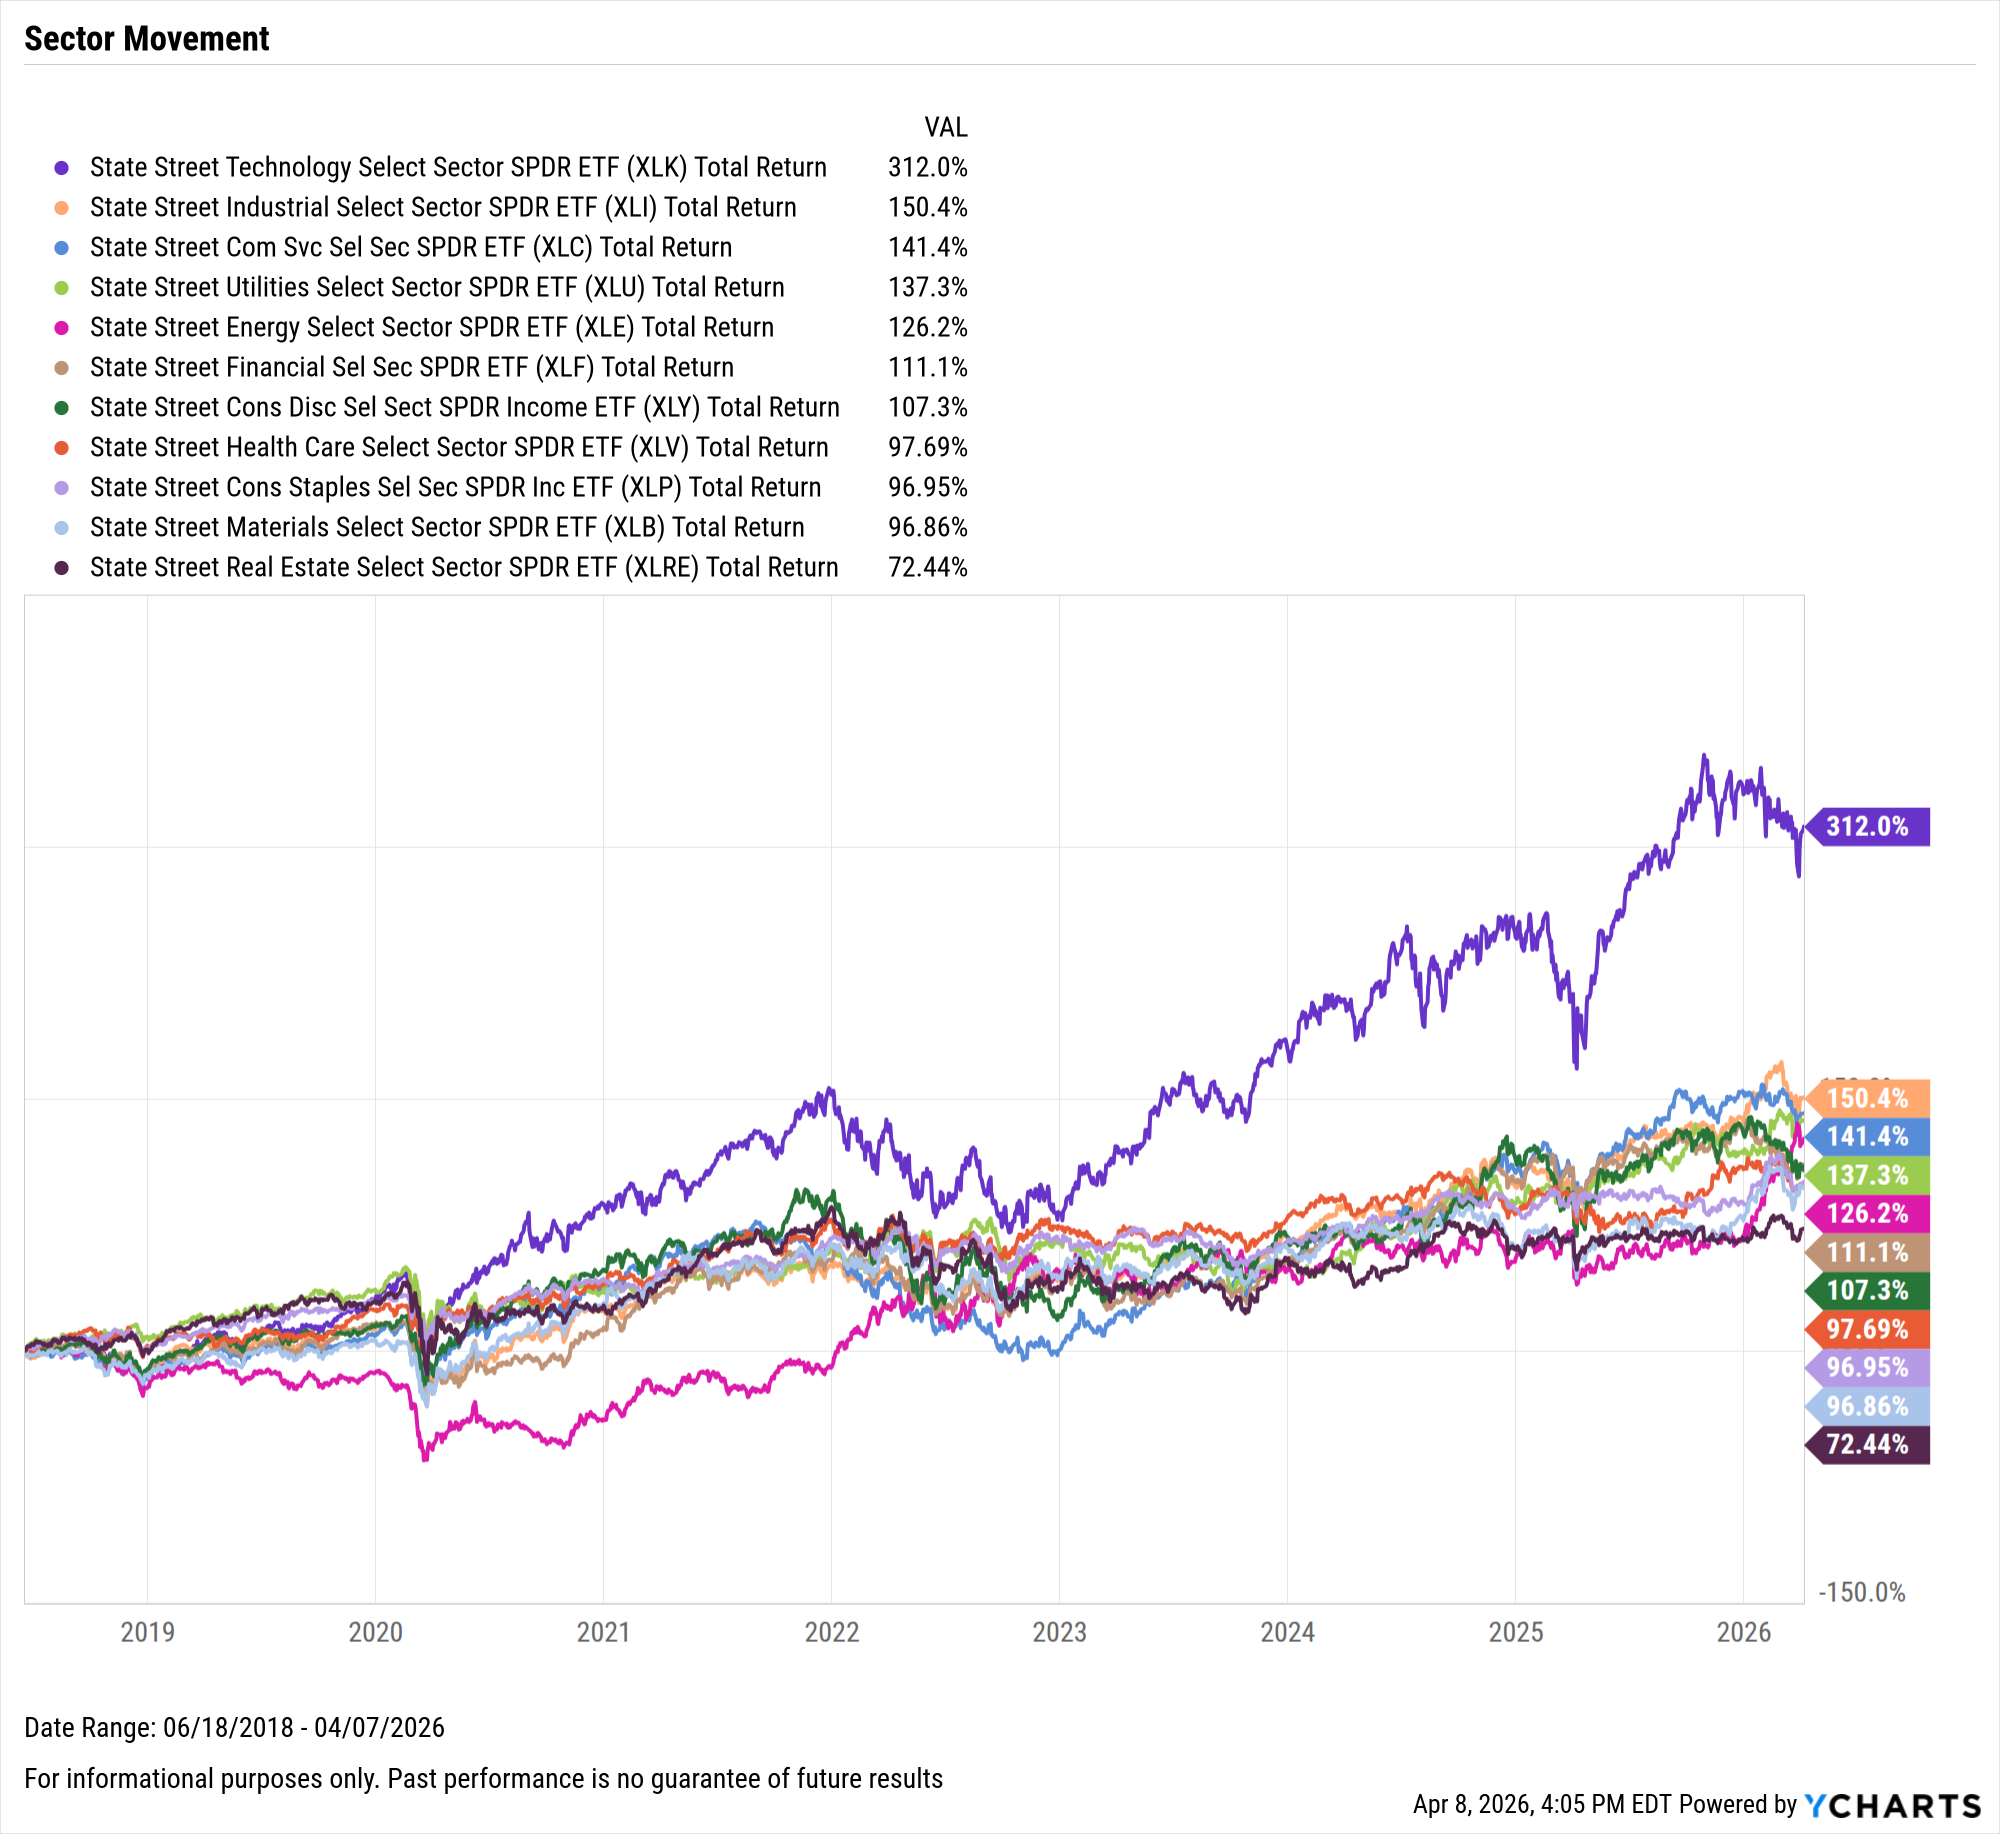
Since the creation of the Communication Services sector in June 2018, it has been the third-best performer out of the eleven major stock sectors.
However, in first place is the Technology sector, whose total return has more than doubled that of Communication Services in that same time frame.

Download Visual | Modify in YCharts
This article dives further into the dominance of these sectors by looking at the best-performing tech-focused stocks from the last year all the way back to the past decade, with data routinely updated by YCharts.
To create this list, we used the YCharts Stock Screener to find the best-performing Russell 3000 stocks across the Information Technology and Communication Services sectors over a YTD, 1-year, 3-year, 5-year, and 10-year basis.
Table of Contents
Looking for lists of the best performing stocks overall? Check our analysis on the Best Performing Stocks in the Last 25 Years here.
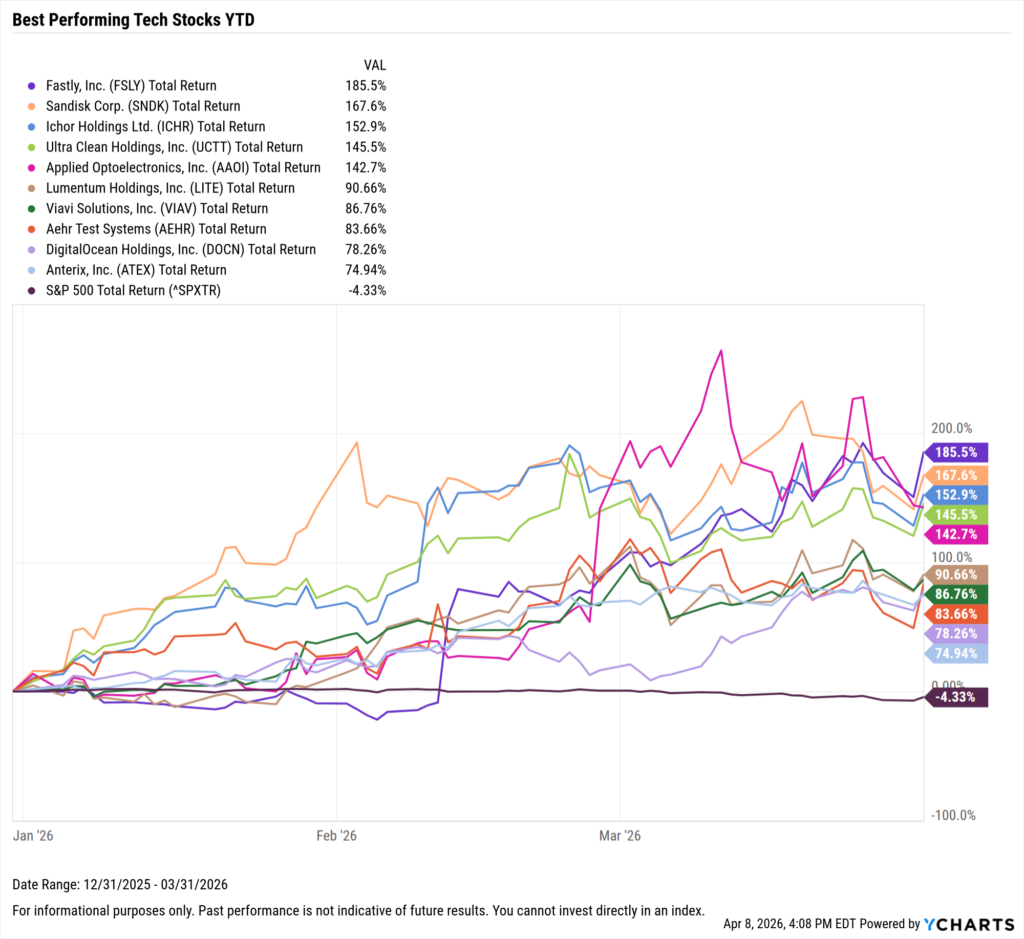
Best Performing Tech Stocks YTD
These are the top-performing Tech stocks YTD, as of March 31, 2026.
| Symbol | Name | YTD Price Return | YTD Total Return | Total Return Since Inception | Market Cap ($M) |
|---|---|---|---|---|---|
| FSLY | Fastly, Inc. | 185.46% | 185.46% | 81.63% | $4,796.88 |
| SNDK | Sandisk Corp. | 167.65% | 167.65% | 1664.83% | $104,890.77 |
| ICHR | Ichor Holdings Ltd. | 152.90% | 152.90% | 377.07% | $1,692.37 |
| UCTT | Ultra Clean Holdings, Inc. | 145.48% | 145.48% | 729.07% | $2,883.61 |
| AAOI | Applied Optoelectronics, Inc. | 142.66% | 142.66% | 749.30% | $9,137.70 |
| LITE | Lumentum Holdings, Inc. | 90.66% | 90.66% | 4033.88% | $58,244.55 |
| VIAV | Viavi Solutions, Inc. | 86.76% | 86.76% | 609.53% | $8,917.74 |
| AEHR | Aehr Test Systems | 83.66% | 83.66% | 151.39% | $1,539.02 |
| DOCN | DigitalOcean Holdings, Inc. | 78.26% | 78.26% | 82.51% | $9,000.52 |
| ATEX | Anterix, Inc. | 74.94% | 74.94% | -4.53% | $770.86 |
Start a Free Trial to See Full Rankings | View & Modify in Stock Screener
Download Visual | Modify in YCharts
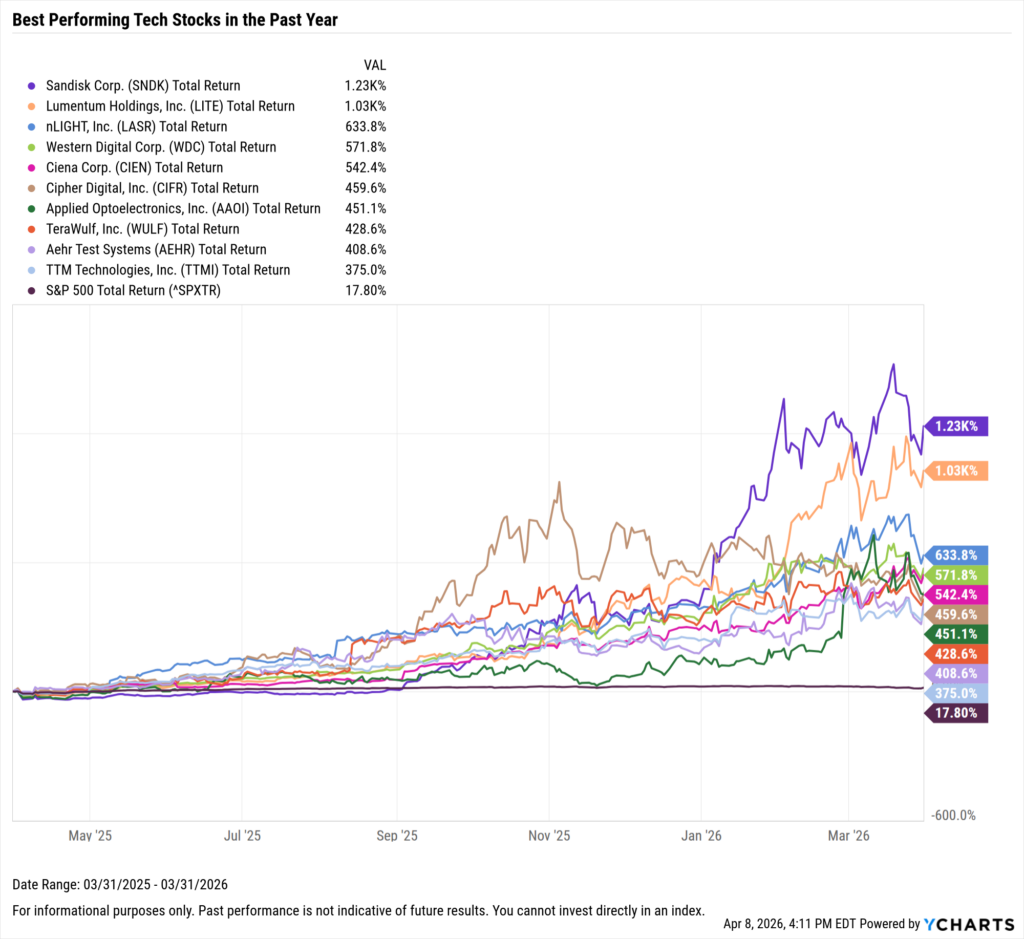
Best Performing Tech Stocks in the Last Year
These are the top-performing Tech stocks over the past year, as of March 31, 2026.
| Symbol | Name | 1 Year Price Return | 1 Year Total Return | Total Return Since Inception | Market Cap ($M) |
|---|---|---|---|---|---|
| SNDK | Sandisk Corp. | 1234.47% | 1234.47% | 1664.83% | $104,890.77 |
| LITE | Lumentum Holdings, Inc. | 1027.30% | 1027.30% | 4033.88% | $58,244.55 |
| LASR | nLIGHT, Inc. | 633.85% | 633.85% | 111.58% | $3,220.27 |
| WDC | Western Digital Corp. | 569.03% | 571.85% | 10267.59% | $105,766.26 |
| CIEN | Ciena Corp. | 542.45% | 542.45% | 199.79% | $63,329.52 |
| CIFR | Cipher Digital, Inc. | 459.57% | 459.57% | 31.33% | $5,675.72 |
| AAOI | Applied Optoelectronics, Inc. | 451.07% | 451.07% | 749.30% | $9,137.70 |
| WULF | TeraWulf, Inc. | 428.57% | 428.57% | 381.00% | $7,026.81 |
| AEHR | Aehr Test Systems | 408.64% | 408.64% | 151.39% | $1,539.02 |
| TTMI | TTM Technologies, Inc. | 374.99% | 374.99% | 365.23% | $10,267.07 |
Start a Free Trial to See Full Rankings | View & Modify in Stock Screener
Download Visual | Modify in YCharts
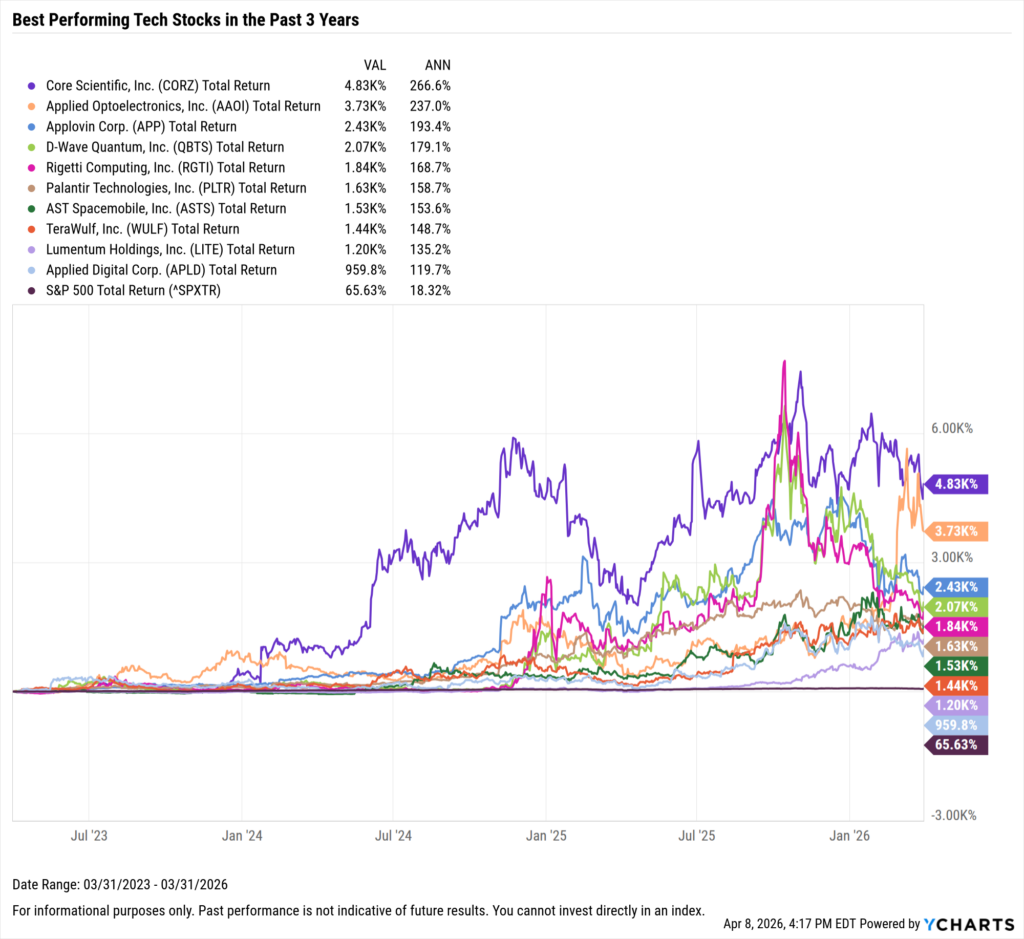
Best Performing Tech Stocks in the Last 3 Years
These are the top-performing Tech stocks on an annualized basis between April 1st, 2023 and March 31, 2026.
| Symbol | Name | 3 Year Price Return | 3 Year Total Return | Total Return Since Inception | Market Cap ($M) |
|---|---|---|---|---|---|
| CORZ | Core Scientific, Inc. | 4825.91% | 4825.91% | 48.12% | $5,307.05 |
| AAOI | Applied Optoelectronics, Inc. | 3727.60% | 3727.60% | 749.30% | $9,137.70 |
| APP | Applovin Corp. | 2426.98% | 2426.98% | 510.43% | $138,432.38 |
| QBTS | D-Wave Quantum, Inc. | 2072.87% | 2073.79% | 44.36% | $5,082.61 |
| RGTI | Rigetti Computing, Inc. | 1840.83% | 1840.83% | 41.82% | $4,596.96 |
| PLTR | Palantir Technologies, Inc. | 1631.12% | 1631.12% | 1439.79% | $358,918.77 |
| ASTS | AST Spacemobile, Inc. | 1531.30% | 1531.30% | 748.21% | $27,089.41 |
| WULF | TeraWulf, Inc. | 1438.71% | 1438.71% | 381.00% | $7,026.81 |
| LITE | Lumentum Holdings, Inc. | 1201.17% | 1201.17% | 4033.88% | $58,244.55 |
| APLD | Applied Digital Corp. | 959.82% | 959.82% | 69.87% | $7,039.97 |
Start a Free Trial to See Full Rankings | View & Modify in Stock Screener
Download Visual | Modify in YCharts
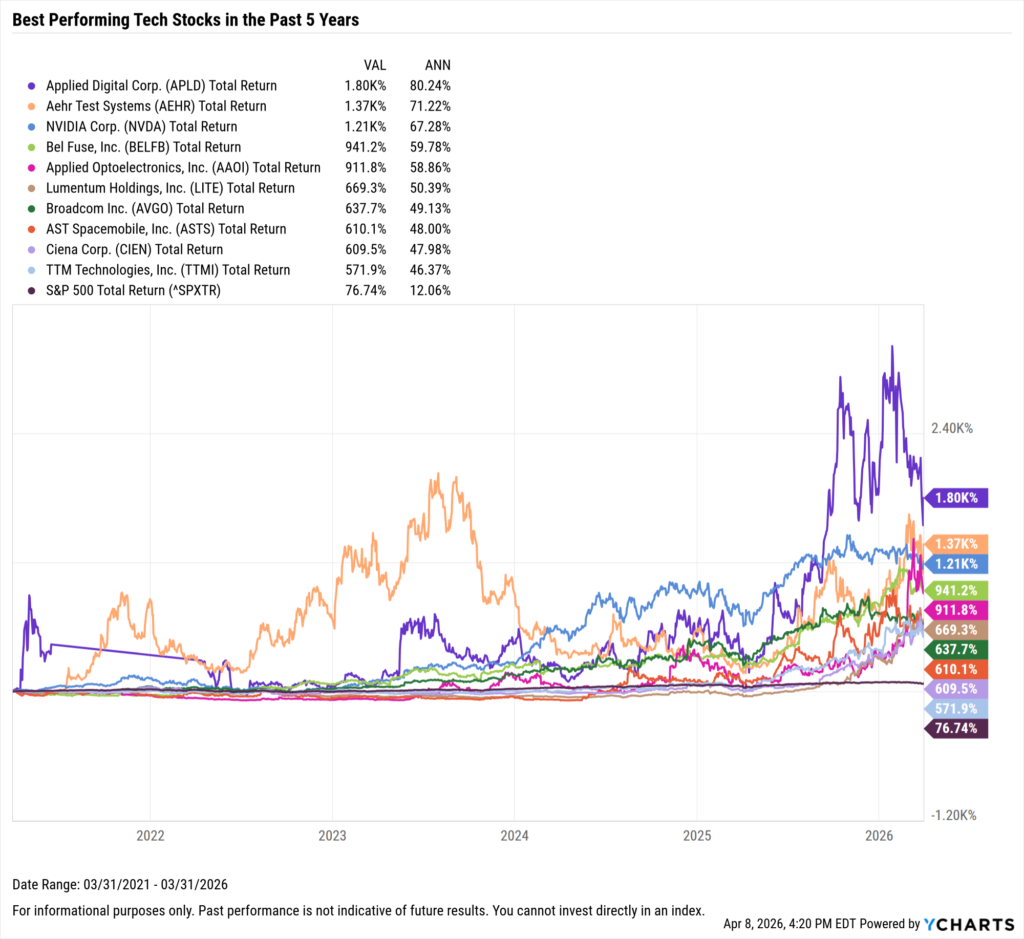
Best Performing Tech Stocks in the Last 5 Years
These are the top-performing Tech stocks on an annualized basis between April 1, 2021 and March 31, 2026.
| Symbol | Name | 5 Year Price Return | 5 Year Total Return | Total Return Since Inception | Market Cap ($M) |
|---|---|---|---|---|---|
| APLD | Applied Digital Corp. | 1802.25% | 1802.25% | 69.87% | $7,039.97 |
| AEHR | Aehr Test Systems | 1371.43% | 1371.43% | 151.39% | $1,539.02 |
| NVDA | NVIDIA Corp. | 1206.54% | 1209.80% | 463569.61% | $4,327,830.00 |
| BELFB | Bel Fuse, Inc. | 895.37% | 941.24% | 2712.48% | $2,661.87 |
| AAOI | Applied Optoelectronics, Inc. | 911.84% | 911.84% | 749.30% | $9,137.70 |
| LITE | Lumentum Holdings, Inc. | 669.30% | 669.30% | 4033.88% | $58,244.55 |
| AVGO | Broadcom Inc. | 567.54% | 637.73% | 26729.22% | $1,581,237.14 |
| ASTS | AST Spacemobile, Inc. | 610.11% | 610.11% | 748.21% | $27,089.41 |
| CIEN | Ciena Corp. | 609.48% | 609.48% | 199.79% | $63,329.52 |
| TTMI | TTM Technologies, Inc. | 571.86% | 571.86% | 365.23% | $10,267.07 |
Start a Free Trial to See Full Rankings | View & Modify in Stock Screener
Download Visual | Modify in YCharts
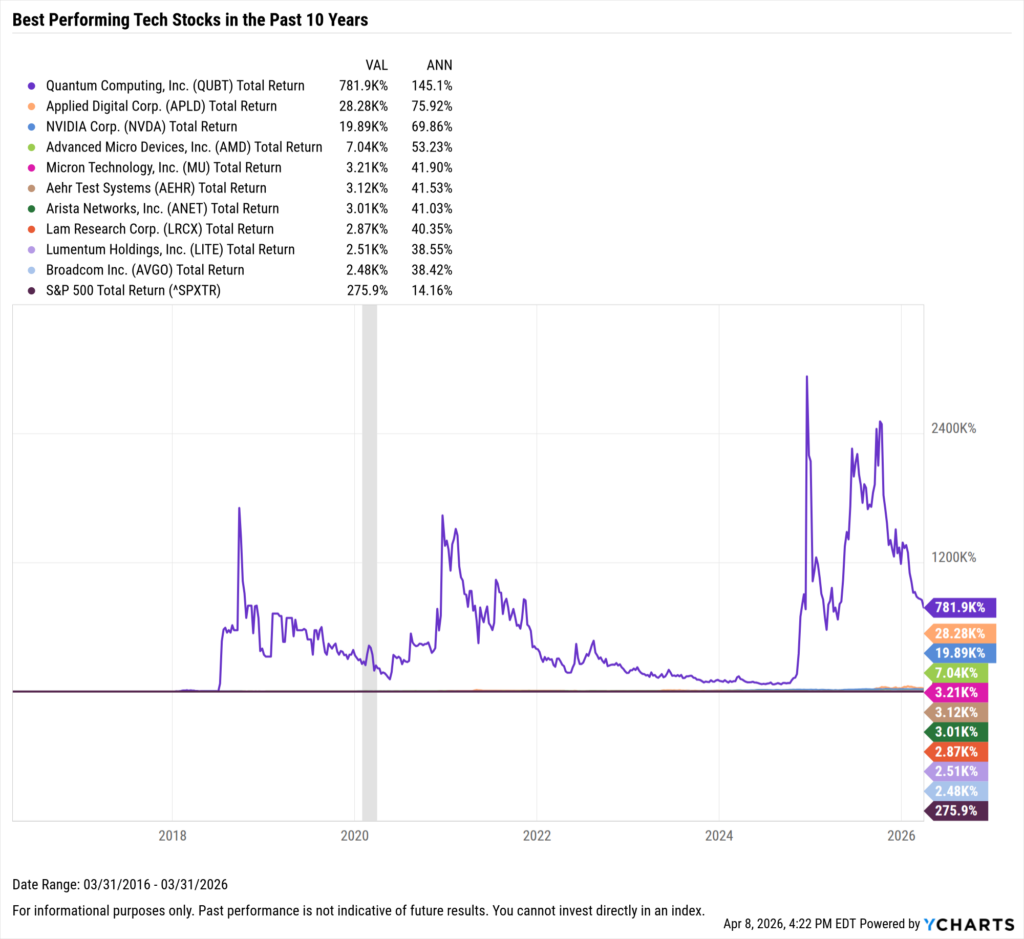
Best Performing Tech Stocks in the Last 10 Years
These are the top-performing Tech stocks on an annualized basis between April 1, 2016 and March 31, 2026.
| Symbol | Name | 10 Year Price Return | 10 Year Total Return | Total Return Since Inception | Market Cap ($M) |
|---|---|---|---|---|---|
| QUBT | Quantum Computing, Inc. | 781863.47% | 781863.47% | 2183.33% | $1,520.12 |
| APLD | Applied Digital Corp. | 28283.55% | 28283.55% | 69.87% | $7,039.97 |
| NVDA | NVIDIA Corp. | 19479.01% | 19892.15% | 463569.61% | $4,327,830.00 |
| AMD | Advanced Micro Devices, Inc. | 7037.89% | 7037.89% | 4832.99% | $361,168.95 |
| MU | Micron Technology, Inc. | 3126.74% | 3209.06% | 35378.05% | $425,809.84 |
| AEHR | Aehr Test Systems | 3124.35% | 3124.35% | 151.39% | $1,539.02 |
| ANET | Arista Networks, Inc. | 3013.28% | 3013.28% | 3471.78% | $167,923.73 |
| LRCX | Lam Research Corp. | 2486.68% | 2866.11% | 153139.48% | $280,161.77 |
| LITE | Lumentum Holdings, Inc. | 2505.71% | 2505.71% | 4033.88% | $58,244.55 |
| AVGO | Broadcom Inc. | 1903.30% | 2481.28% | 26729.22% | $1,581,237.14 |
Start a Free Trial to See Full Rankings | View & Modify in Stock Screener
Download Visual | Modify in YCharts
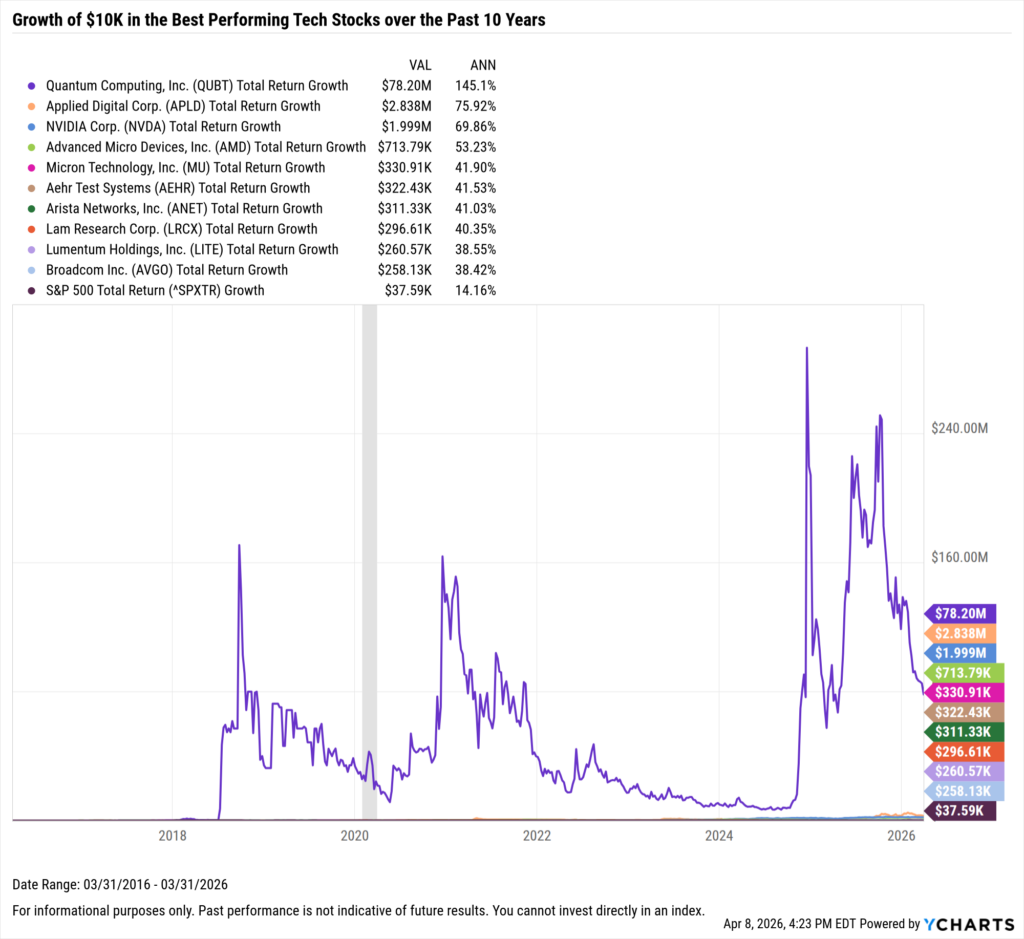
What Was the Growth of $10,000 in the Top Tech Stocks Over the Last 10 Years?
If you invested $10,000 ten years ago into any of the ten best-performing technology or communication services stocks over the last 10 years, your total return would be no less than $258,000.
The best performing tech-focused stock in the last ten years was Quantum Computing (QUBT). A $10,000 investment into QUBT 10 years ago would be worth a whopping $78.2 million today. The next best performing tech was Applied Digital Corp (APLD); investing $10,000 into APLD back in 2016 would’ve turned into $2.84 million on a total return basis.
Download Visual | Modify in YCharts
Whenever you’re ready, there are 3 ways YCharts can help you:
1. Looking for a best-in-class data & visualization tool?
Send us an email at hello@ycharts.com or call (866) 965-7552. You’ll be directly in touch with one of our Chicago-based team members.
2. Want to test out YCharts for free?
Start a no-risk 7-Day Free Trial.
3. Download a copy of The Top 10 Visuals for Client and Prospect Meetings slide deck:
Disclaimer
©2026 YCharts, Inc. All Rights Reserved. YCharts, Inc. (“YCharts”) is not registered with the U.S. Securities and Exchange Commission (or with the securities regulatory authority or body of any state or any other jurisdiction) as an investment adviser, broker-dealer or in any other capacity, and does not purport to provide investment advice or make investment recommendations. This report has been generated through application of the analytical tools and data provided through ycharts.com and is intended solely to assist you or your investment or other adviser(s) in conducting investment research. You should not construe this report as an offer to buy or sell, as a solicitation of an offer to buy or sell, or as a recommendation to buy, sell, hold or trade, any security or other financial instrument. For further information regarding your use of this report, please go to: ycharts.com/about/disclosure.
Next Article
When Clients Ask Why, You'll Have an Answer with Factor Analysis in YChartsRead More →