Understanding Market Trends Through Economic Indicators: A Guide for Research-Oriented Financial Advisors
Staying ahead of market trends is crucial to run a high-performing financial advisory practice. For research-oriented financial advisors—such as Portfolio Managers, CFAs, and Research Directors—the ability to anticipate market movements can significantly enhance investment strategies, client satisfaction, and portfolio outcomes. At the heart of this ability lies a profound understanding of economic indicators. These metrics provide invaluable insights into the health and direction of the economy, allowing advisors to make informed, strategic decisions.
In this post, we will delve into the significance of economic indicators, explore key metrics to watch, and highlight applications that can enhance your analytical capabilities. We will also discuss how integrating economic indicators into your portfolio management strategies can lead to better investment outcomes, and touch on how predictive analytics and the AI craze are shaping the future of economic analysis.
The Basics of Economic Indicators
Defining Economic Indicators
Economic indicators are statistical metrics used to gauge the overall health of the economy. They provide critical insights into various economic activities, enabling financial advisors to better predict future market trends. These indicators are essential in financial analysis because they offer data-driven evidence of economic performance, influencing investment decisions and policy making.
Types of Economic Indicators
Economic indicators are broadly categorized into three types: leading, lagging, and coincident indicators. Understanding these categories is crucial for interpreting how they relate to market trends.
- Leading Indicators: These indicators predict future economic activity. They change before the economy starts to follow a particular pattern, providing early signals of economic direction. Examples include stock market returns, the consumer sentiment index, and new business startups.
- Lagging Indicators: These indicators reflect changes that have already occurred in the economy. They confirm long-term trends but do not predict them. Examples include unemployment rates, corporate profits, and labor cost per unit of output.
- Coincident Indicators: These indicators move in line with the overall economy. They provide a snapshot of the current state of economic activity. Examples include GDP, industrial production, and retail sales.
Key Economic Indicators for Market Analysis
With hundreds of thousands of economic indicators in existence, identifying the most impactful ones can be challenging…if not overwhelming. Here, we focus on some of the most critical indicators that financial advisors should monitor.
GDP Growth Rates
Gross Domestic Product (GDP) growth rates are a primary indicator of economic health. GDP measures the total value of goods and services produced over a specific period. A growing GDP indicates a healthy economy, suggesting that businesses are performing well and consumer spending is strong. Conversely, a declining GDP signals economic trouble, potentially leading to reduced corporate profits and stock market declines.
Employment Figures
Employment figures, including the unemployment rate and nonfarm payrolls, are crucial for understanding economic performance. High employment levels typically lead to increased consumer spending, which drives economic growth. Conversely, high unemployment can lead to reduced consumer confidence and spending, slowing economic activity.
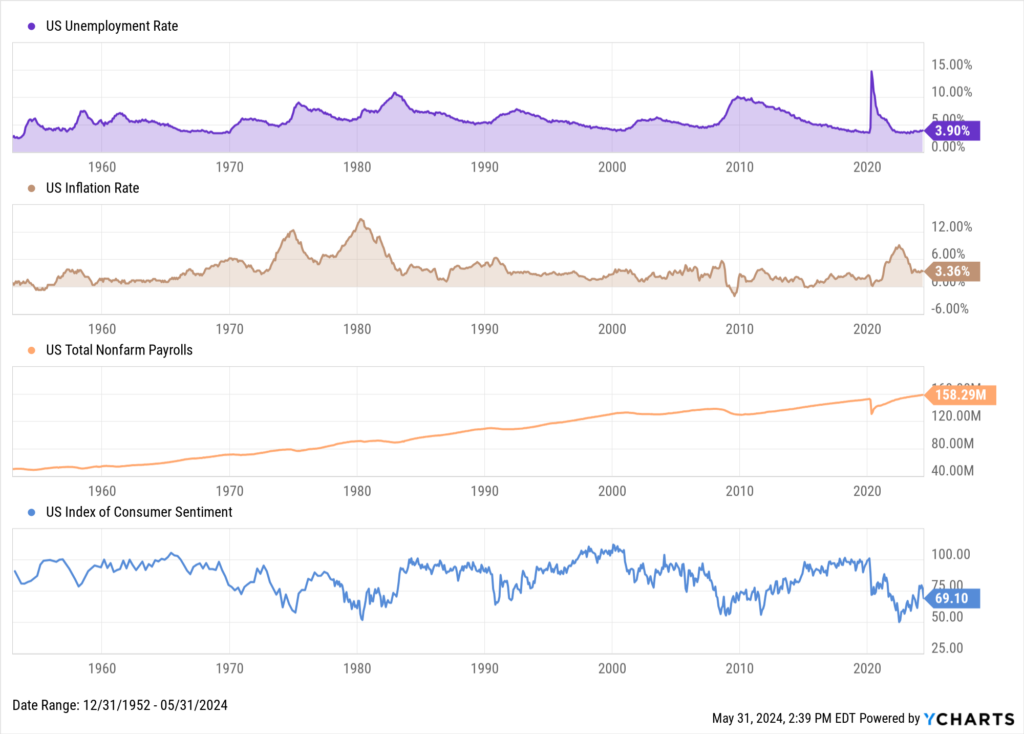
Download Visual | Modify in YCharts
Consumer Price Index (CPI)
The Consumer Price Index (CPI) measures inflation by tracking changes in the prices of a basket of goods and services. Inflation affects purchasing power and can influence interest rates. Central banks, such as the Federal Reserve, monitor CPI closely to adjust monetary policy. High inflation tends to lead to higher interest rates, which can impact borrowing costs and investment returns.
Federal Funds Rate
The Fed Funds Rate is the rate set by the FOMC (Federal Open Market Committee) for banks to borrow funds from each other. The Fed Funds Rate is important because it can act as the benchmark to set other rates, including fixed income yields, mortgage rates, and savings account rates. Rate adjustments issued by the central bank can have a significant impact on client holdings and an investment committee’s decisions.
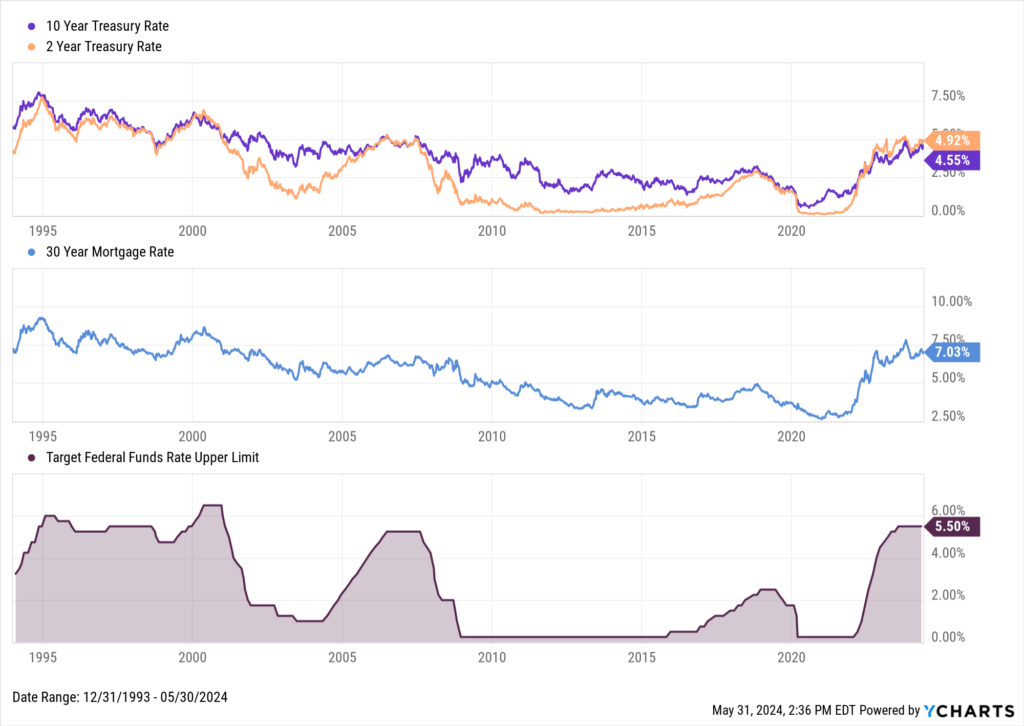
Download Visual | Modify in YCharts
Using YCharts to Track Economic Indicators
In today’s data-driven world, having the right tools to analyze economic indicators is essential. YCharts offers a comprehensive suite of features designed to help financial advisors cut through the hundreds of thousands of economic indicators, monitor the ones most important to them, and effectively generate insights from economic data.
Best Tools and Features for Monitoring the Economy
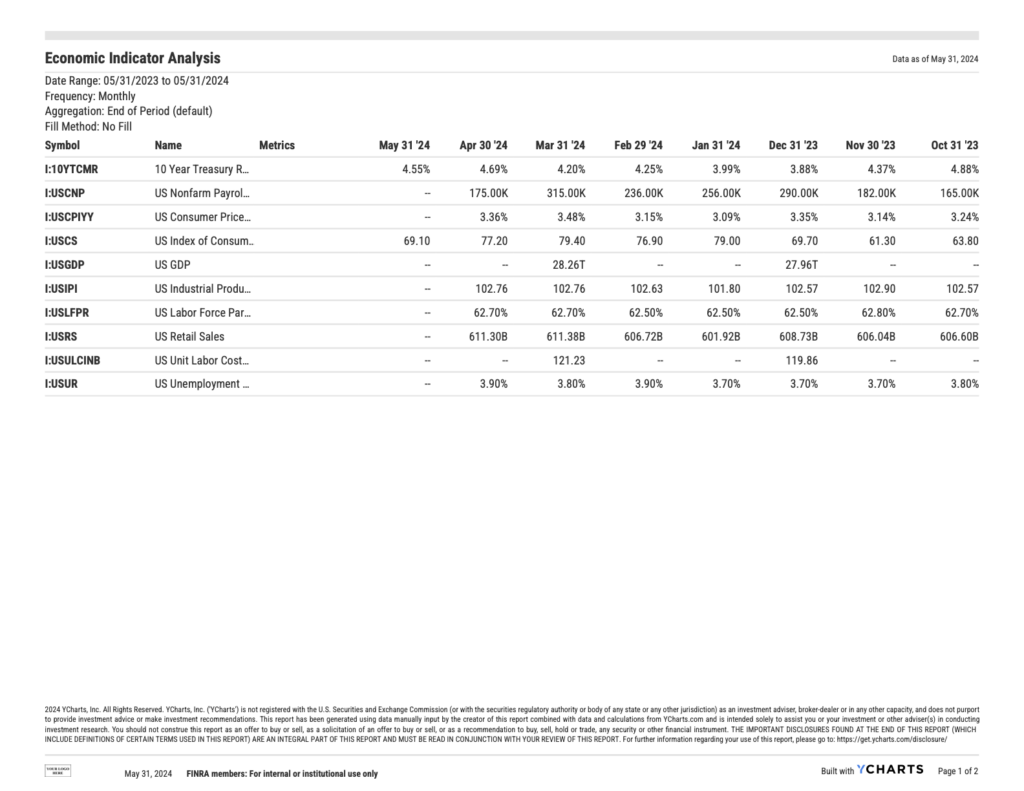
YCharts provides intuitive tools such as the Dashboard, Comp Tables, and Timeseries Analysis to track and analyze a wide range of economic indicators. The platform allows users to create customized dashboards that display real-time data, making it easy to monitor key metrics at a glance. Table tools deliver efficient comparison of multiple indicators across custom time periods, and can be exported to the Excel Add-in for automated analysis or a PDF for further discussion among an investment committee.
Real-time Data and Alerts
One standout benefit of YCharts is its ability to provide real-time updates and alerts on economic indicators. Watchlists are available for adding dozens of data points that can be monitored on a single screen. This capability ensures that advisors can react promptly to changes in economic conditions, making timely decisions that can enhance portfolio performance. Set criteria-based alerts and be notified when an economic indicator triggers that criteria, either by email or on the platform directly.
Integrating Economic Indicators into Portfolio Management
Making Strategic Decisions Based on Economic Trends
Understanding and interpreting economic indicators can significantly influence portfolio management strategies. For example, if indicators suggest an impending economic downturn, advisors may look to shift toward more defensive investments, such as utilities or consumer staples. Conversely, during periods of economic expansion, advisors might increase exposure to growth-oriented sectors like technology or consumer discretionary.
Case Studies
Historical examples underscore the importance of economic indicators in shaping investment strategies. For instance, during the 2008 financial crisis, leading indicators such as the stock market and consumer sentiment indices began to decline well before the full impact of the crisis was felt. Advisors who heeded these early warning signs were better positioned to protect their clients’ assets.
Many YCharts users have shared their own success stories using the platform’s vast data library. Caleb Silver, Editor-in-Chief of Investopedia, primarily uses YCharts for his data needs.
Advanced Techniques and Future Trends
Predictive Analytics and Economic Forecasting
The integration of advanced statistical techniques and predictive models into economic analysis is transforming the financial advisory landscape. Predictive analytics uses historical data to forecast future trends, providing advisors with a more proactive approach to portfolio management.
The Role of AI and Machine Learning
Emerging technologies like artificial intelligence (AI) and machine learning are revolutionizing economic analysis. These technologies can process vast amounts of data at unprecedented speeds, uncovering patterns and insights in a fraction of the time versus manual human analysis. As AI and machine learning continue to evolve, they will likely become indispensable tools for financial advisors, offering even more precise and timely economic forecasts while saving valuable time along the way.
For more on how advisors can combine YCharts with AI tools such as ChatGPT to enhance client relationships, check out ”Revolutionizing Client Relationships: A Guide to Using ChatGPT and YCharts for Financial Advisors”
Conclusion
Economic indicators are vital tools for financial advisors, offering insights that can help predict market trends and guide investment strategies. By leveraging platforms like YCharts, advisors can access real-time data and intuitive tools to enhance their economic analysis. As the process of economic data analysis continues to evolve with advancements in predictive analytics and AI, staying on top of these developments will be crucial for financial advisors to maintain a competitive edge.
For research-focused advisors, integrating economic indicators into your analytical arsenal is not just beneficial—it is essential. Embrace these tools and techniques to navigate the complexities of market trends with confidence, ensuring that your investment strategies are both informed and effective.
Whenever you’re ready, there are 3 ways YCharts can help you:
1. Looking to better communicate the importance of economic events to clients?
Send us an email at hello@ycharts.com or call (866) 965-7552. You’ll be directly in touch with one of our Chicago-based team members.
2. Want to test out YCharts for free?
Start a no-risk 7-Day Free Trial.
3. See YCharts’ economic indicator library in action:
Schedule a personalized information session.
Disclaimer
©2024 YCharts, Inc. All Rights Reserved. YCharts, Inc. (“YCharts”) is not registered with the U.S. Securities and Exchange Commission (or with the securities regulatory authority or body of any state or any other jurisdiction) as an investment adviser, broker-dealer or in any other capacity, and does not purport to provide investment advice or make investment recommendations. This report has been generated through application of the analytical tools and data provided through ycharts.com and is intended solely to assist you or your investment or other adviser(s) in conducting investment research. You should not construe this report as an offer to buy or sell, as a solicitation of an offer to buy or sell, or as a recommendation to buy, sell, hold or trade, any security or other financial instrument. For further information regarding your use of this report, please go to: ycharts.com/about/disclosure
Next Article
Monthly Market Wrap: May 2024Read More →