What is YCharts? A Comprehensive Guide to the Leading Investment Research Platform
Introduction to YCharts
YCharts is a cloud-based investment research and client communication platform, purpose-built for financial professionals such as wealth advisors, asset managers, and institutional teams. Since its launch in 2009, YCharts has developed a strong reputation for simplifying investment processes and enabling smarter decision-making with its expansive data universe, visualization tools, and user-friendly interface.
Whether you’re optimizing portfolios or creating client reports, YCharts provides access to detailed financial data, in-depth analysis tools, and report-building capabilities. It’s designed to help financial professionals save time, deepen client relationships, and boost overall performance.
Key Features of YCharts
1. Comprehensive Data Universe
YCharts provides access to a massive database that includes:
- 30,000+ stocks and 75,000+ mutual funds and ETFs, sourced from institutions like Morningstar.
- Nearly 10,000 Separate Managed Accounts (SMAs) with detailed performance metrics.
- 500,000+ economic indicators sourced from trusted institutions such as the Federal Reserve and Bureau of Labor Statistics.
- Detailed financial metrics and data, including historical performance, revenue, earnings, and analyst recommendations, for equities, funds, and bonds.
With YCharts, you can easily tap into global economic data and financial metrics that support investment research and portfolio management.
2. Customizable Dashboards
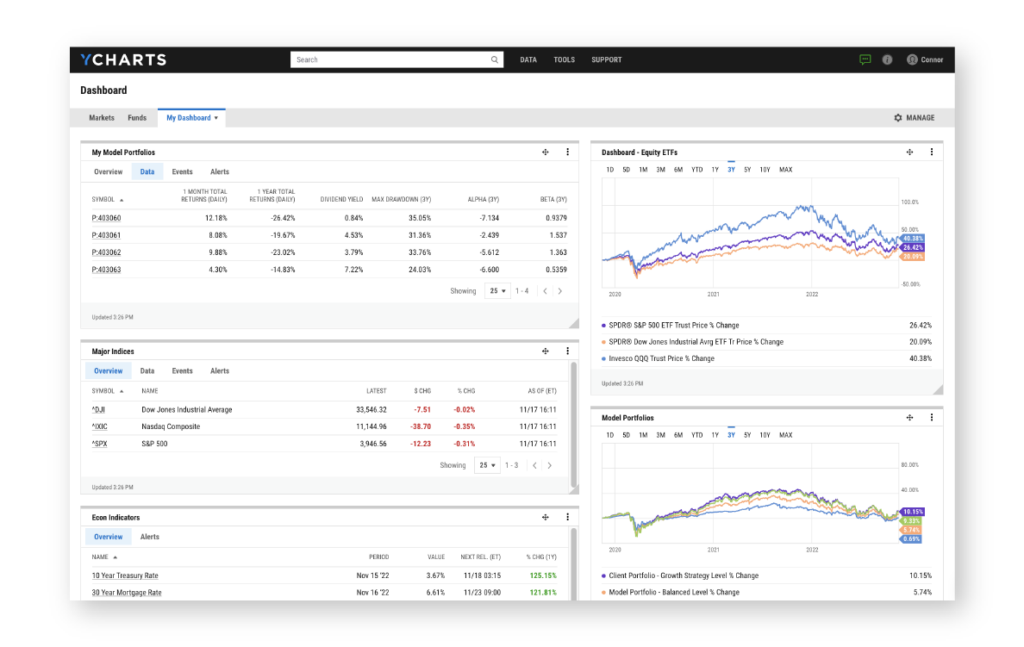
YCharts enables users to build custom dashboards that provide real-time insights across multiple portfolios and investment strategies. Advisors can tailor dashboards to:
- Track portfolio performance against benchmarks.
- Monitor economic trends and performance metrics.
- Identify potential risks or opportunities across multiple assets.
These dashboards simplify how professionals view, compare, and present market data to clients, ensuring the most critical data points are always accessible.
3. Advanced Portfolio Management Tools
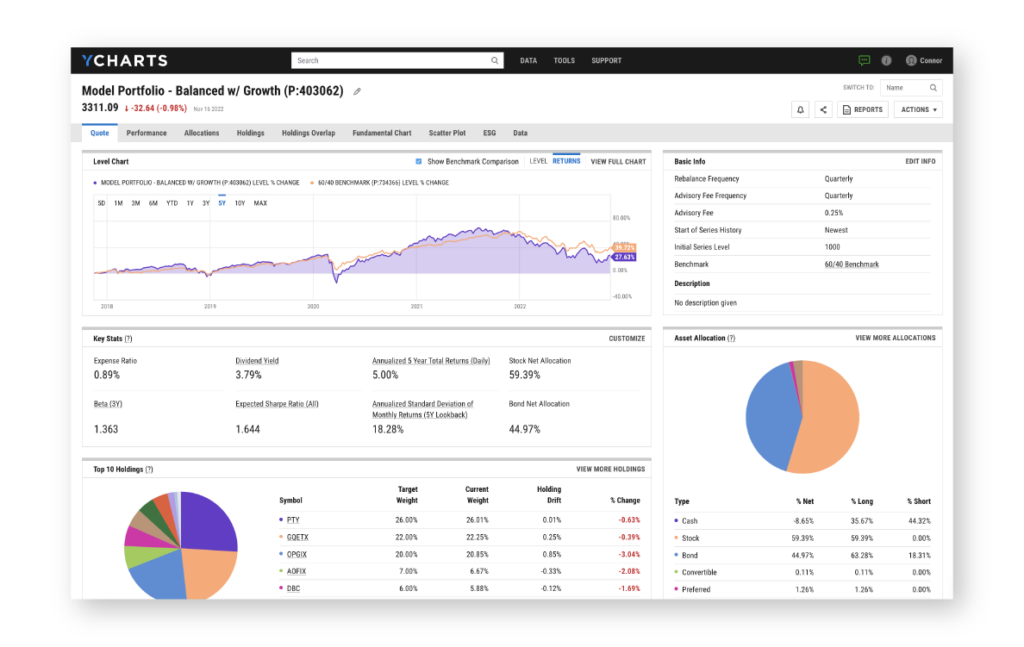
YCharts offers a suite of portfolio management tools that help advisors:
- Build and analyze portfolios: Use customizable screeners and performance metrics to build model portfolios aligned with client risk tolerance and goals.
- Optimize performance: Run stress tests, scenario analyses, and attribution models to assess the potential impact of market changes.
Compare strategies: Easily compare your models against competitor funds or client portfolios to show superior performance metrics.
These features not only streamline portfolio analysis but also make it easier to justify recommendations to clients using detailed data-backed insights.
4. Visualization & Charting Tools
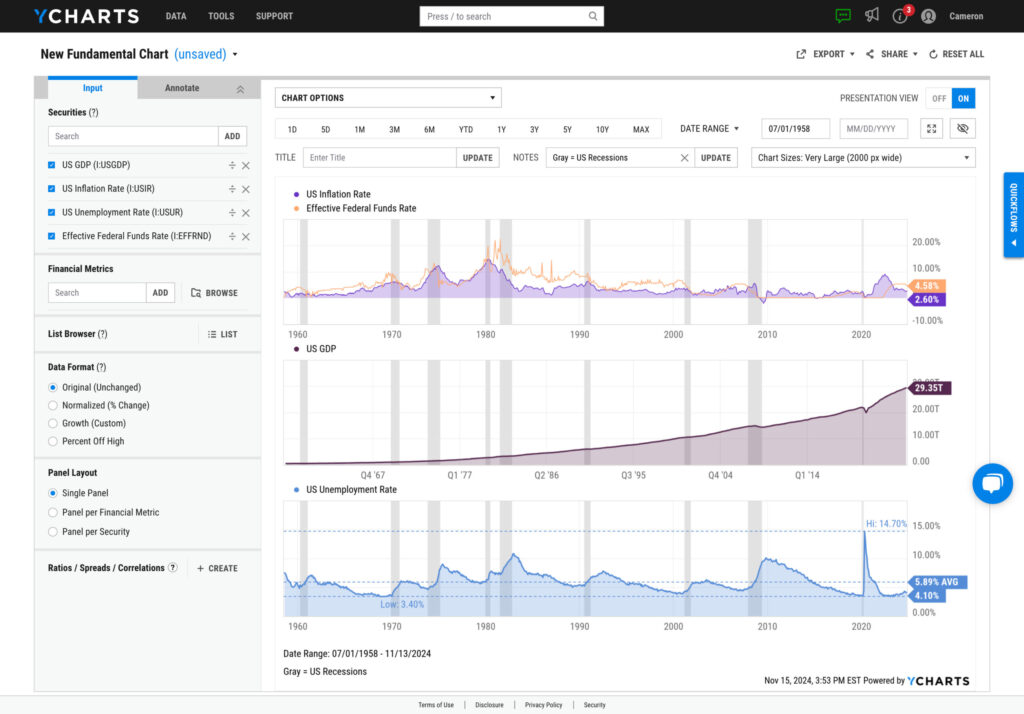
YCharts is widely known for its intuitive, highly customizable charting tools. Users can create powerful visual representations of:
- Stock trends, mutual fund comparisons, and market movements.
- Financial metrics like P/E ratios, revenue growth, and sector allocations.
- Economic data like inflation trends, interest rates, or consumer sentiment.
These charts help bring investment insights to life, providing clarity to clients on how certain trends may affect their portfolios. Plus, YCharts allows for firm branding, so every chart, report, or visual created can carry your firm’s logo and design.
5. Client Communication & Report Generation
YCharts simplifies the process of generating professional, detailed reports for clients. The platform offers:
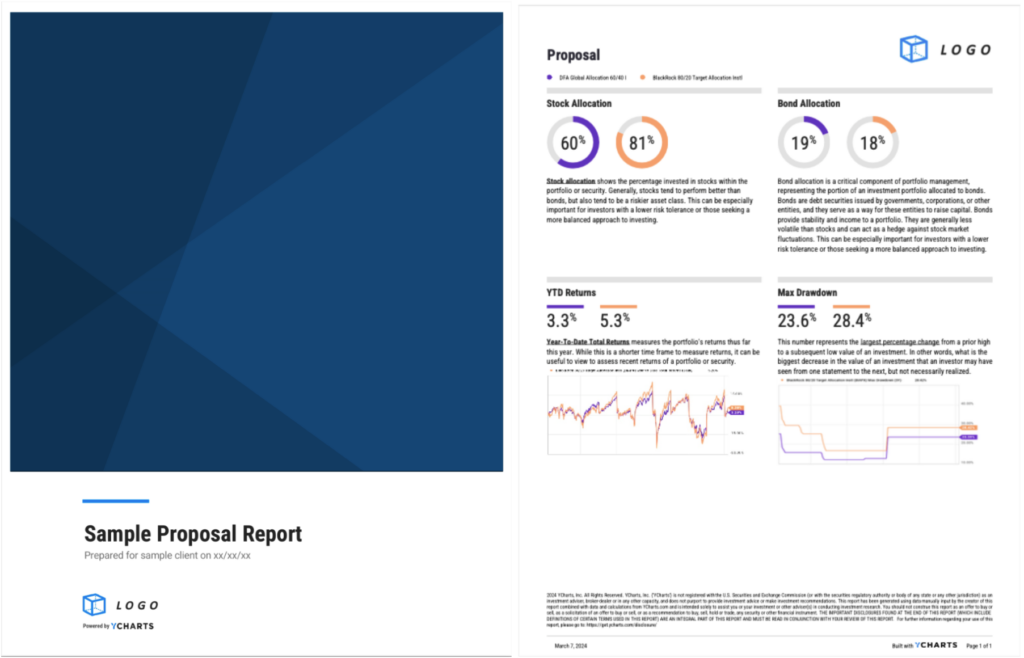
- Client-facing proposals and performance reports: Present side-by-side comparisons of client portfolios against benchmarks or other strategies.
- Client meeting preparation: Equip yourself with tailored, visually engaging reports that summarize portfolio performance, risk analyses, and market trends.
Pre-built templates: Use pre-built, compliance-ready templates to accelerate the report-building process, ensuring you deliver high-quality insights quickly.
6. Time-Saving Tools
YCharts offers Quickflows, a feature that automates common workflows, like running analyses or creating reports. This feature saves advisors significant time by reducing repetitive tasks and allowing them to focus more on strategy and client communication.
Benefits of Using YCharts
1. Informed Decision-Making
With access to a broad dataset covering equities, funds, economic indicators, and performance metrics, YCharts equips financial professionals with the insights they need to make better, data-driven decisions.
2. Time Efficiency
YCharts dramatically reduces the time spent on researching investments, running comparisons, and building client reports. With automated tools and pre-built templates, financial professionals can focus more on client relationships and strategy execution.
3. Enhanced Client Communication
Through its customizable visuals and detailed reports, YCharts allows advisors to simplify complex financial data, making it easier for clients to understand market movements, portfolio performance, and investment strategies.
4. Brand Customization
By allowing firm-specific branding on every chart, report, or proposal, YCharts strengthens your brand’s presence while ensuring your insights remain polished and professional.
Why YCharts is a Leader in the Industry
YCharts stands out as a comprehensive platform for financial advisors and asset managers, providing an all-in-one solution for data access, portfolio management, and client communication. Its ability to offer in-depth analysis, custom visualizations, and simplified reporting tools makes it an essential part of the modern financial advisor’s toolkit.
Compared to other platforms, YCharts excels in:
- Ease of use: YCharts offers an intuitive platform with a less steep learning curve compared to more complex tools like Bloomberg.
- Affordability: YCharts is more accessible from a cost perspective, especially for smaller firms and independent advisors.
Customization: The ability to brand charts and reports offers a unique competitive edge.
Conclusion: Is YCharts Right for You?
YCharts is the perfect tool for financial professionals seeking to enhance their research capabilities, optimize portfolio performance, and communicate more effectively with clients. Whether you’re a financial advisor, portfolio manager, or asset manager, YCharts offers a comprehensive solution for analyzing markets, managing portfolios, and simplifying complex financial data for clients.
Whenever you’re ready, there are 3 ways YCharts can help you:
1. Looking to better communicate the importance of economic events to clients?
Send us an email at hello@ycharts.com or call (866) 965-7552. You’ll be directly in touch with one of our Chicago-based team members.
2. Want to test out YCharts for free?
Start a no-risk 7-Day Free Trial.
3. Download a copy of the Quarterly Economic Update slide deck:
Download the Economic Summary Deck:Disclaimer
©2024 YCharts, Inc. All Rights Reserved. YCharts, Inc. (“YCharts”) is not registered with the U.S. Securities and Exchange Commission (or with the securities regulatory authority or body of any state or any other jurisdiction) as an investment adviser, broker-dealer or in any other capacity, and does not purport to provide investment advice or make investment recommendations. This report has been generated through application of the analytical tools and data provided through ycharts.com and is intended solely to assist you or your investment or other adviser(s) in conducting investment research. You should not construe this report as an offer to buy or sell, as a solicitation of an offer to buy or sell, or as a recommendation to buy, sell, hold or trade, any security or other financial instrument. For further information regarding your use of this report, please go to: ycharts.com/about/disclosure
Next Article
Debunking Investing MythsRead More →