Monthly Market Wrap: September 2025

Welcome back to YCharts’ Monthly Market Wrap, your data-driven recap of market trends shaping portfolios and client conversations. This September, markets advanced across the board, with the S&P 500 delivering its strongest September in 15 years. Growth sectors led, highlighted by a rebound in technology. A cooling labor market persisted, but the Fed’s first rate cut of the year boosted confidence and helped spark housing activity. Meanwhile, treasury yields eased, as gold reached new all-time highs.
Want to use these visuals in your own presentations? Download our free Monthly Market Wrap slide deck, containing all charts featured in the Market Wrap and more in a shareable, presentation-ready format.
Market Summary: Tech & Emerging Markets Lead, Housing Stimulated, Labor Softens as Fed Cuts Rates
Markets moved higher across the board, as the S&P 500 posted its best September month in 15 years, gaining 3.7%. In what has historically been the worst month for stocks, every major index posted gains, led by emerging markets, which increased by 7.2%. September’s broad-based gains reflect improved investor confidence, as the Fed cut interest rates for the first time this year.
Sector performance was split in September, with Technology leading the way, bouncing back from a negative August, advancing over 7.5%. Consumer Staples, Materials, and Energy all went negative, with Financials virtually flat at 0.1% in September.
The U.S. labor market continued to weaken as the unemployment rate ticked up to 4.3%, and just 22,000 jobs were added to the economy, missing expectations for the fourth month straight. The Fed Funds Rate was cut by 25 basis points, an anticipated move that sparked early signs of stimulation in the housing market. US New Single-Family Home Sales spiked up 20.48% as mortgage rates declined, leaving the 30-year at 6.3% to end September.
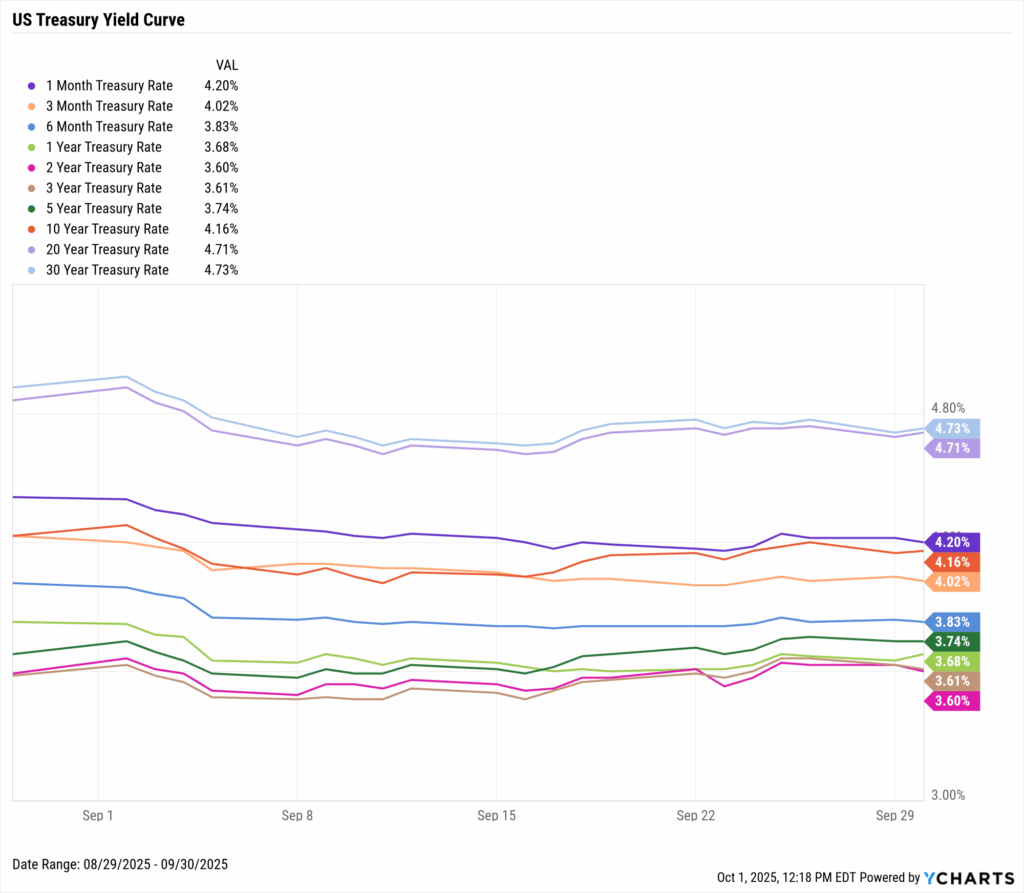
Treasury yields declined across the ends of the curve in September, though the 2-year, 3-year, and 5-year all increased slightly. One of the most significant drops came from the 30-year, down 19 basis points to 4.73%, reflecting market expectations of slower growth and easier policy conditions after the Fed lowered its target range.
Jump to Fixed Income Performance
Want to create your own monthly recap, complete with these charts in a presentation deck that contains your firm’s branding? Start a Free Trial →
Off the YCharts! Fed Rate Cuts Take Effect
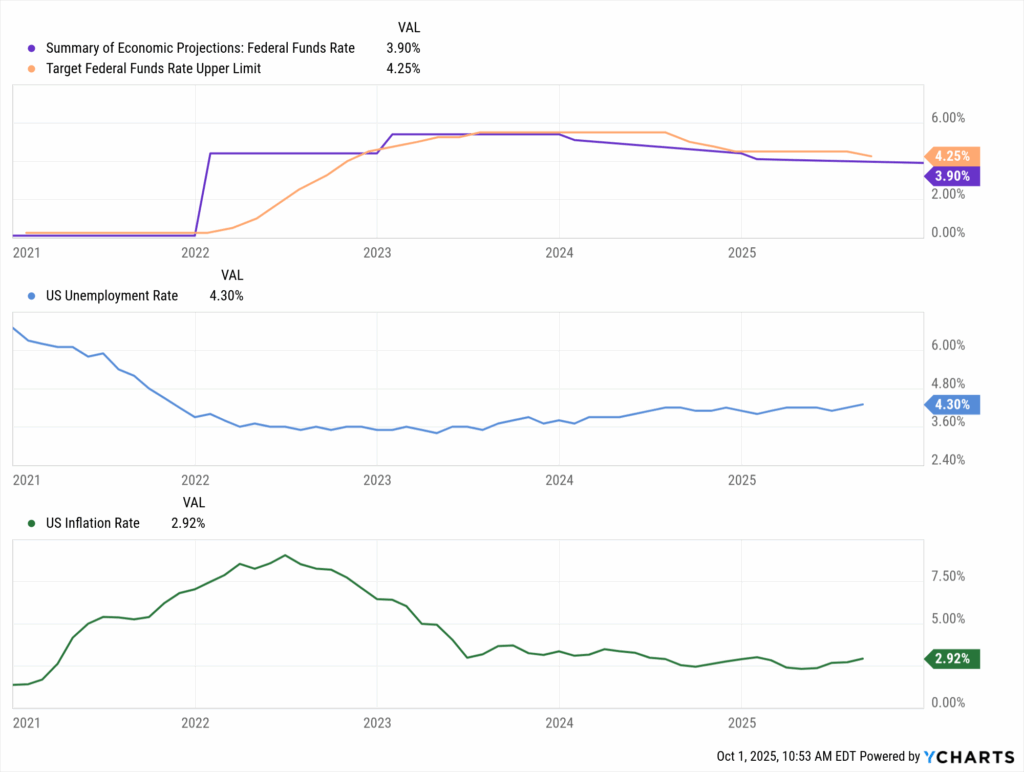
September delivered the Fed’s first rate cut of the year, lowering the target range to 4.00%–4.25%. After months of anticipation, markets were relatively unreactive as the S&P 500 advanced half a percent in the first week following the move, reflecting how well expectations had already been priced in.
The labor market continued to soften in September, while inflation ticked slightly higher to 4.3%. In his remarks following the FOMC decision, Chair Jerome Powell noted, “Risks to inflation are tilted to the upside, and risks to employment are tilted to the downside, a challenging situation.” The updated dot plot shows policymakers projecting two additional cuts in 2025, signaling a continued path toward policy normalization.
Download Visual | Modify in YCharts
This shift underscores the importance of monitoring more than just equity markets. While growth sectors have led recent gains, a changing rate path may alter relative performance and create new opportunities across asset classes. Advisors should consider how fixed income, real estate, and other rate-sensitive areas might respond.
At the same time, clients will seek clarity on how lower rates affect their day-to-day financial decisions. From mortgage affordability to borrowing costs and portfolio income, advisors can differentiate themselves by making these impacts tangible. YCharts’ Fed Rate Cut Deck offers deeper insight into the whole cycle and its implications, with client-ready visuals to guide these conversations.
Equity Performance: Technology and Communication Drive Growth Stocks Higher, Emerging Markets Soar
Major Indices
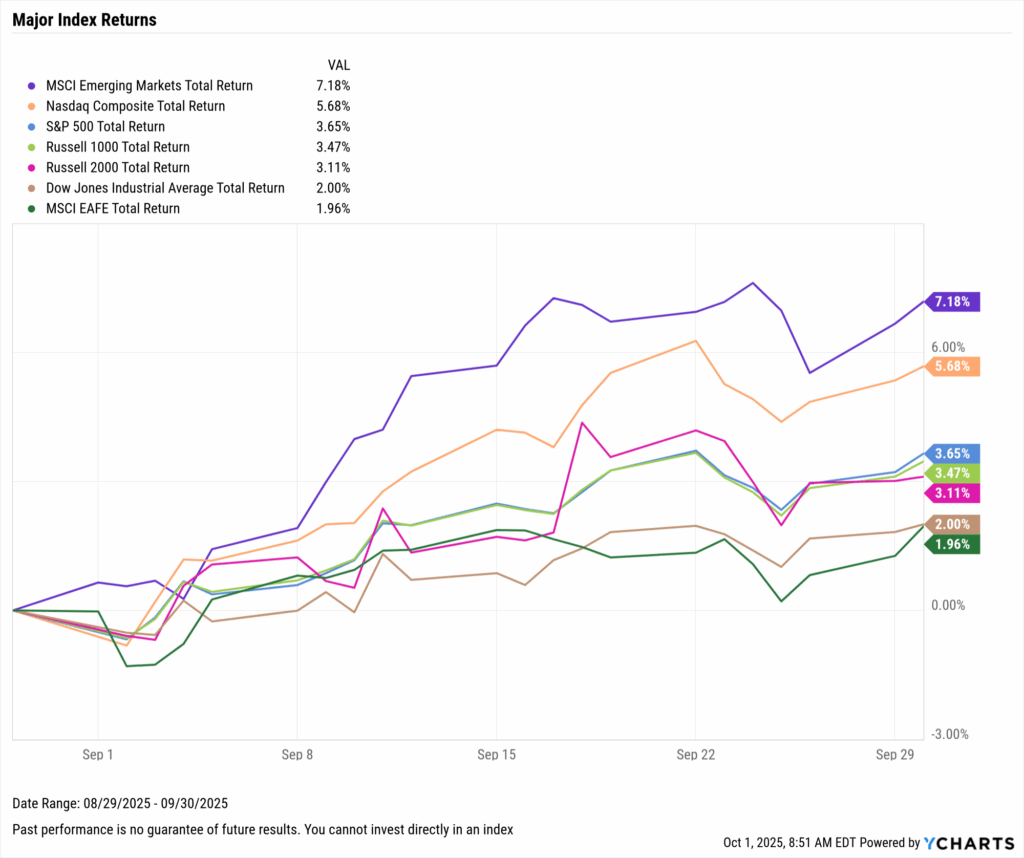
Download Visual | Modify in YCharts | View Below Table in YCharts
Value vs. Growth Performance
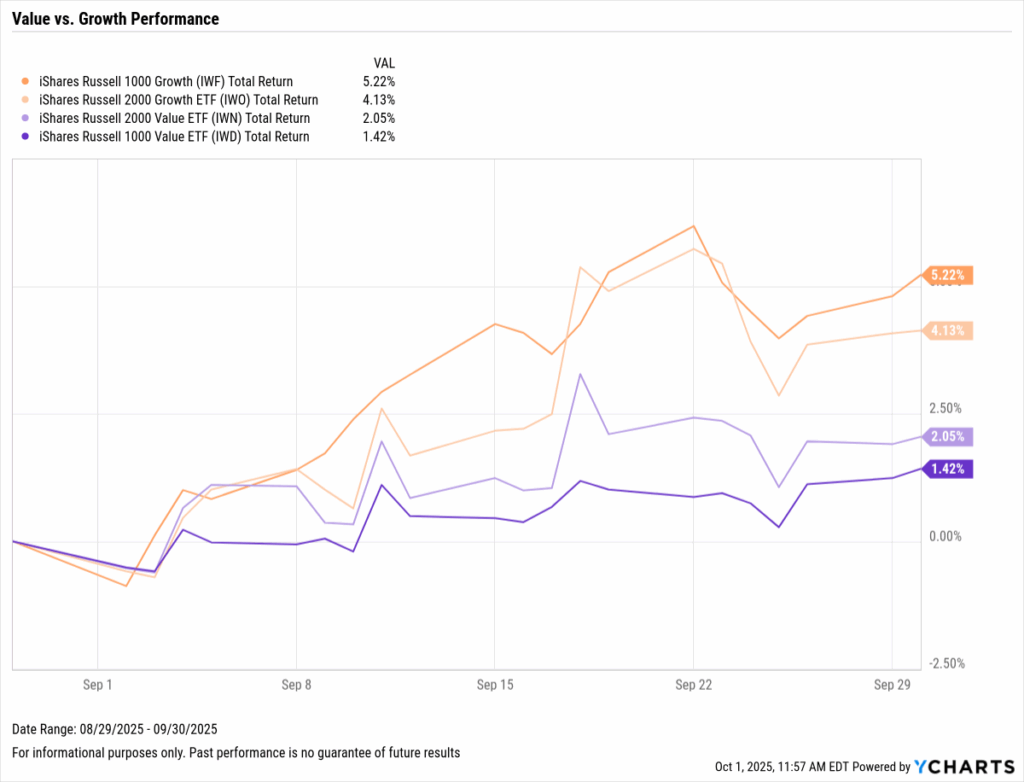
Download Visual | Modify in YCharts | View Below Table in YCharts
US Sector Movement
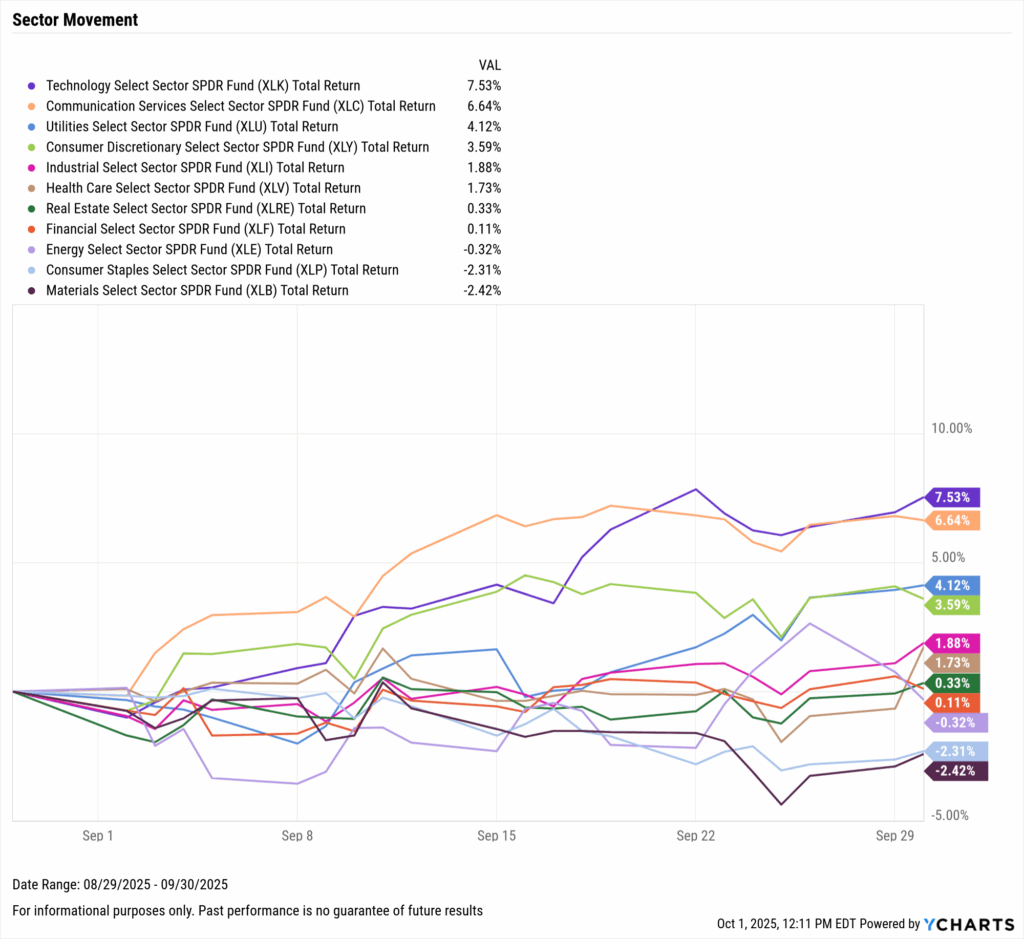
Download Visual | Modify in YCharts | View Below Table in YCharts
Hot Stocks: Top 10 S&P 500 Performers of September 2025
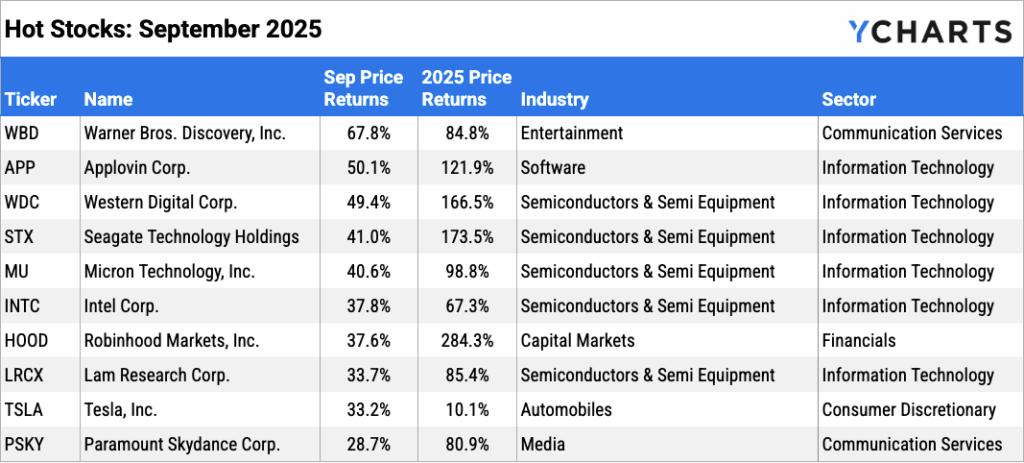
Download Visual | Modify in YCharts
Laggards & Losers: 10 Worst S&P 500 Performers of September 2025
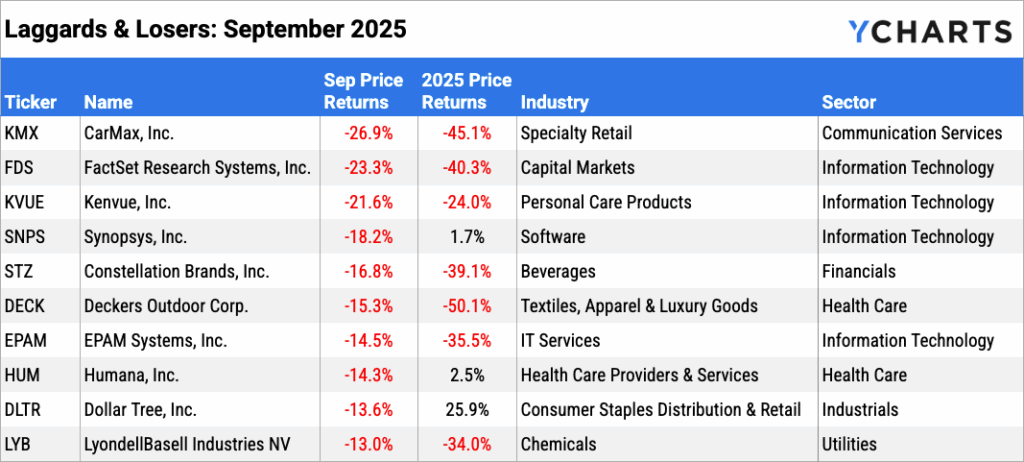
Download Visual | Modify in YCharts
Featured Market News and YCharts Insights
Year-End Tax Planning That Turns Success Into Client Readiness
ETF Share Classes: Why They’ll Matter for Portfolios and Taxes
Financial Plan vs. Investment Plan: Why Illustrating the “How” is the Key to Organic Growth
The Housing Market & Interest Rates: Understanding the Ripple Effect
Best Performing Mutual Funds of the Last 10 Years: A Financial Advisor’s Perspective
How Financial Stocks Navigate Falling Rate Cycles
Economic Data Overview: Softening Labor Market Key to Fed Rate Cut, Housing Market Shows Signs of Recovery
Employment
The unemployment rate ticked up once again to 4.3%, as did the labor force participation rate for the first time in five months, up to 62.3%. As of the latest available August nonfarm payrolls report, just 22,000 jobs were added to the U.S. economy. This falls below the modest Dow Jones estimate of 75,000, marking the fourth consecutive month of missed expectations, as the labor market continues to slow down.
Consumers and Inflation
The US inflation rate rose to 2.92% in August, as did core inflation to 3.11%. The US Consumer Price Index rose 0.4% MoM, and US Personal Spending ticked up by 0.62%.
At the September 17th FOMC meeting, the Federal Reserve cut its key Fed Funds Rate target range by 25 basis points to 4.00%-4.25%. Fed Chair Powell pointed to a “shift in the balance of risks” and forecasted two more cuts in 2025. The FedWatch tool now assumes over a 96% chance that the first of these will come when the FOMC meets on October 29th.
Production and Sales
The US ISM Manufacturing PMI increased 0.7 points in August to 48.7, just its second increase of the year. The Services PMI jumped by 1.9 points between July and August to 52.0, its largest gain since December 2024. The YoY US Producer Price Index decreased to 2.6%, as US Retail and Food Services Sales increased slightly MoM, sitting at 0.63% growth for August.
Housing
While US New Single-Family Home Sales spiked drastically by 20.48% in August, Existing Home Sales decreased by 0.25% MoM. The Median Sales Price of Existing Homes fell for the second month in a row by 0.73%, with prices sitting at $422,600. Mortgage rates declined throughout September; the 15-year Mortgage Rate was 5.49% as of September 25th, while the 30-year closed the month at 6.30%.
Commodities
The price of gold increased by 12% to new all-time highs in September, leaving SPDR Gold Shares ETF (GLD) at $355.42 per share. Oil prices increased slightly, with Brent crude up 1.72% for the month to $69 per barrel. WTI was flat, decreasing by 0.14% to $64.27.
Cryptocurrencies
Major cryptocurrencies posted another mixed month. Ethereum cooled down slightly, dropping 3.6%, following a three-month period in which it gained over 73%. Bitcoin increased by 5.1% to $114,309.20 per coin.
Fixed Income Performance: Insights into Bond ETFs and Treasury Yields
US Treasury Yield Curve
1 Month Treasury Rate: 4.20%
3 Month Treasury Rate: 4.02%
6 Month Treasury Rate: 3.83%
1 Year Treasury Rate: 3.68%
2 Year Treasury Rate: 3.60%
3 Year Treasury Rate: 3.61%
5 Year Treasury Rate: 3.74%
10 Year Treasury Rate: 4.16%
20 Year Treasury Rate: 4.71%
30 Year Treasury Rate: 4.73%
Download Visual | Modify in YCharts
Bond Fund Performance
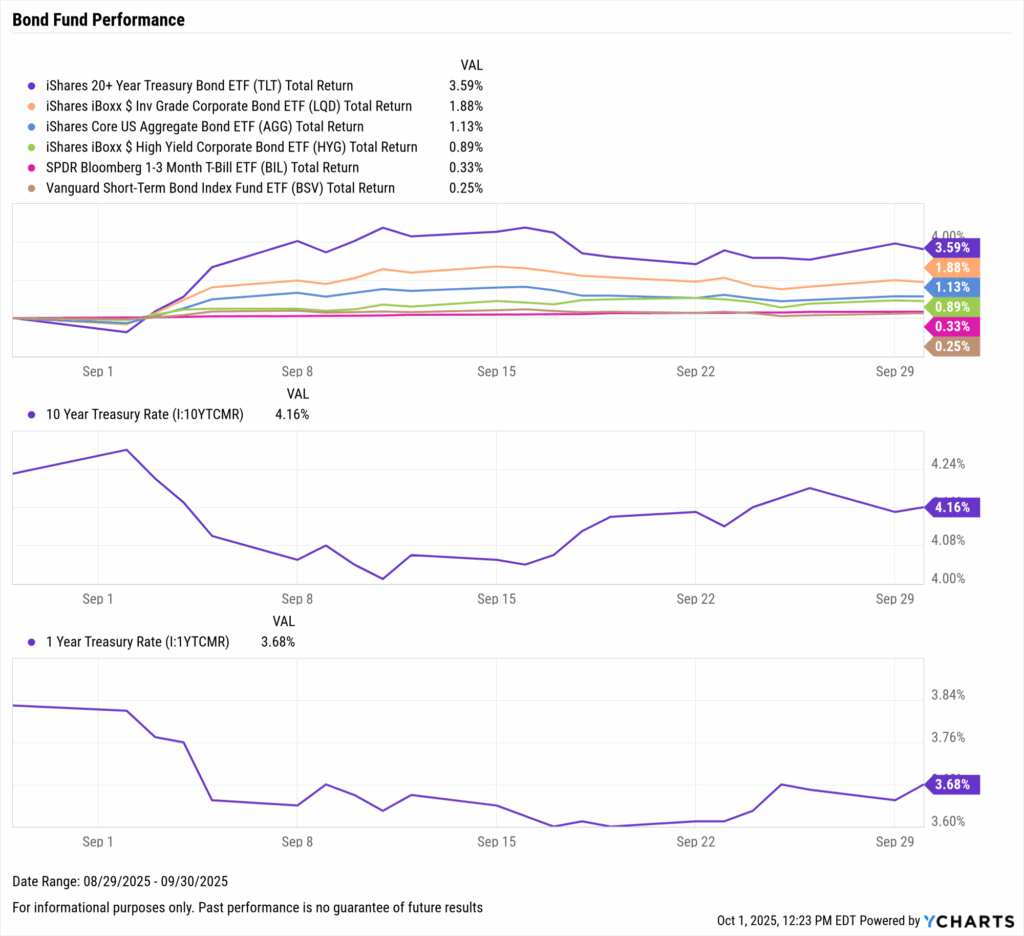
Download Visual | Modify in YCharts | View Below Table in YCharts
As markets head into Q4, monitor how rate cuts ripple through fixed income, housing, and inflation data. Download the visual aids directly from YCharts, and contact us for customized access to these charts.
Have a great October! 📈
Whenever you’re ready, there are three ways YCharts can help you:
1. Looking for a tool to help you better communicate market events?
Email us at hello@ycharts.com or call (866) 965-7552. You’ll be directly in touch with one of our Chicago-based team members.
2. Want to test out YCharts for free?
Start a no-risk 7-Day Free Trial.
3. Download a copy of the Monthly Market Wrap slide deck:
Disclaimer
©2025 YCharts, Inc. All Rights Reserved. YCharts, Inc. (“YCharts”) is not registered with the U.S. Securities and Exchange Commission (or with the securities regulatory authority or body of any state or any other jurisdiction) as an investment adviser, broker-dealer or in any other capacity, and does not purport to provide investment advice or make investment recommendations. This report has been generated through application of the analytical tools and data provided through ycharts.com and is intended solely to assist you or your investment or other adviser(s) in conducting investment research. You should not construe this report as an offer to buy or sell, as a solicitation of an offer to buy or sell, or as a recommendation to buy, sell, hold or trade, any security or other financial instrument. For further information regarding your use of this report, please go to: ycharts.com/about/disclosure
Next Article
ETF Share Classes: Why They’ll Matter for Portfolios and TaxesRead More →