New on YCharts: Scenarios
The Scenarios tool on YCharts enables you to run real-life scenarios, show the impact of withdrawals and contributions, and share better recommendations with your clients.
Choose a portfolio, fund, or any other security and add one-time or ongoing deposits and withdrawals to create a client-friendly visual of the potential impact. To learn more about Scenarios on YCharts, watch or read below!
With the Scenario Builder, advisors and asset managers are equipped with visuals and data that visualize the impact of investment decisions on portfolio value. Lightning fast and easily modified on-the-fly, you can view multiple Scenarios at once and save them to your YCharts account to expedite future meeting prep.
Here are some top use cases to get started:
Compare a Lump Sum Investment vs. Dollar-Cost Averaging
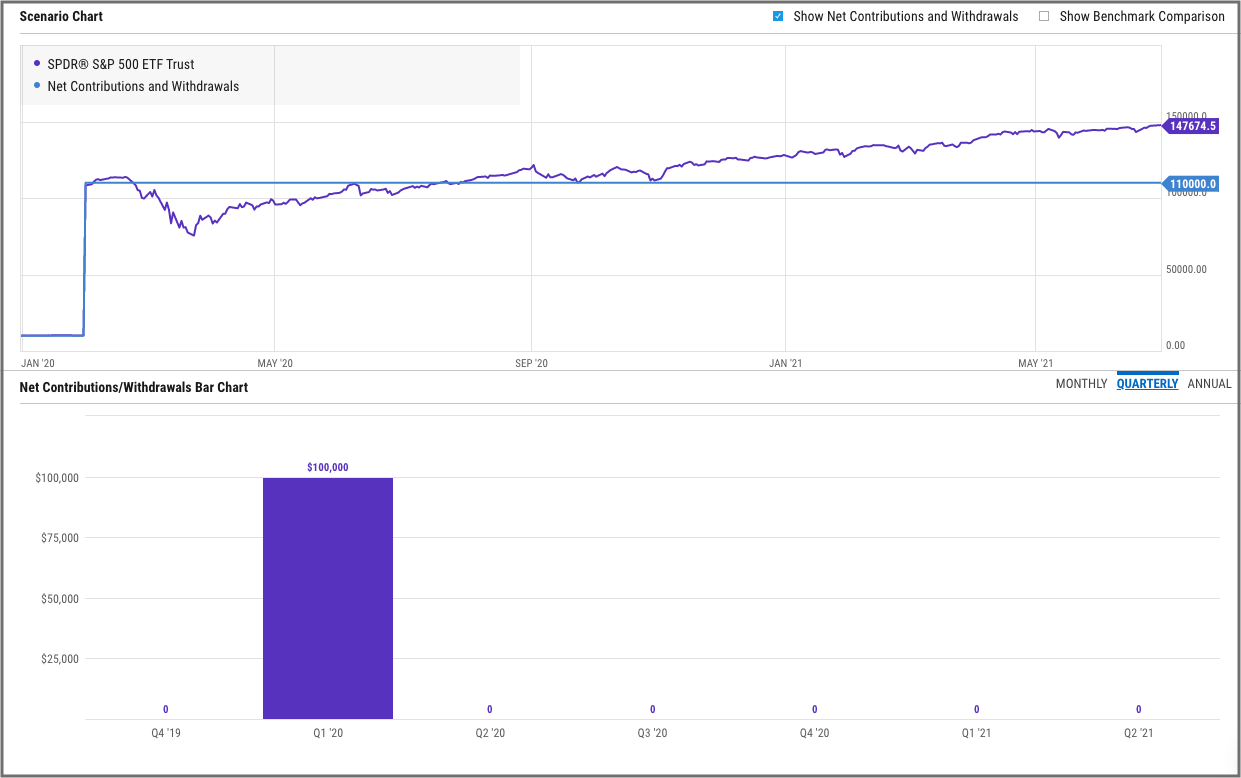
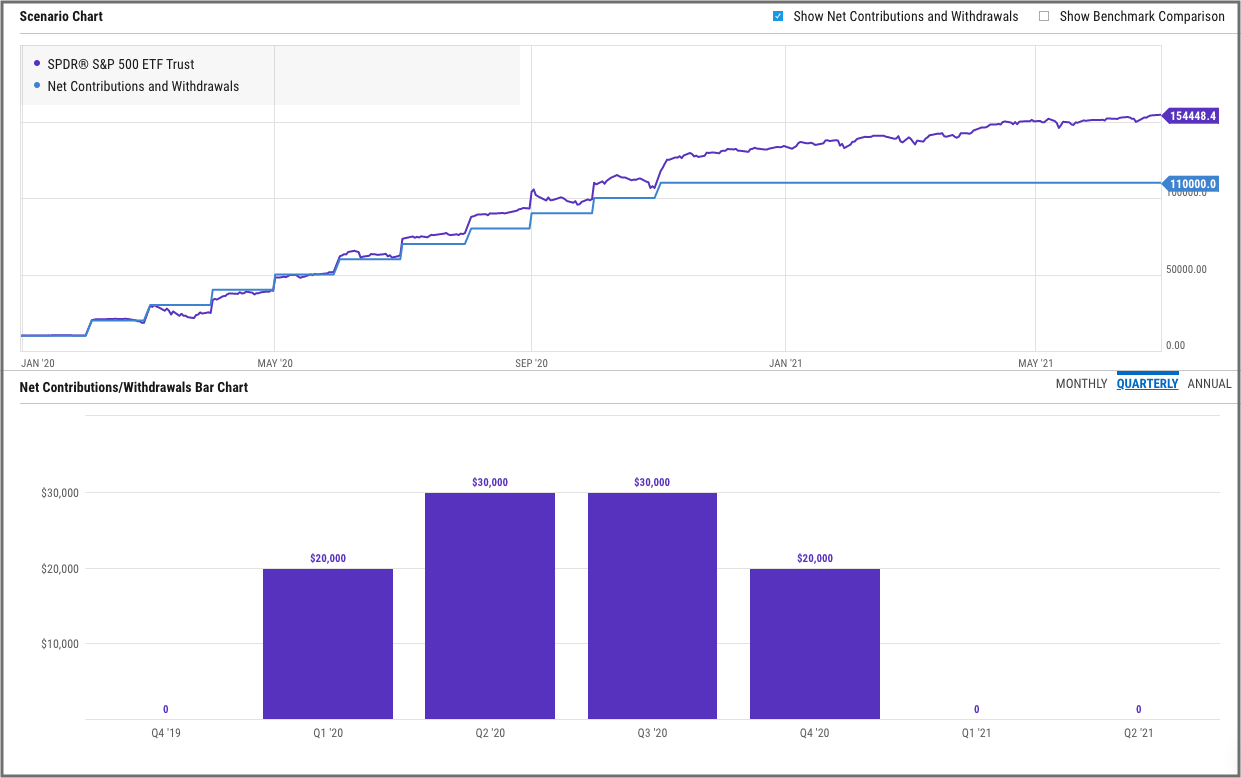
To portray the outcomes from a lump sum investment against a dollar-cost averaging approach, create two different Scenarios using the same portfolio (or other security). The Scenario Chart (line chart) shows the net contributions and withdrawals over time alongside the portfolio’s net performance, while the Net Contributions/Withdrawals Bar Chart below gives a summation of dollars invested in different months, quarters, or years.
For example, while a lump sum investment of $100,000 in early 2020 initially lost value, the market recovered quickly through mid-2021. But…

Dollar-cost averaging through the volatility would have had a significant, positive impact on portfolio value. At least in this scenario, the DCA strategy outperformed.

Show the Benefits of Ongoing Contributions
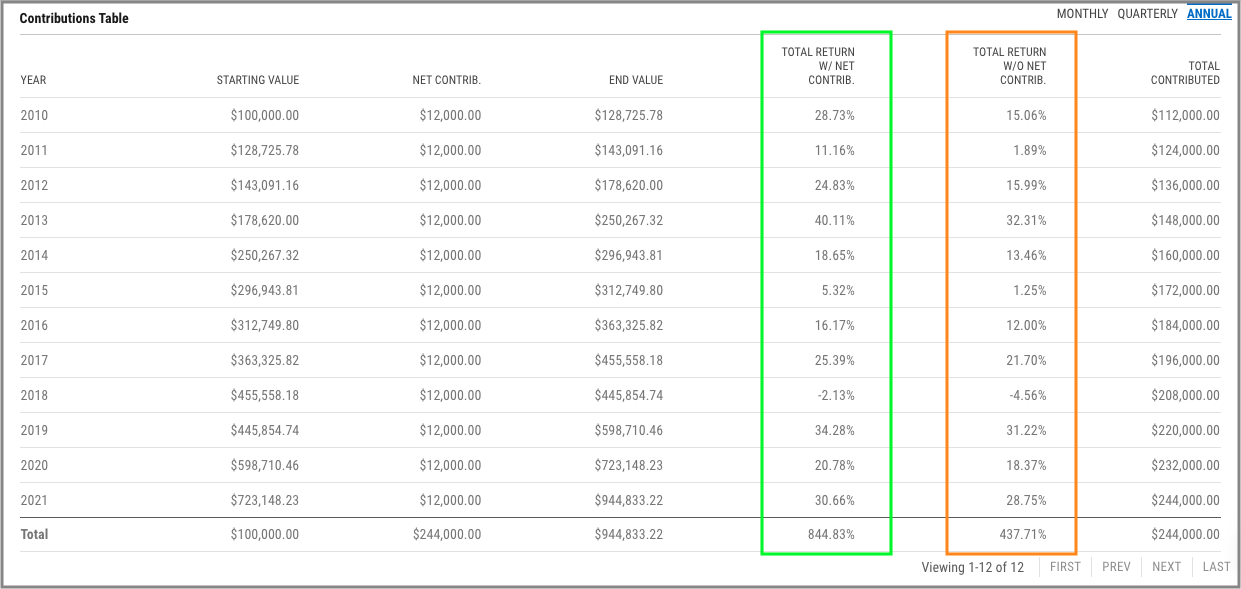
Advisors and their clients often discuss the power of staying invested through all market conditions. Below the line and bar chart, the Contributions Table provides a schedule of each period’s starting and ending value, contributions, and most importantly, those contributions’ impact on a portfolio’s total return.

Discuss the Impact of Major Life Events
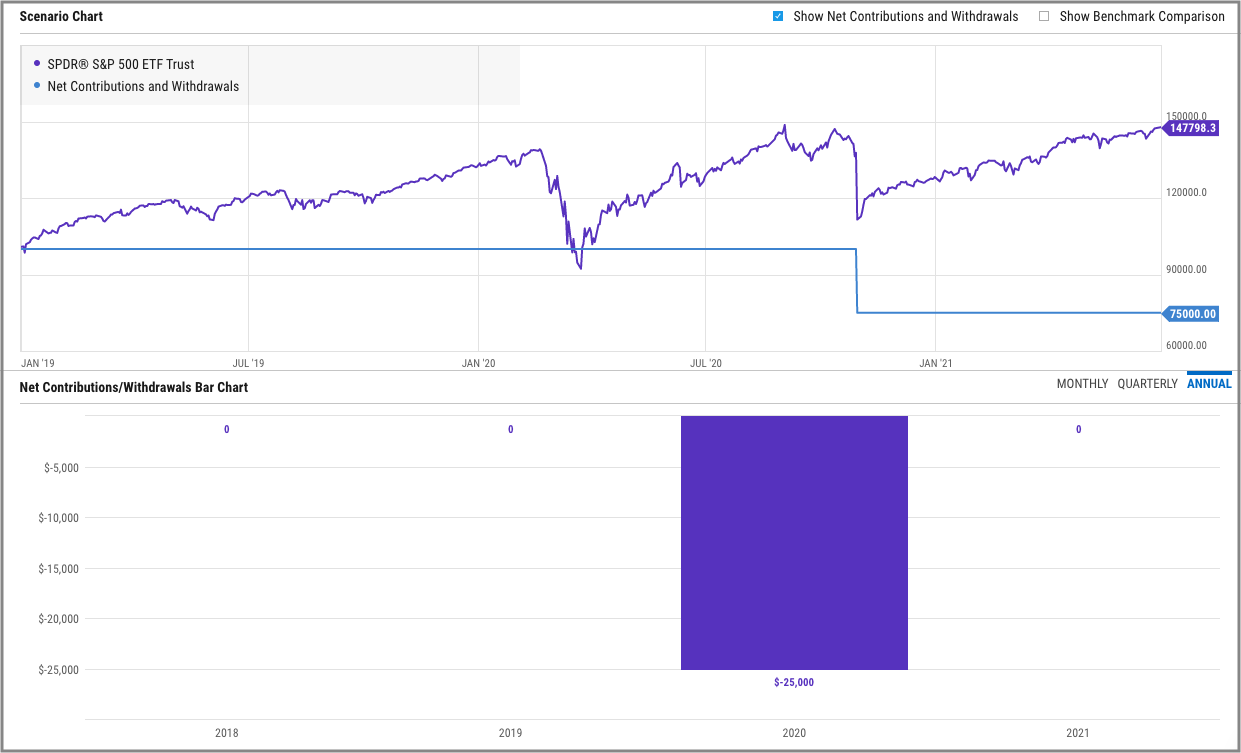
Whether buying a house, celebrating a wedding, or depositing a windfall of cash, “one-time” events can significantly alter your financial picture—and your portfolio’s performance.
Use the Scenario Builder to walk clients through life events, one-time withdrawals, and how they fit into their overall financial plan.

Equip Advisors with Better Collateral for Asset Gathering
To streamline your prep for an upcoming prospect or client check-in meeting, download a copy of the built scenario to provide as a reference. The report includes a Portfolio Summary, Net Contributions/ Withdrawals, and a Contribution/Withdrawals Table to cover all your bases.
Additionally, Scenario modules have been added to YCharts’ Report Builder to further customize your investment reports. To learn more about these features, check out the brief walkthrough below.
Connect with YCharts
To get in touch, contact YCharts via email at hello@ycharts.com or by phone at (866) 965-7552
Interested in adding YCharts to your technology stack? Sign up for a 7-Day Free Trial.
Disclaimer
©2022 YCharts, Inc. All Rights Reserved. YCharts, Inc. (“YCharts”) is not registered with the U.S. Securities and Exchange Commission (or with the securities regulatory authority or body of any state or any other jurisdiction) as an investment adviser, broker-dealer or in any other capacity, and does not purport to provide investment advice or make investment recommendations. This report has been generated through application of the analytical tools and data provided through ycharts.com and is intended solely to assist you or your investment or other adviser(s) in conducting investment research. You should not construe this report as an offer to buy or sell, as a solicitation of an offer to buy or sell, or as a recommendation to buy, sell, hold or trade, any security or other financial instrument. For further information regarding your use of this report, please go to: ycharts.com/about/disclosure
Next Article
Wholesaler Perspective | Overcome the Challenges of Summer Advisor MeetingsRead More →
