Updated Outlook: Consumer Confidence Plunge and Market Impacts

Update as of March 25, 2025 @ 9:30AM CST
Consumer Confidence Plunges to 92.9, Expectations Hit 12-Year Low
The Conference Board released its latest Consumer Confidence report on March 25, 2025, and the numbers are sobering. The Consumer Confidence Index dropped to 92.9, down 7.2 points from February. Most concerning for market participants is the Expectations Index, which fell to 65.2—its lowest level since 2013 and well below the recession-warning threshold of 80.
Key Takeaways for Advisors and Asset Managers:
- Pessimism Deepens: Consumers are more negative on future business conditions, income prospects, and labor markets. Only 16.3% expect income growth, and just 16.7% expect more jobs ahead.
- Recession Signal Strengthens: The Expectations Index at 65.2 is historically correlated with recessions.
- Inflation Worries Persist: 12-month inflation expectations rose from 5.8% to 6.2%, driven by high prices for staples and tariffs.
- Stock Market Sentiment Reverses: For the first time since 2023, more consumers expect stock prices to fall (44.5%) than rise (37.4%).
Consumer Confidence at a Crossroads: Why It Matters Now
Investor focus is turning sharply toward the upcoming release of the Consumer Confidence Index (CCI), with consensus expectations signaling a fourth consecutive monthly decline. As financial professionals, it’s critical to understand the far-reaching implications of consumer sentiment trends—especially when markets are delicately balanced between inflation concerns, rate cut anticipation, and soft-landing hopes.
Consumer sentiment acts as a leading indicator for household spending, which represents over two-thirds of U.S. GDP. A persistent decline in sentiment can preface reduced discretionary spending, softening retail sales, and lower earnings projections—factors that ripple across sectors and portfolios alike.
The next U.S. Consumer Confidence Index (CCI) report is scheduled for release on Tuesday, March 25, 2025, at 10:00 AM Eastern Time. This week’s sentiment release could prove pivotal. Will it confirm a cooling consumer outlook that warrants caution, or will it surprise to the upside and validate continued resilience in the U.S. economy?
Charting the Trend: USCS vs. Market Performance
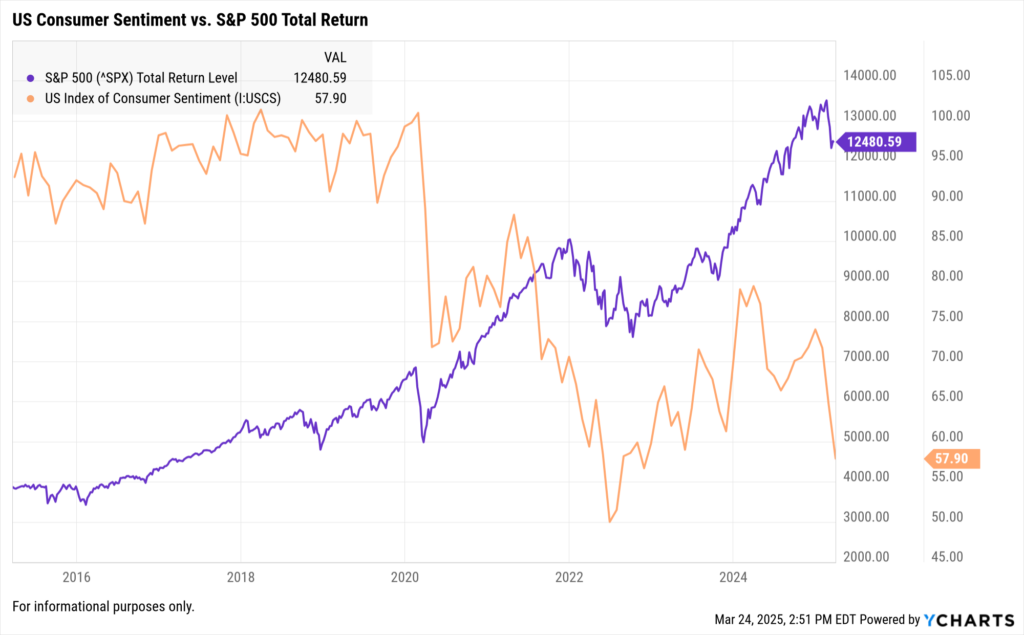
Over the past decade, the Consumer Sentiment Index has shown a consistent relationship with equity market trends. When sentiment climbs, equity markets often follow. Conversely, extended periods of waning consumer optimism tend to foreshadow slower economic activity and increased market volatility.
CSI vs S&P 500 Timeseries
Consumer Sentiment Index (I:USCS)
2015: Sentiment began the year with a solid footing amid steady job growth and low inflation.
2016-2017: Gradual increases reflected growing consumer optimism driven by a strengthening labor market and improving economic indicators.
2018: Sentiment remained elevated as tax reform and low unemployment reinforced positive outlooks.
2019: Trade tensions introduced some volatility, but sentiment levels remained historically high.
2020: The pandemic caused a sharp drop in sentiment, reflecting deep economic uncertainty.
2021: Recovery gained traction as vaccines rolled out and consumer confidence slowly rebounded.
2022: Sentiment declined sharply due to high inflation and aggressive interest rate hikes.
2023-2024: Improved modestly but remained vulnerable to macroeconomic and policy uncertainties.
2025: Sentiment has shown signs of stabilizing, supported by a moderating inflation environment and resilient labor markets.
S&P 500 Index Price (^SPX)
2015: The index began with some volatility but ended the year relatively flat due to economic concerns.
2016-2017: Strong performance, with growth driven by corporate earnings and economic expansion.
2018: Volatility due to trade issues, interest rate hikes, and political tensions, but ended slightly up.
2019: Bullish run with significant gains, supported by monetary easing and positive trade developments.
2020: Initial plunge due to the pandemic, but an impressive recovery followed by year-end, driven by tech stocks and recovery optimism.
2021: Continued to rise, driven by economic reopening and stimulus measures.
2022: Mixed performance, affected by inflation concerns and changing interest rate dynamics.
2023-2024: Experienced moderate growth with occasional pullbacks due to macroeconomic factors.
2025: The market showed positive momentum, supported by economic growth and a stabilizing financial environment.
In 2022, for example, consumer sentiment plunged amid soaring inflation and aggressive Fed tightening. Equity markets reacted in kind, with the S&P 500 falling over 18% that year. In contrast, the rebound in sentiment through mid-2023 corresponded with market recoveries and renewed investor risk appetite.
With sentiment currently trending downward, advisors and asset managers should consider whether this marks the beginning of a broader pullback or a temporary pause within a longer-term growth cycle.
Parsing the Data: 1-, 3-, 5-, and 10-Year Performance Comparisons
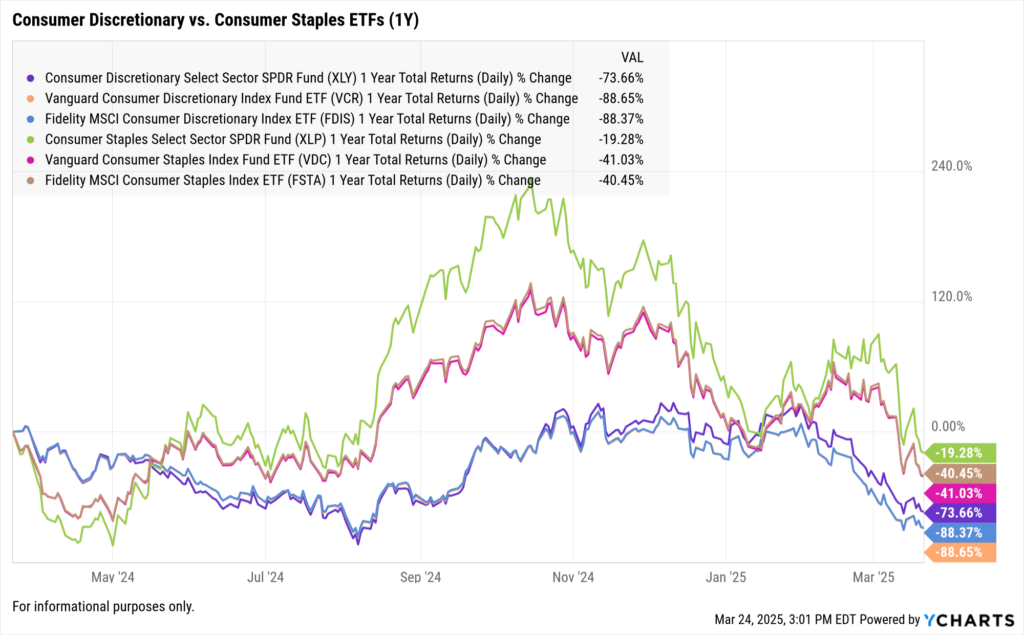
1-Year Performance
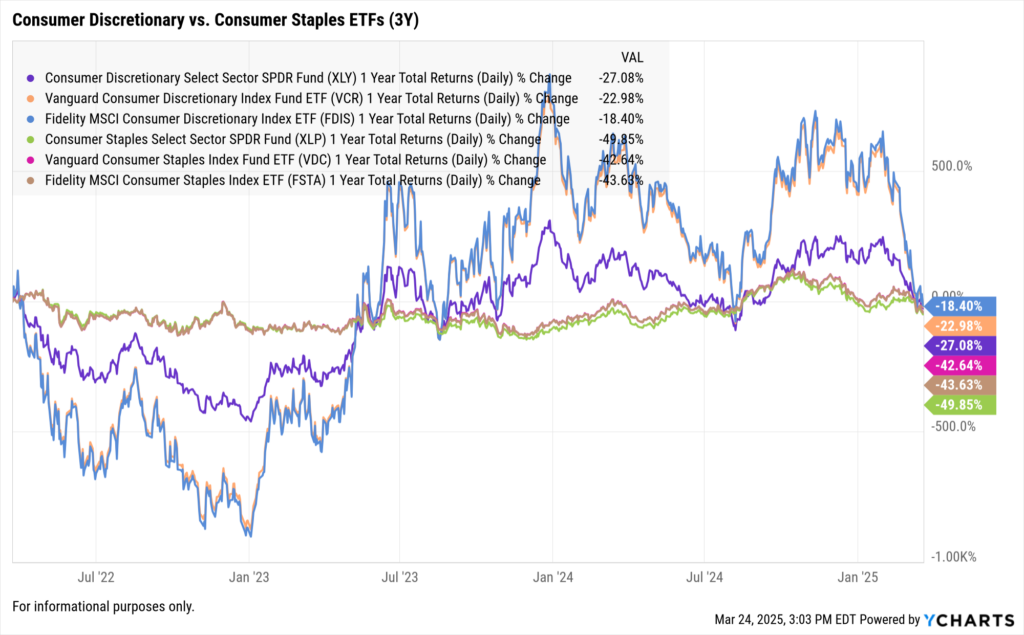
3-Year Performance
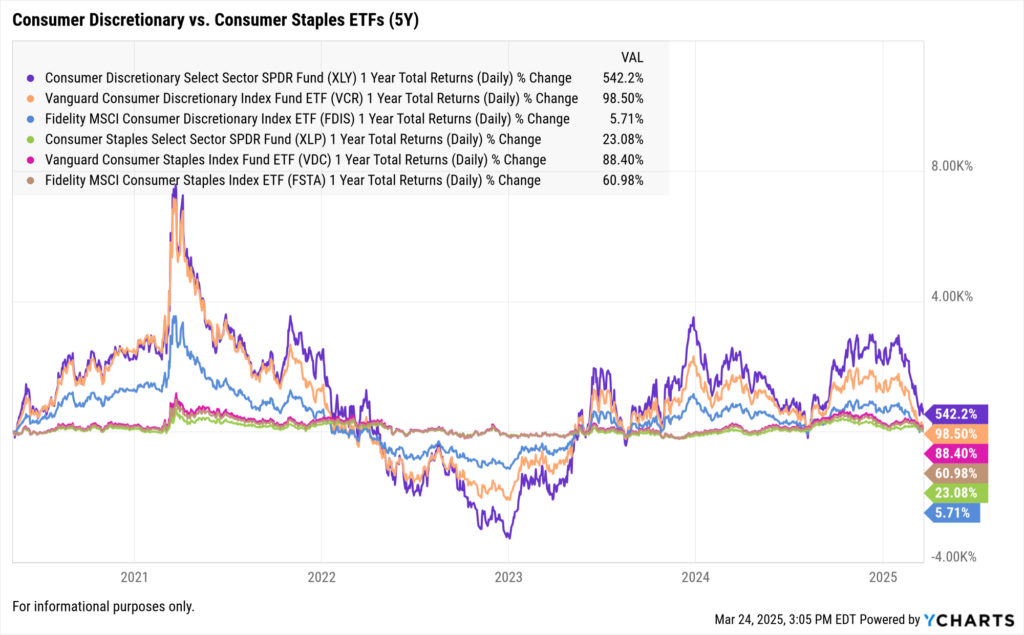
5-Year Performance
10-Year Performance
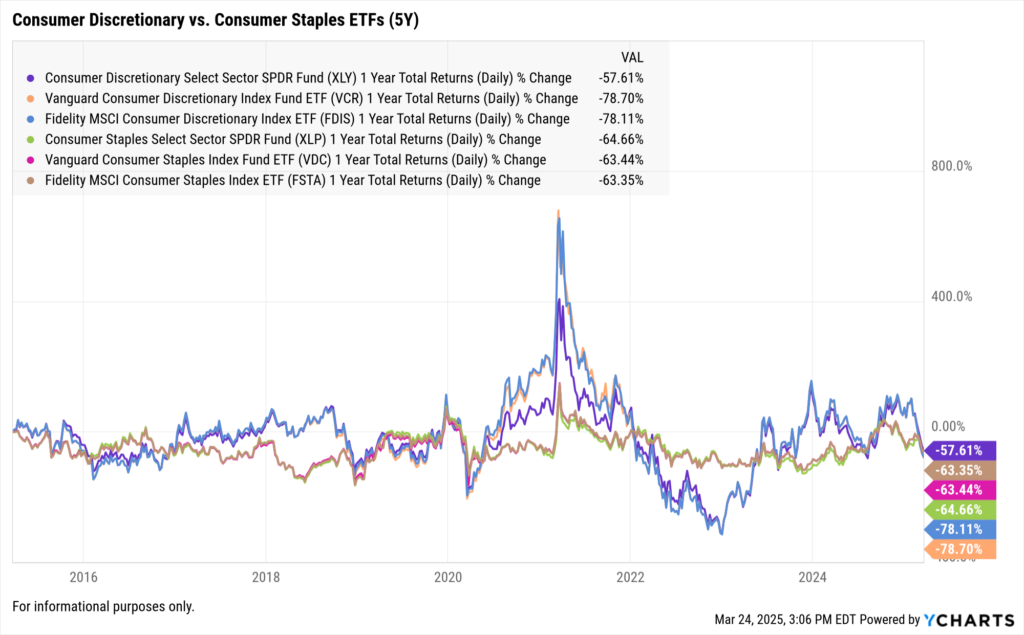
When confidence wanes, spending often shifts from discretionary items toward essentials. Over the past 12 months, the Consumer Discretionary sector has returned just 7.3%, while Consumer Staples posted a steadier 9.8% gain. But zooming out shows a different picture: Over 5 years, Discretionary has outperformed Staples by over 25 percentage points.
This performance divergence highlights the importance of timeframe context. Asset managers balancing tactical allocations with long-term growth strategies must assess whether current sentiment pressures suggest a reversion opportunity or a defensive posture.
Why This Data Matters for Asset Managers and Advisors
Understanding consumer sentiment is more than macro forecasting—it’s portfolio positioning.
1. Sector Rotation Strategies
Declining confidence may prompt reallocation toward defensive sectors such as Consumer Staples, Utilities, and Health Care. Sector ETFs and mutual funds in these areas often provide relative safety during consumer-driven slowdowns.
2. Risk Assessment and Stress Testing
Utilize YCharts’ Scenario & Stress Testing tools to simulate portfolio performance under scenarios of declining consumer sentiment. For example, test a 10-point drop in the CCI and model resulting sector impacts.
3. Client Communication
Client expectations are shaped by headlines and emotion. When confidence falls, investors may question portfolio performance or ask to move to cash. Equip yourself with Custom Reports from YCharts that include consumer sentiment overlays and historical sector behavior.
4. Mutual Fund and ETF Screening
Use the Mutual Fund Screener to identify funds with low exposure to cyclical consumer segments or high weighting in defensive holdings. Screening by top-quartile risk-adjusted returns during previous low-confidence periods can enhance selection decisions.
Macro Insights: Confidence, Inflation, and Rate Cut Timing
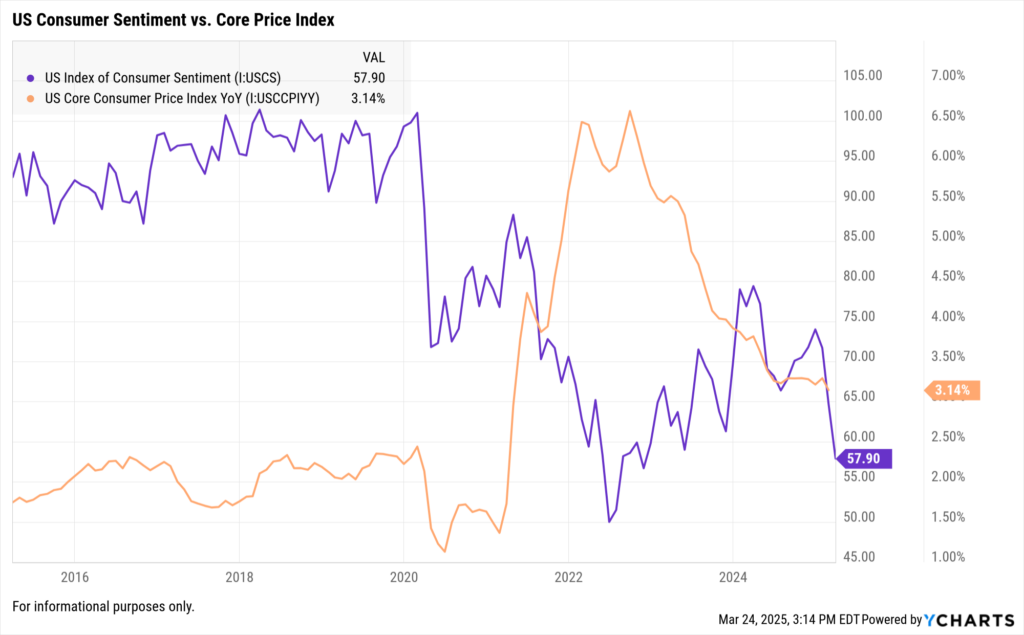
Sentiment does not operate in a vacuum. Its trajectory is closely tied to inflation and interest rate expectations. In periods of persistent inflation (2021-2022), sentiment fell sharply as real incomes declined. Today, with inflation moderating and markets pricing in potential rate cuts, sentiment is at a tipping point.
If the March CCI report confirms continued deterioration, it could accelerate calls for earlier monetary easing—and markets may price in more dovish Fed action. Conversely, a rebound in sentiment could reinforce the Fed’s patient stance.
Advisors should use this macro linkage to inform multi-asset allocation decisions and adjust equity vs. fixed income exposure depending on the rate trajectory implications.
How YCharts Can Help
YCharts provides the tools needed to transform consumer confidence data into actionable investment insights:
- Holdings Overlap Tool: Evaluate your exposure to consumer-sensitive holdings across funds, ETFs, and models.
- Fundamental Charts: Visualize confidence trends alongside equity and economic data to contextualize performance.
- Mutual Fund Screener: Filter for funds with low beta to consumer sentiment or high defensive exposure.
- Scenario & Stress Testing: Simulate portfolio outcomes under varied sentiment assumptions.
- Custom Reports: Build client-ready visuals that explain the impact of confidence data on asset allocation and sector rotation.
Conclusion: Watch the Data, Not Just the Headlines
With consumer confidence potentially heading into its fourth monthly decline, this week’s data release could shift both sentiment and market direction. Advisors and asset managers should stay vigilant, not just for the headlines but for the signals embedded in the data.
Whether you’re managing client expectations, rotating sectors, or evaluating macro-sensitive allocations, the Consumer Confidence Index provides critical guidance. Leverage YCharts’ suite of tools to ensure you are well-prepared to translate consumer sentiment into strategic, data-driven decisions.
Stay informed. Stay proactive. Use YCharts to gain clarity in uncertain times.
Whenever you’re ready, here’s how YCharts can help you:
1. Looking to Move On From Your Investment Research and Analytics Platform?
2. Want to test out YCharts for free?
Start a no-risk 7-Day Free Trial.
Disclaimer
©2025 YCharts, Inc. All Rights Reserved. YCharts, Inc. (“YCharts”) is not registered with the U.S. Securities and Exchange Commission (or with the securities regulatory authority or body of any state or any other jurisdiction) as an investment adviser, broker-dealer or in any other capacity, and does not purport to provide investment advice or make investment recommendations. This report has been generated through application of the analytical tools and data provided through ycharts.com and is intended solely to assist you or your investment or other adviser(s) in conducting investment research. You should not construe this report as an offer to buy or sell, as a solicitation of an offer to buy or sell, or as a recommendation to buy, sell, hold or trade, any security or other financial instrument. For further information regarding your use of this report, please go to: ycharts.com/about/disclosure
Next Article
Challenges Facing the Technology Sector in 2025: Navigating Uncertainty and Embracing InnovationRead More →