Monthly Market Wrap: June 2023
Welcome back to the Monthly Market Wrap from YCharts, where we break down the most important trends for advisors and their clients in this monthly market review. As always, feel free to download and share any visuals with clients and colleagues, or on social media.
Speaking of visuals: be sure to download our free Monthly Market Wrap slide deck, containing all charts featured in the Market Wrap + more.
Get the Monthly Market Wrap slide deck sent straight to your inbox. Download Here:June 2023 Market Summary
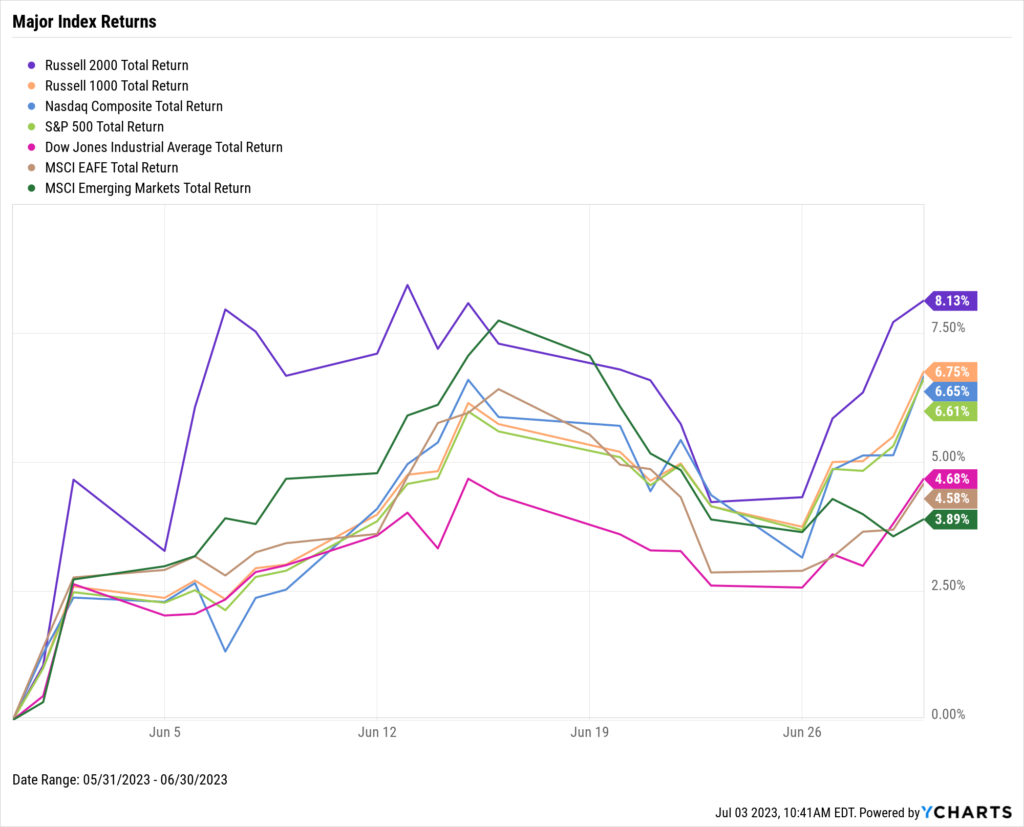
Stocks had a decidedly positive June as the Dow Jones Industrial Average rose 4.7%, the S&P 500 advanced 6.6%, and the NASDAQ charged 6.8% higher. June was an especially good month for small-cap stocks; the Russell 2000 Small Caps index surged 8.1%. Globally, the MSCI Developed Markets index tacked on 4.6% and its Emerging Markets counterpart increased 3.9%.
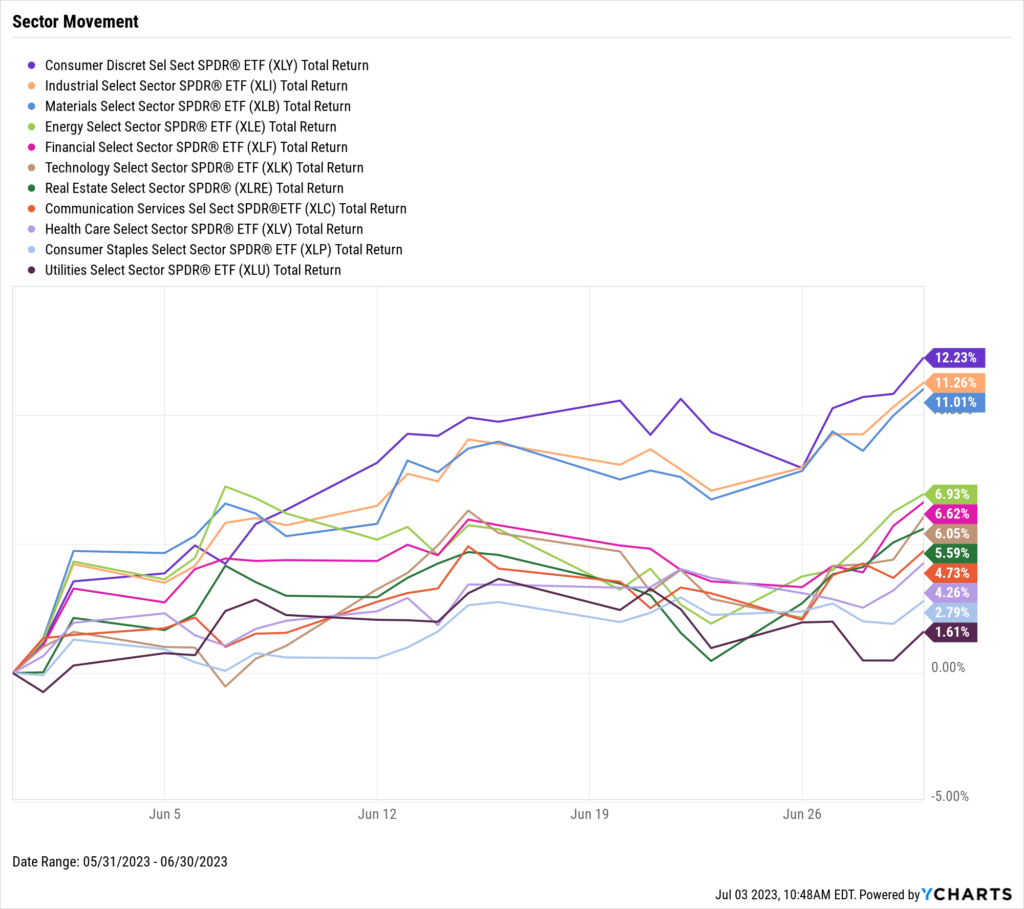
All 11 US stock sectors were positive in June. Of note, Consumer Discretionary, Industrials, and Materials all posted double-digit gains. Though defensive sectors such as Health Care, Consumer Staples, and Utilities were at the bottom of the pack, they joined the other eight sectors in contributing to June’s market rally.
Last month’s Inflation reading came in at 4.05%, its lowest level in two years. Core Inflation declined slightly, while CPI notched marginally higher MoM. Amid softening inflation, the Federal Reserve kept the Target Federal Funds Rate unchanged at 5.25%, making its June 14th meeting the first without an increase in the last 11 meetings.
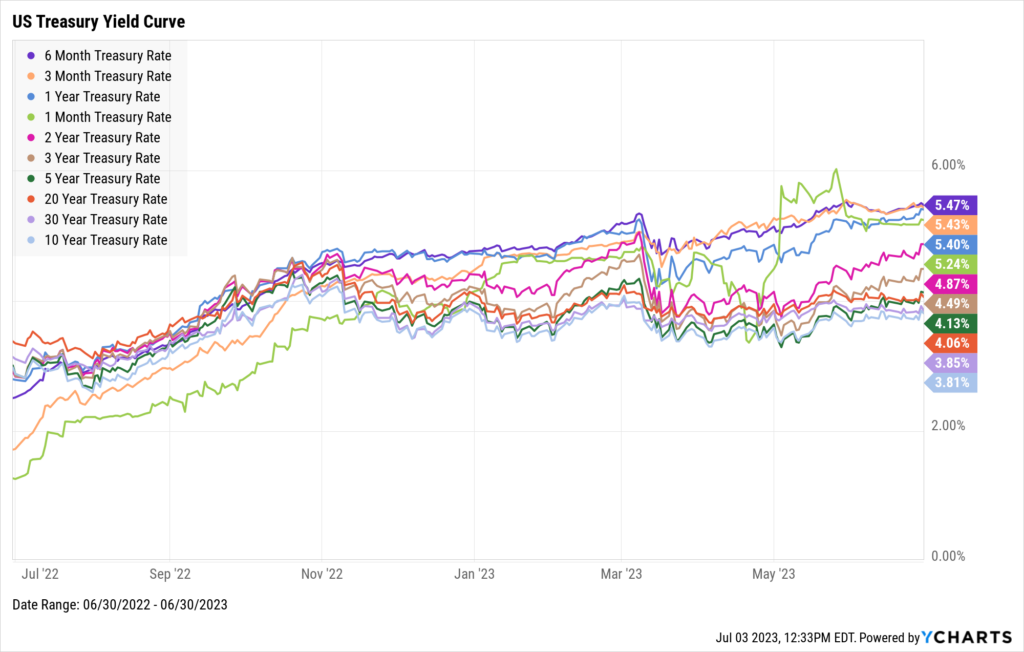
Medium-term US Treasury yields rose in June while those on shorter-term Treasury Bills or long-term bonds either declined or ended the month relatively unchanged. The 2-Year and 3-Year made the largest advances, 47 and 45 basis points, respectively. The 1-Month Treasury Bill fell 4 basis points, and interestingly enough, the long-term 30-Year was unchanged MoM as of the end of June.
Jump to Fixed Income Performance
Want access to full-year charts and data as well? Download our Monthly Market Wrap Slide Deck for more:Off the YCharts! A Tale of Two First Halves
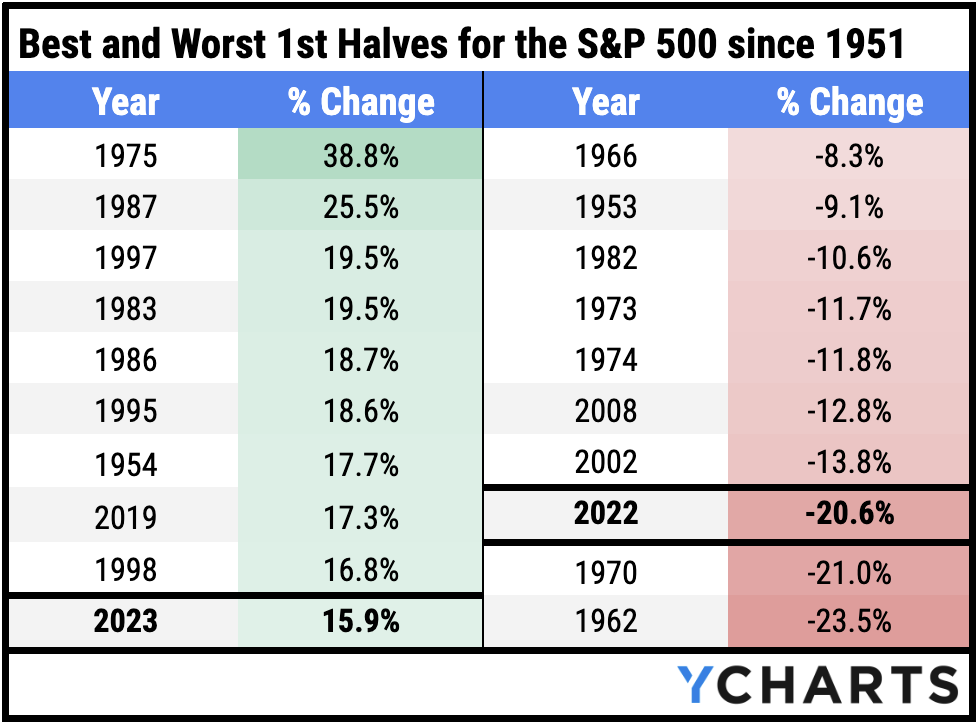
2022 was the eighth-worst first half for the S&P 500 since 1951. With a decline of 20.6%, the index tumbled into a bear market in the first six months of the year.
2023, on the other hand, saw the pendulum swing the opposite way. The S&P 500 produced a 15.9% gain through the first six months of the year, good for the tenth-best first half since 1951. As Charles Dickens wrote in A Tale of Two Cities, “It was the best of times, it was the worst of times”—certainly true for the S&P 500 in 2023 and 2022, respectively.
Download Visual | Modify in YCharts
Equity Performance
Major Indexes
Download Visual | Modify in YCharts | View Below Table in YCharts
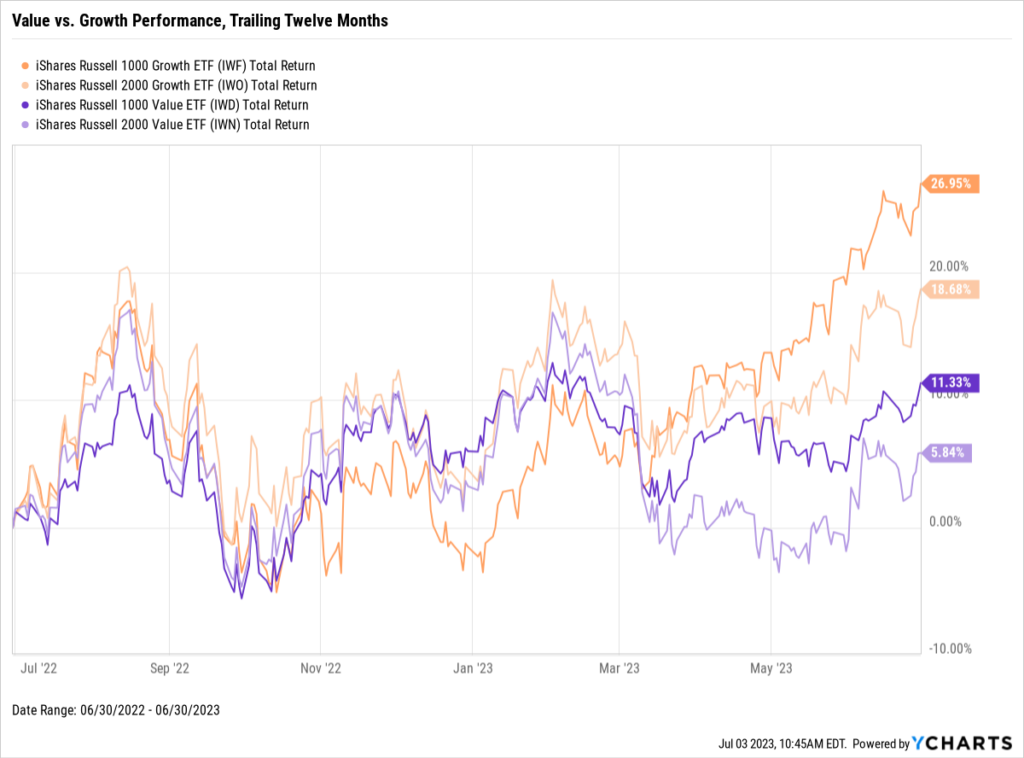
Value vs. Growth Performance, Trailing Twelve Months
Download Visual | Modify in YCharts | View in Comp Tables
US Sector Movement
Download Visual | Modify in YCharts | View Below Table in YCharts
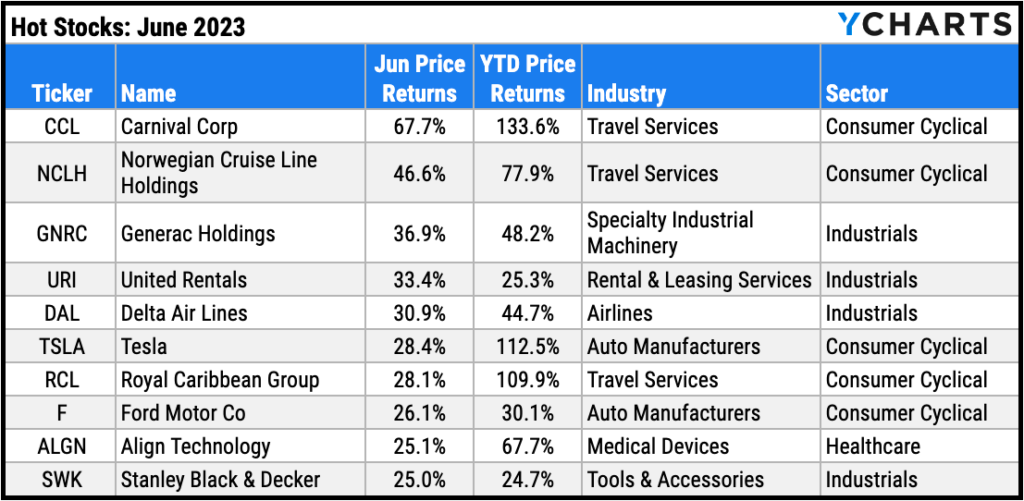
Hot Stocks: Top 10 S&P 500 Performers of June 2023
- Carnival Corp (CCL): 67.7% gain in June
- Norwegian Cruise Line Holdings (NCLH): 46.6%
- Generac Holdings (GNRC): 36.9%
- United Rentals (URI): 33.4%
- Delta Air Lines (DAL): 39%
- Tesla (TSLA): 28.4%
- Royal Caribbean Group (RCL): 28.1%
- Ford Motor Co (F): 26.1%
- Align Technology (ALGN): 25.1%
- Stanley Black & Decker (SWK): 25.0%
Download Visual | Modify in YCharts
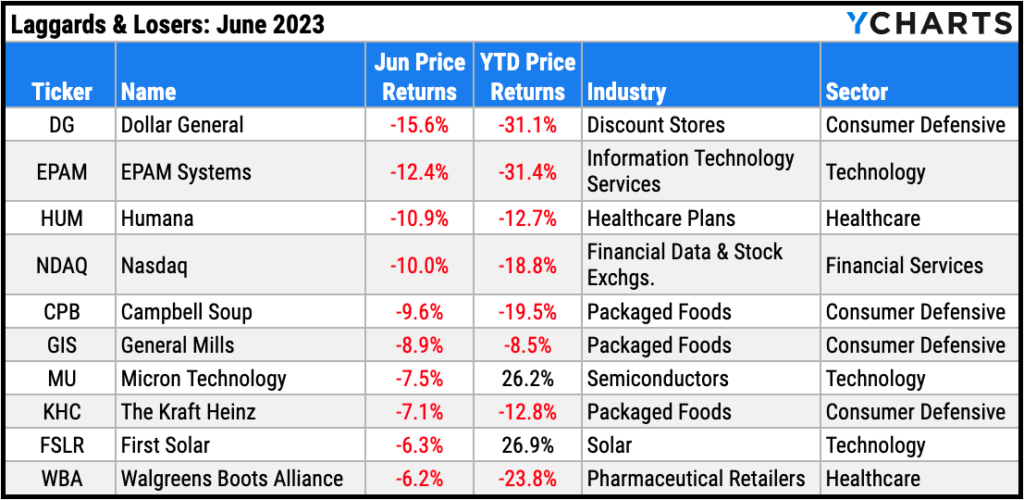
Laggards & Losers: 10 Worst S&P 500 Performers of June 2023
- Dollar General (DG): -15.6% decline in June
- EPAM Systems (EPAM): -12.4%
- Humana (HUM): -10.9%
- Nasdaq (NDAQ): -10.0%
- Campbell Soup (CPB): -9.6%
- General Mills (GIS): -8.9%
- Micron Technology (MU): -7.5%
- The Kraft Heinz (KHC): -7.1%
- First Solar (FSLR): -6.3%
- Walgreens Boots Alliance (WBA): -6.2%
Download Visual | Modify in YCharts
Featured Market & Advisor News
U.S. Inflation Cools, Spending Stagnates As Economy Loses Steam (FA-Mag)
Taking Advantage of the Bull Market: A Playbook for Advisors & Wholesalers (YCharts)
Fed traders boost wagers on two hikes by year-end (InvestmentNews)
Winners & Losers from the Fed’s Last Rate Hike Cycle (YCharts)
North American Wealth Takes 8% Hit in 2022 (WealthManagement.com)
Could You Have Hedged Inflation in 2022 with an ETF? (YCharts)
Economic Data
Employment
After once again tying its lowest level since 1969 in April, May’s unemployment rate went back up to 3.7%. The labor force participation rate remained unchanged at 62.6% for the third straight month. The economy saw 339,000 jobs added in May, firmly beating nonfarm payroll expectations of 190,000 for the month.
Consumers and Inflation
US Inflation cooled to 4.05% in May, its lowest level in two years. US Core Inflation fell slightly from 5.52% to 5.33%. The US Consumer Price Index rose a slight 0.12% in May, and US Personal Spending increased 0.10% MoM. The Federal Reserve chose to hold the Target Federal Funds Rate at 5.25% during its June 14th meeting. This decision ended a streak of ten consecutive rate increases, though chairman Jerome Powell indicated the possibility of two more hikes in 2023.
Production and Sales
The US ISM Manufacturing PMI continued its multi-year decline in June, falling another 0.9 points to 46.0. On the other hand, US Retail and Food Services Sales was up 0.34% MoM. The YoY US Producer Price Index rose only 1.1% in May, its smallest monthly increase in two and a half years.
Housing
US New Single-Family Home Sales surged 12.2% in May, while US Existing Home Sales was up a slight 0.2%. Despite the relatively flat month in existing home sales, the Median Sales Price of Existing Homes rose by 2.6% to $396,100. Mortgage rates ticked up slightly in June; 15-Year and 30-Year Mortgage Rates closed out the month at 6.06% and 6.71%, respectively.
Commodities
Gold traded below $2,000 per ounce throughout June, ending the month down 2.7% at $1,912.30. Oil prices traded sideways for most of June; the price of WTI per barrel inched up 1.4% to $69.09 and Brent rose 2.6% to $73.86. The average price of regular gas was unchanged MoM, coming in at $3.68 per gallon at the end of June.
Cryptocurrencies
After a brief pause in May, the crypto bull run resumed in June as the price of Bitcoin took off by 9.9%. However, Ethereum slipped 2.5%. Nonetheless, crypto enjoyed a remarkable first half of 2023. Bitcoin is up 83.0% YTD, and Ethereum is 54.3% higher on the year.
Fixed Income
US Treasury Yield Curve
1 Month Treasury Rate: 5.24%
3 Month Treasury Rate: 5.43%
6 Month Treasury Rate: 5.47%
1 Year Treasury Rate: 5.40%
2 Year Treasury Rate: 4.87%
3 Year Treasury Rate: 4.49%
5 Year Treasury Rate: 4.13%
10 Year Treasury Rate: 3.81%
20 Year Treasury Rate: 4.06%
30 Year Treasury Rate: 3.85%
Download Visual | Modify in YCharts
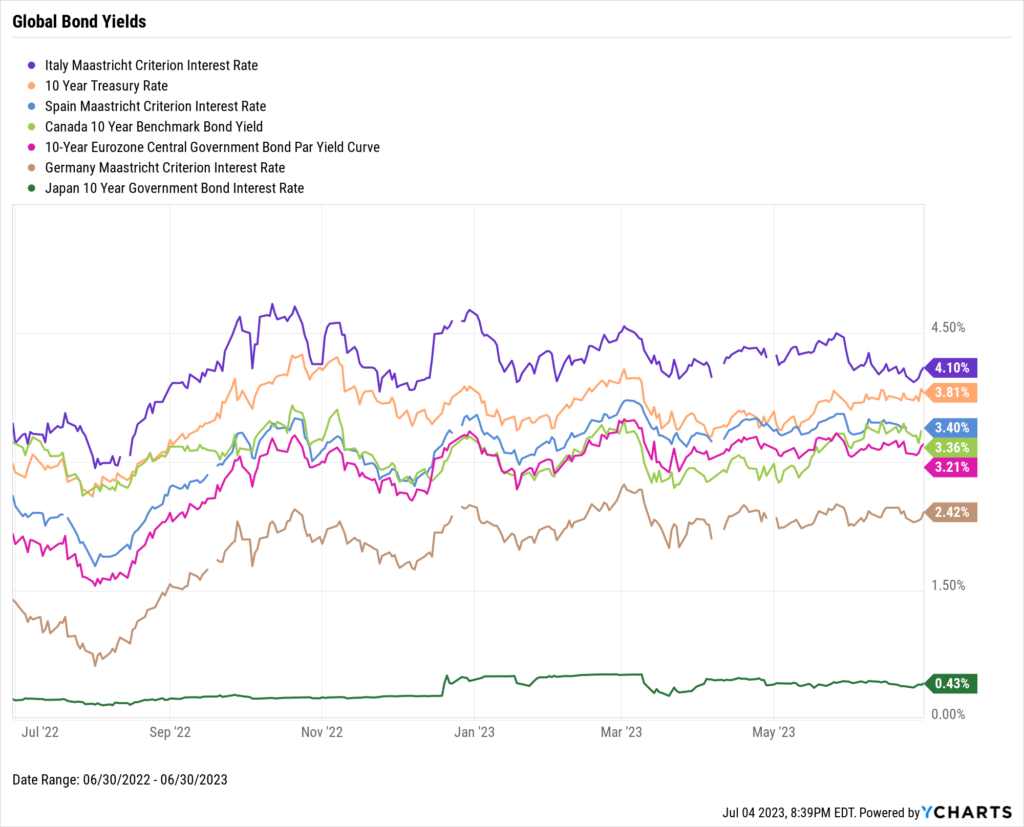
Global Bonds
Italy Long Term Bond Interest Rate: 4.10%
10 Year Treasury Rate: 3.81%
Spain Long Term Bond Interest Rate: 3.40%
Canada 10 Year Benchmark Bond Yield: 3.36%
10-Year Eurozone Central Government Bond Par Yield: 3.21%
Germany Long Term Bond Interest Rate: 2.42%
Japan 10 Year Government Bond Interest Rate: 0.43%
Download Visual | Modify in YCharts
Have a great July! 📈
Get the Monthly Market Wrap slide deck sent straight to your inbox. Download Here:Next Article
A Wholesaler's Guide to Using Stress Tests to Amplify AUMRead More →