Monthly Market Wrap: March 2023
Welcome back to the Monthly Market Wrap from YCharts, where we break down the most important trends for advisors and their clients in this monthly market review. As always, feel free to download and share any visuals with clients and colleagues, or on social media.
Speaking of visuals: be sure to download our free Monthly Market Wrap slide deck, containing all charts featured in the Market Wrap + more.
Get the Monthly Market Wrap slide deck sent straight to your inbox. Download Here:March 2023 Market Summary
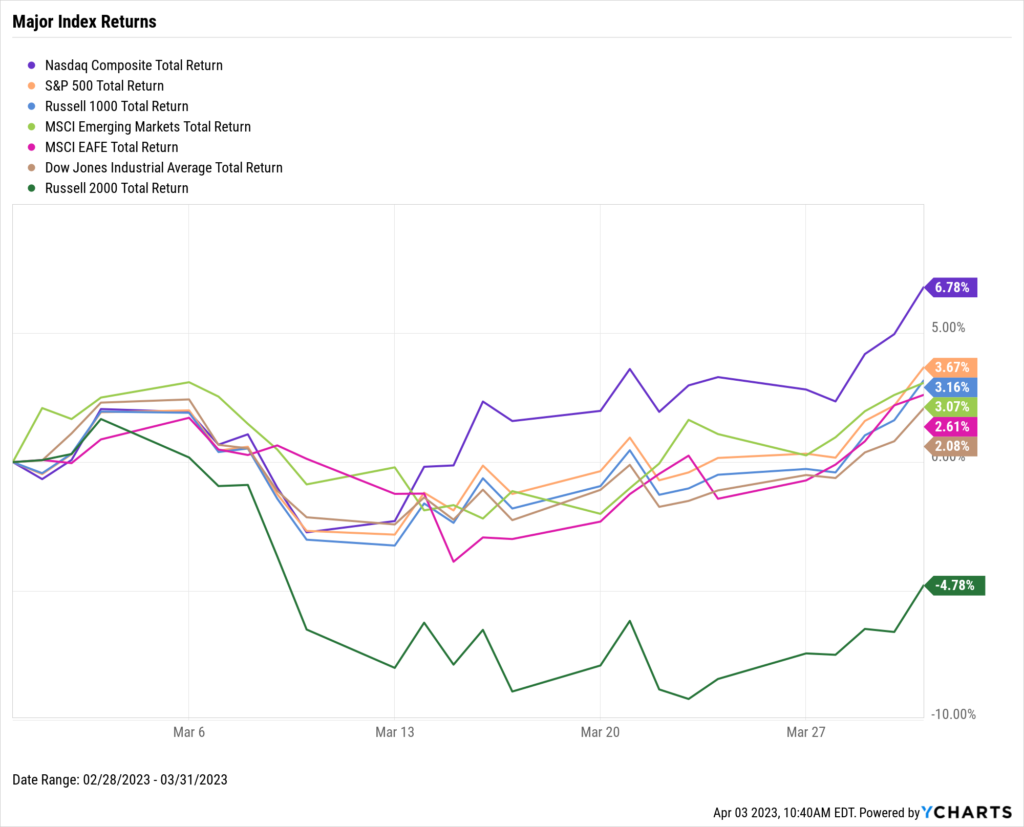
Stocks posted a positive March with the exception of the small-cap Russell 2000 index. The NASDAQ surged 6.8%, the S&P 500 propelled 3.7% higher, and the Dow Jones Industrial Average notched up 2.1%. Equities also finished Q1 in the black across the board, with the NASDAQ’s 17.1% quarterly advance leading the way. The NASDAQ has outperformed other major US indices in all three months of 2023, a sign of renewed favor for growth stocks. The Russell 2000 fell 4.8% for its second consecutive monthly decline.
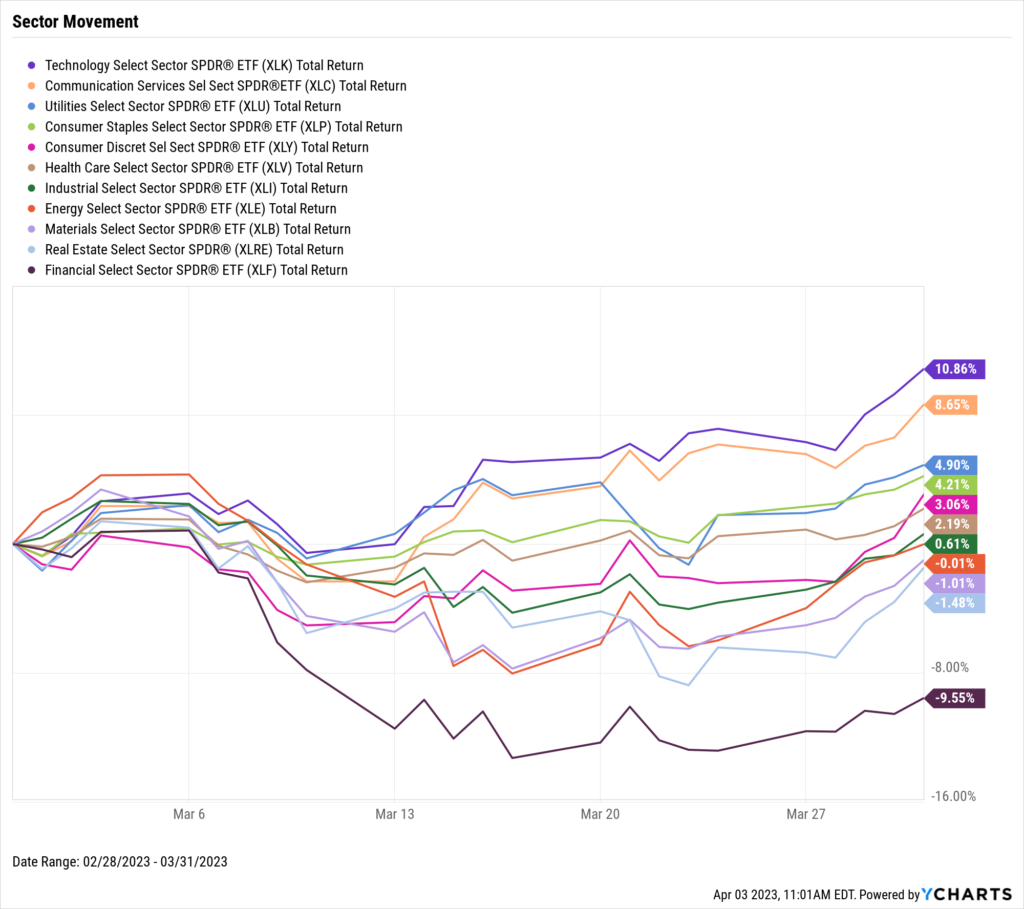
The NASDAQ’s advance was in large part thanks to the Technology and Communication Services sectors. Technology jumped 10.9% higher in March, while Communication Services rose 8.7%. Stocks from these two sectors comprised all ten of the S&P 500’s top stocks in March. The biggest laggard in March was Financials, which plummeted 9.6% as a result of the fallout surrounding Silicon Valley Bank and First Republic Bank (FRC). The S&P 500’s ten worst performers in March were all stocks from the Financial sector as well.
US Existing Home Sales ended a year-long streak of monthly declines by soaring 14.5% in February. US New Single-Family Home Sales also rose in February by 1.1%, good for its third consecutive monthly increase. Gold nearly exceeded $2,000 per ounce in March, while both Brent and WTI oil prices continued to decline, each down over 41% from their March 2022 highs. The US ISM Manufacturing PMI sank deeper into contraction territory, sitting at 46.3 as of February’s end.
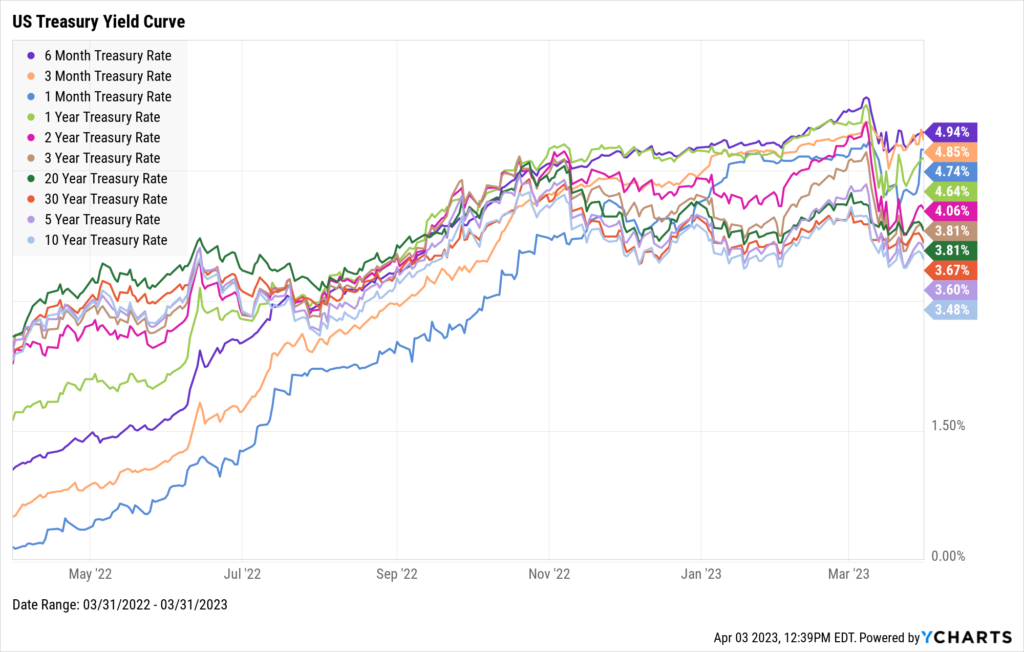
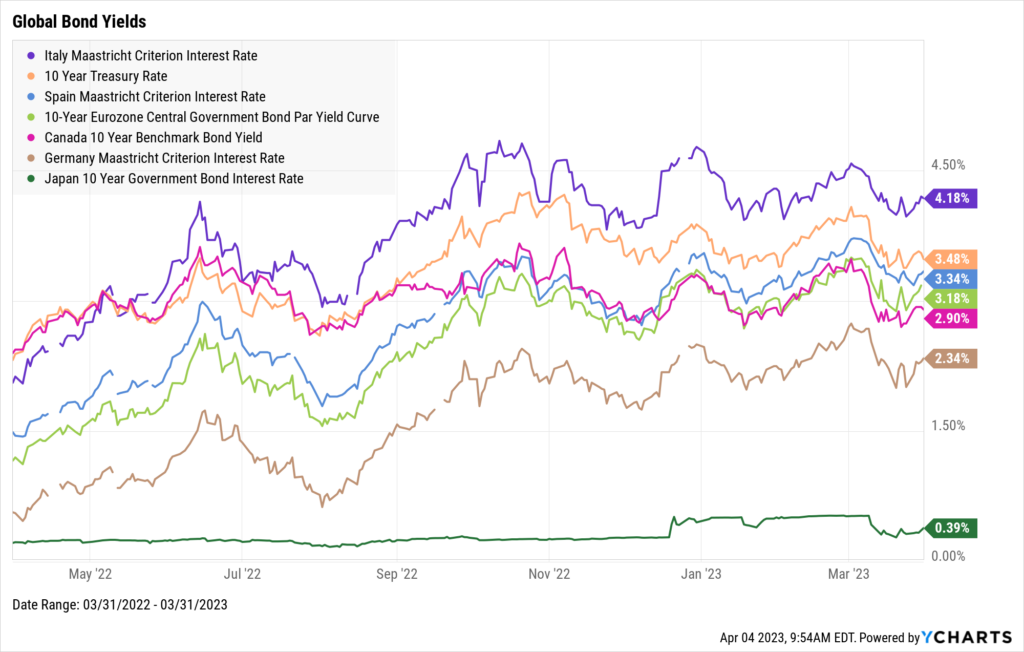
US Treasury yields retraced in March following a February where the 6-Month and 1-Year Treasury Bills eclipsed 5% for the first time since July 2007. The 2-Year note dipped the most across the curve, down 75 basis points in March, while only the 1-Month T-Bill increased last month. Long-term bonds around the world also saw yields decline in March, though not as severely as US instruments.
Jump to Fixed Income Performance
Want access to full-year charts and data as well? Download our Monthly Market Wrap Slide Deck for more:Off the YCharts! The Power of Staying Invested
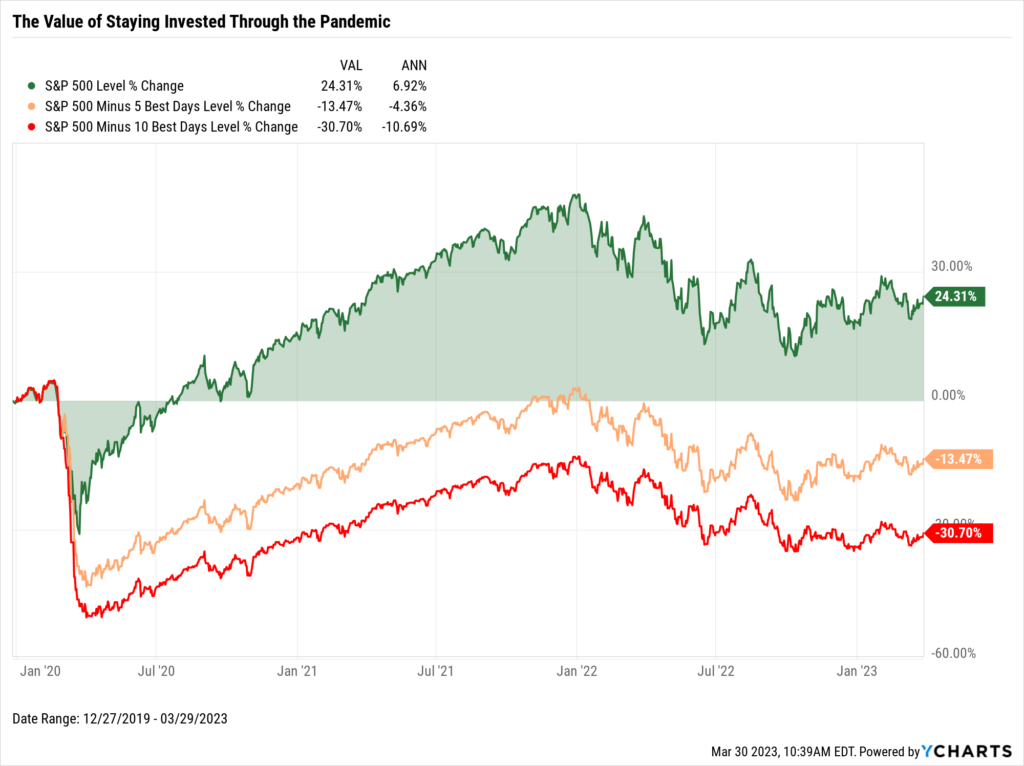
This March marked three years since the onset of the COVID-19 pandemic.
At the time, it seemed like the world was ending. The S&P 500 launched into near freefall, plummeting over 24% In a span of three short weeks.
But, did you know the S&P 500 also logged five single days of 6% or better in that same span, which are also the index’s five best days since 2020?
Missing them would’ve proved to be quite costly in retrospect.
Download: The Top 10 Visuals for Clients and Prospects
Equity Performance
Major Indexes
Download Visual | Modify in YCharts | View Below Table in YCharts
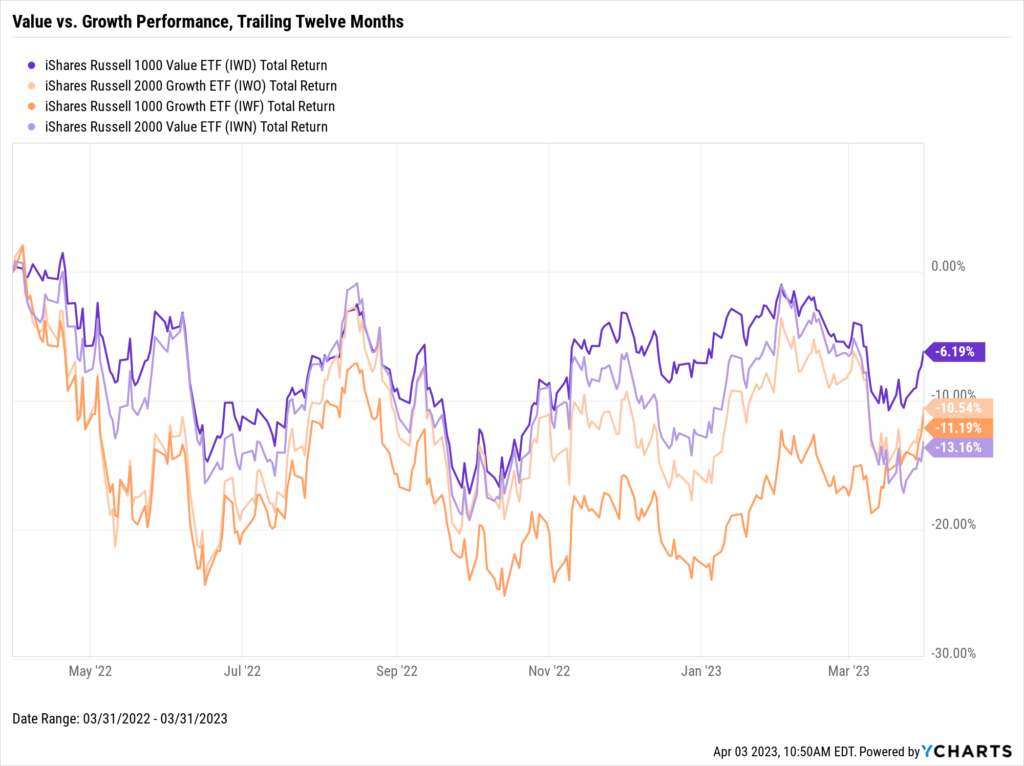
Value vs. Growth Performance, Trailing Twelve Months
Download Visual | Modify in YCharts | View in Comp Tables
US Sector Movement
Download Visual | Modify in YCharts | View Below Table in YCharts
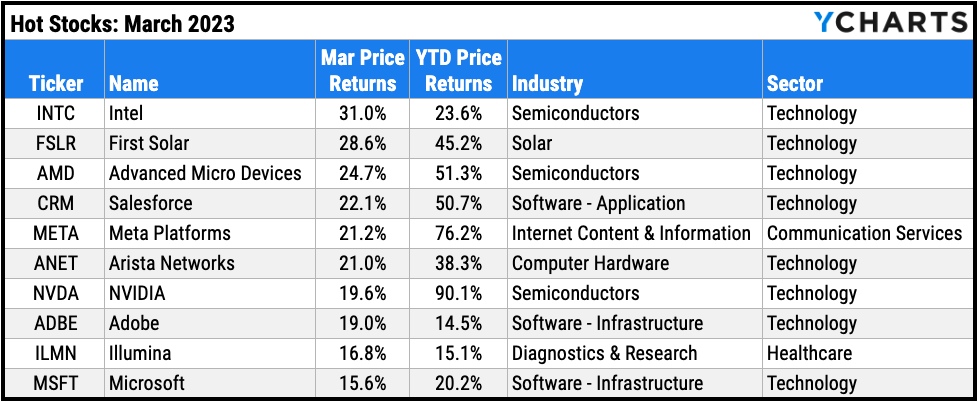
Hot Stocks: Top 10 S&P 500 Performers of March 2023
- Intel (INTC): 31.0% gain in March
- First Solar (FSLR): 28.6%
- Advanced Micro Devices (AMD): 24.7%
- Salesforce (CRM): 22.1%
- Meta Platforms (META): 21.2%
- Arista Networks (ANET): 21.0%
- NVIDIA (NVDA): 19.6%
- Adobe (ADBE): 19.0%
- Illumina (ILMN): 16.8%
- Microsoft (MSFT): 15.6%
Download Visual | Modify in YCharts
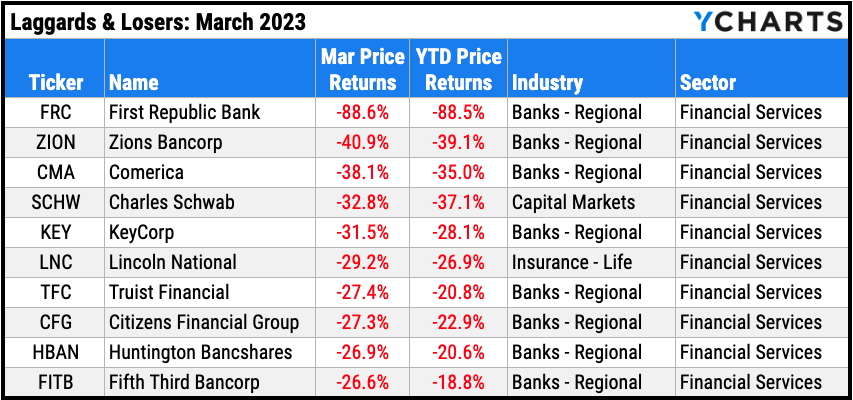
Laggards & Losers: 10 Worst S&P 500 Performers of March 2023
- First Republic Bank (FRC): -88.6% decline in March
- Zions Bancorp (ZION): -40.9%
- Comerica (CMA): -38.1%
- Charles Schwab (SCHW): -32.8%
- KeyCorp (KEY): -31.5%
- Lincoln National (LNC): -29.2%
- Truist Financial (TFC): -27.4%
- Citizens Financial Group (CFG): -27.3%
- Huntington Bancshares (HBAN): -26.9%
- Fifth Third Bancorp (FITB): -26.6%
Download Visual | Modify in YCharts
Featured Market & Advisor News
Majority Of Investors Are Sticking With Index Funds, Survey Says (FA-Mag)
7 Best Asset Classes to Hedge Against Inflation (YCharts)
2022 was rough year for near-retirees in target-date funds (InvestmentNews)
Why “Time in the Market” Trumps “Timing the Market” (YCharts)
Retail Options Trading Is Increasing the Volatility of Securities (WealthManagement.com)
The Current State of the Job Market (YCharts)
Economic Data
Employment
February’s unemployment rate escalated to 3.6%, one month following the lowest US unemployment level recorded since May of 1969. The labor force participation rate saw an increase of 0.1 percentage point to 62.5%. Lastly, 311,000 jobs were added in February, surpassing monthly nonfarm payroll expectations of 225,000.
Consumers and Inflation
February’s US Inflation reading fell to 6.04% while US Core Inflation remained about flat at 5.54%. The US Consumer Price Index rose 0.37% MoM. US Personal Spending inched 0.15% higher MoM following a surge of 2% in January, which was its highest monthly increase in nearly two years. The Upper Limit Target Federal Funds Rate was raised by 25 bps at the Fed’s March 22nd meeting to 5%, marking the first time the Fed Funds Rate was 5% or higher since August 2007.
Production and Sales
The US ISM Manufacturing PMI fell another 1.4 points into contraction territory, to 46.3 in February. US Retail and Food Services Sales declined 0.4% MoM one month following its highest monthly increase since March 2021. The YoY US Producer Price Index cooled down from 5.71% in January to 4.58% in February.
Housing
US New Single-Family Home Sales logged a third consecutive monthly increase, rising 1.1% in February. US Existing Home Sales jumped 14.5% in February, ending a streak of 12 consecutive monthly declines. As a result, the Median Sales Price of Existing Homes inched higher to $363,000. Mortgage rates cooled off slightly, but 15-Year and 30-Year Mortgage Rates remain elevated at 5.56% and 6.32% respectively.
Commodities
Gold nearly broke above $2,000 per ounce in March, reaching $1,993.80 on March 24th and ending the month at $1,979.70. Oil prices continued their steady decline, as the price of WTI per barrel fell 5.2% to $72.87 and Brent dipped 7.7% to $76.80. Both types of crude oil are down over 41% from their highs set in March of 2022 and have returned to levels last seen in December 2021. Despite falling oil prices, the average price of regular gas increased by 8 cents to $3.53 per gallon at the end of March.
Cryptocurrencies
March was another largely positive month for crypto as Bitcoin surged 19.2% in March. Ethereum posted a 9.7% gain as well. Year-to-date, Bitcoin is up 69.7% and Ethereum is 49.6% higher. Though both cryptocurrencies are still well over 50% below their all-time highs, can the alternative asset class keep marching higher?
Fixed Income
US Treasury Yield Curve
1 Month Treasury Rate: 4.74%
3 Month Treasury Rate: 4.85%
6 Month Treasury Rate: 4.94%
1 Year Treasury Rate: 4.64%
2 Year Treasury Rate: 4.06%
3 Year Treasury Rate: 3.81%
5 Year Treasury Rate: 3.60%
10 Year Treasury Rate: 3.48%
20 Year Treasury Rate: 3.81%
30 Year Treasury Rate: 3.67%
Download Visual | Modify in YCharts
Global Bonds
Italy Long Term Bond Interest Rate: 4.18%
10 Year Treasury Rate: 3.48%
Spain Long Term Bond Interest Rate: 3.34%
10-Year Eurozone Central Government Bond Par Yield: 3.18%
Canada 10 Year Benchmark Bond Yield: 2.90%
Germany Long Term Bond Interest Rate: 2.34%
Japan 10 Year Government Bond Interest Rate: 0.39%
Download Visual | Modify in YCharts
Have a great April! 📈
Get the Monthly Market Wrap slide deck sent straight to your inbox. Download Here:Next Article
3 Ways to Identify Your Fund’s Strengths Against CompetitorsRead More →