Monthly Market Wrap: November 2023
Welcome back to the Monthly Market Wrap from YCharts, where we break down the most important trends for advisors and their clients in this monthly market review.
Want to use these visuals in your own presentations? Download our free Monthly Market Wrap slide deck, containing all charts featured in the Market Wrap and more in a shareable, presentation-ready format.
November 2023 Market Summary
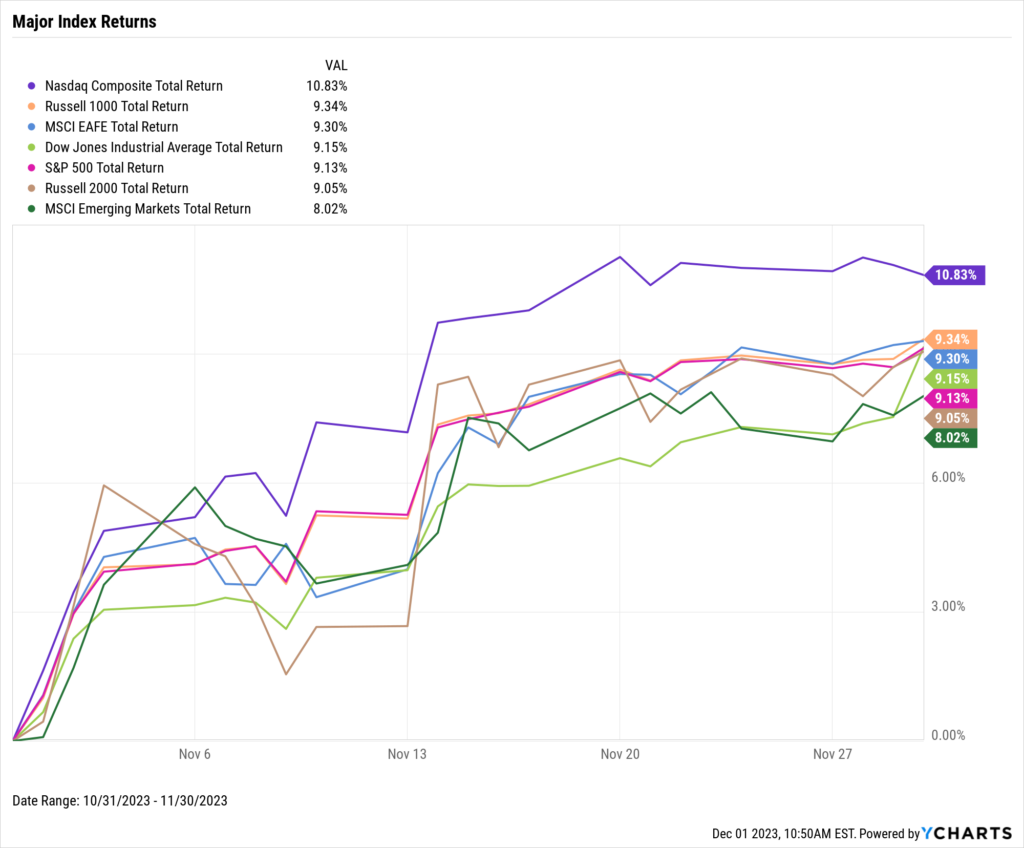
Stocks recorded a highly bullish November as the S&P 500 advanced 9.1%, the Dow Jones Industrial Average charged 9.2% higher, and the NASDAQ surged 10.8%. The Russell 1000 finished November up 9.3%, and the small-cap Russell 2000 added 9.1%. Global indices joined the party as well–Emerging Markets posted an 8.0% gain in November and EAFE jumped 9.3%.
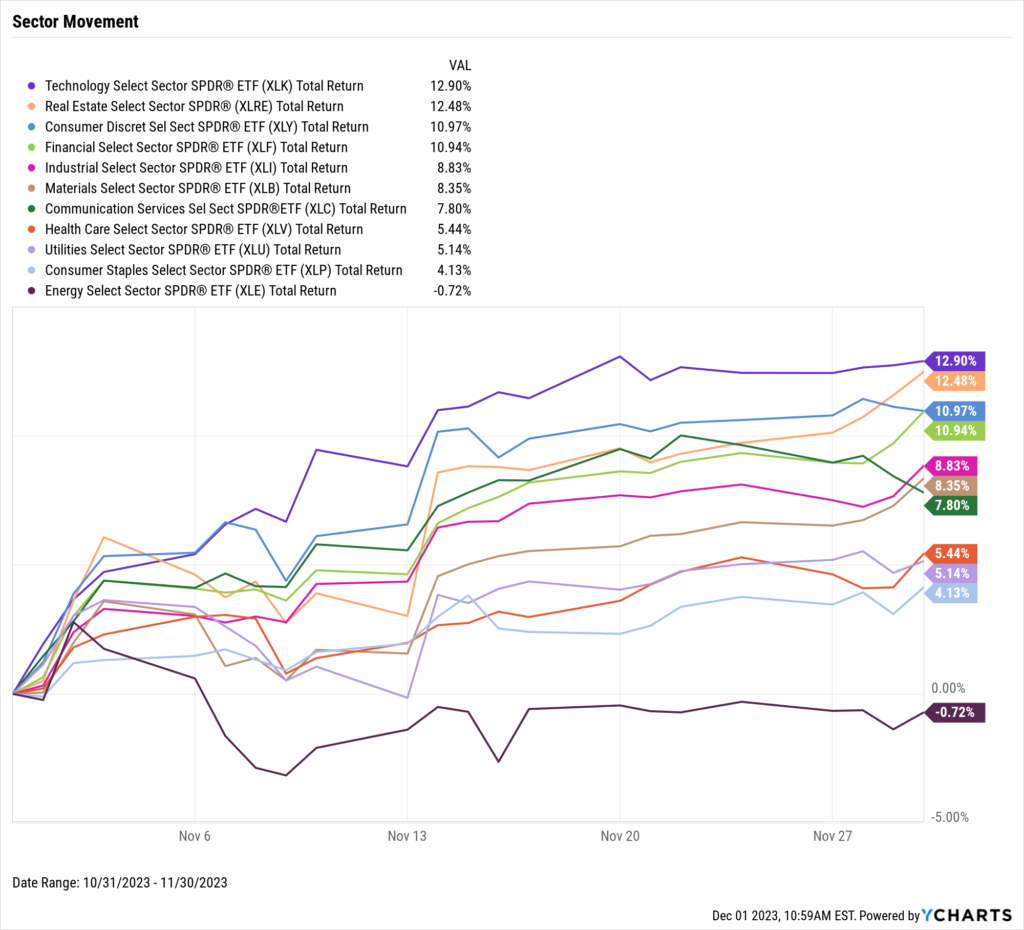
Energy was the month’s sole negative sector, declining 0.7%. The Technology, Real Estate, Consumer Discretionary, and Financial sectors all posted double-digit gains in November.
Existing home sales declined for the fifth straight month while the median price of an existing home fell for the fourth month in a row. However, the 15-year Mortgage Rate backed off of 7%, a level it hadn’t reached since 2000. Both inflation and core inflation decelerated, and CPI was nearly unchanged MoM. The per-ounce price of Gold breached the key $2,000 level in November and is 1.5% off from its all-time high of $2,067.20.
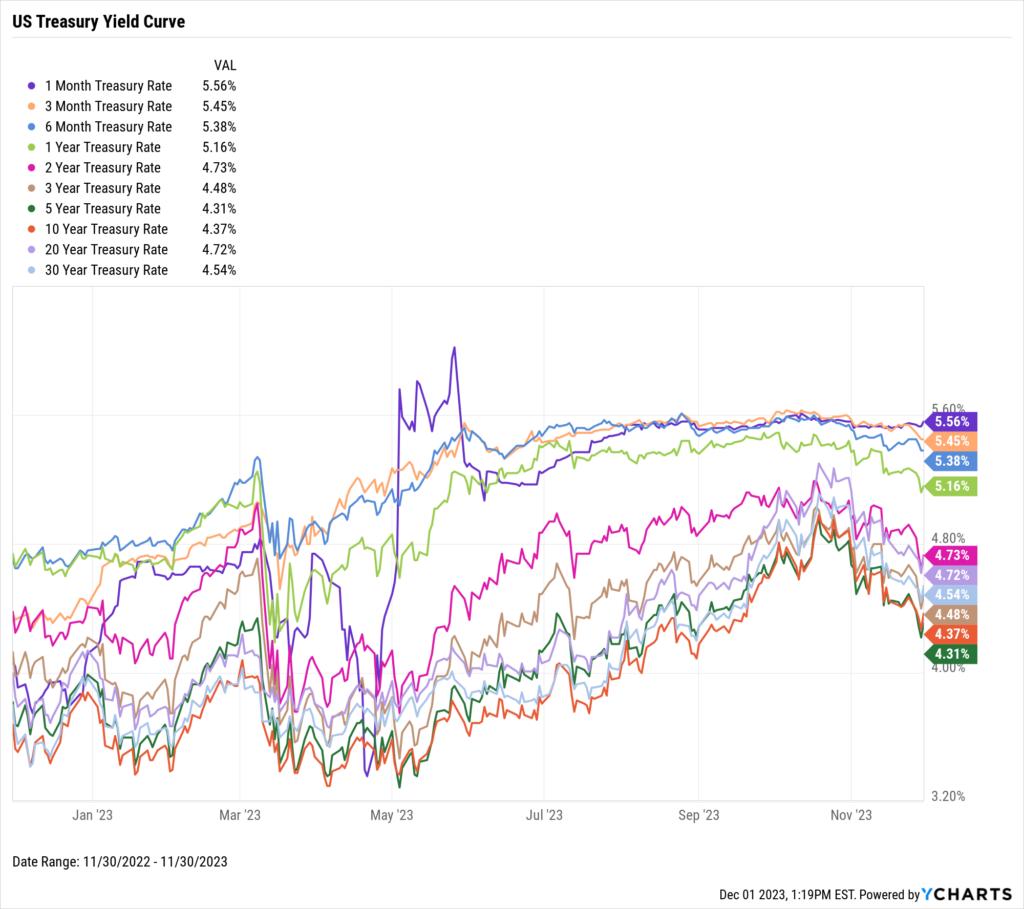
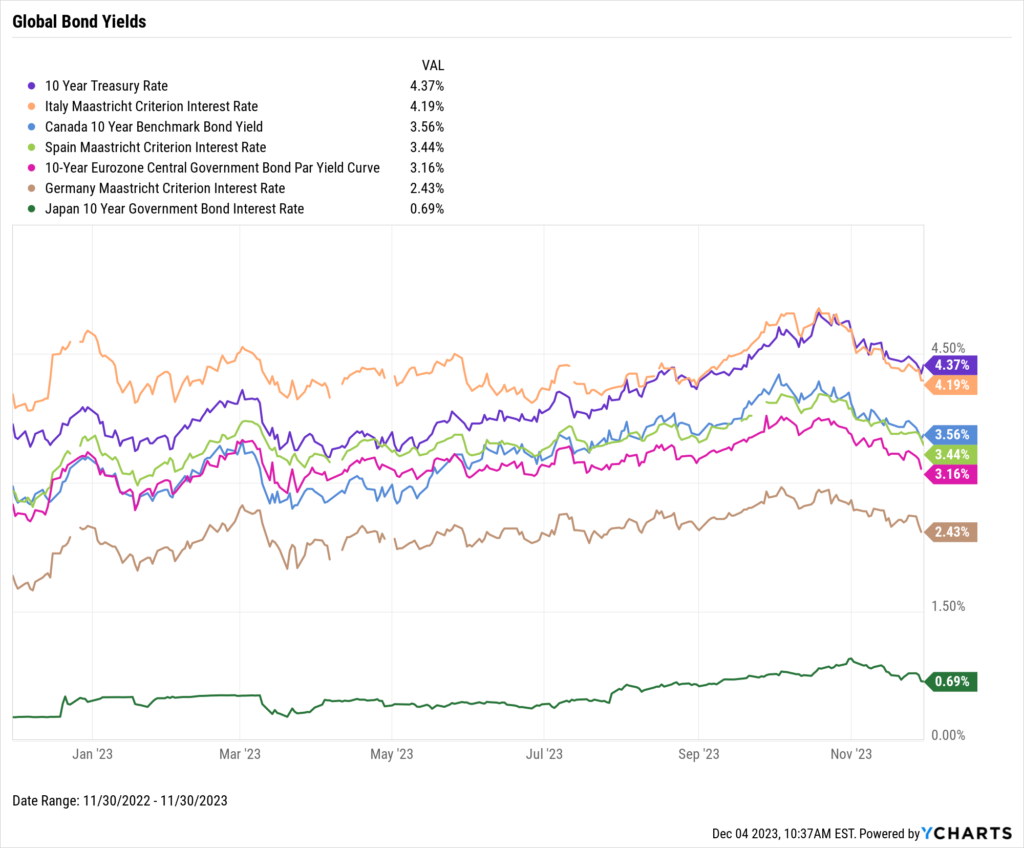
Treasury yields tumbled in November as investors piled back into equities. Yields on the 5-year and 10-year treasuries fell by 51 basis points, the most out of any duration on the curve. The 1-month T-Bill ended November unchanged at 5.56%. Yields on certain global fixed-income instruments also dove lower in November.
Jump to Fixed Income Performance
Want to create your own monthly recap, complete with these charts in a presentation deck that contains your firm’s branding? Start a Free Trial →
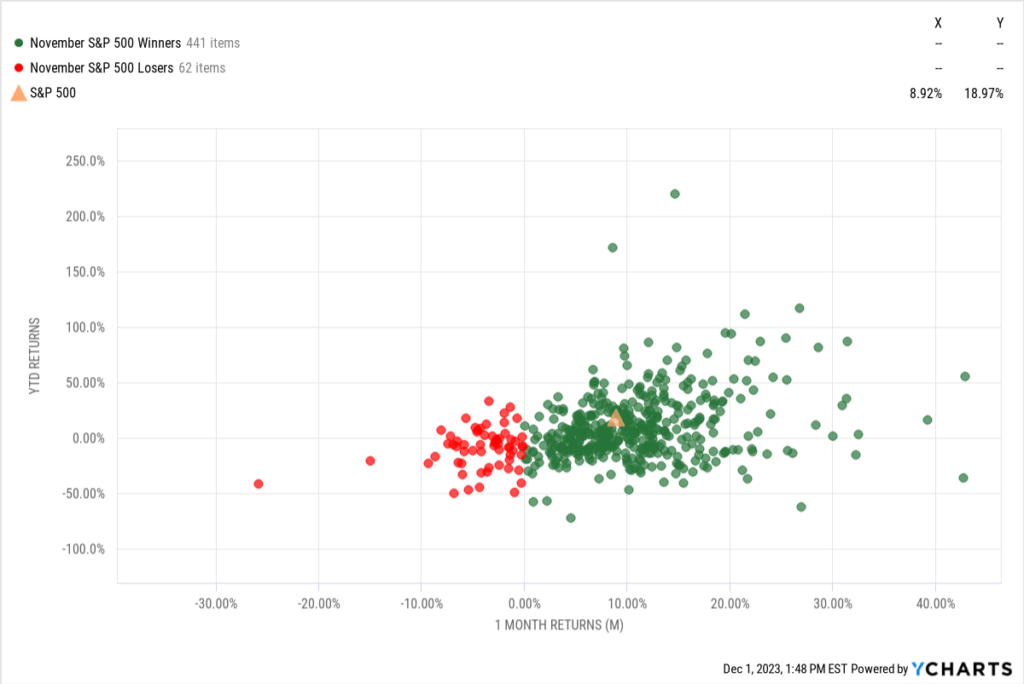
Off the YCharts! November S&P 500 Winners & Losers
Out of the 503 S&P 500 constituents, 441 of them posted positive returns in November. In other words, 87.7% of the S&P 500 had a positive month.
However, finding an individual stock that outperformed the S&P 500 index’s 8.92% gain in November was a more difficult task. 250 of the 503 constituents posted a return higher than the S&P 500 index’s November gain, giving just about a 50-50 chance of picking a company that would’ve beaten the index.
Download Visual | Contact Us to Learn How to Make This Chart
Equity Performance
Major Indexes
Download Visual | Modify in YCharts | View Below Table in YCharts
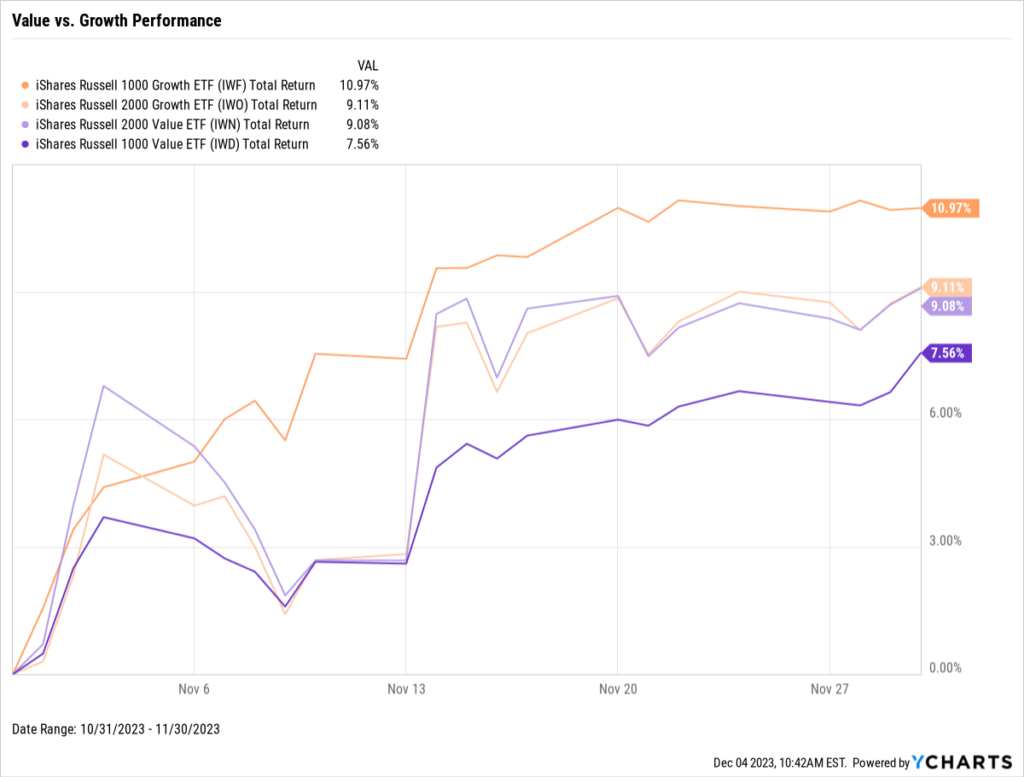
Value vs. Growth Performance
Download Visual | Modify in YCharts | View in Comp Tables
US Sector Movement
Download Visual | Modify in YCharts | View Below Table in YCharts
Hot Stocks: Top 10 S&P 500 Performers of November 2023
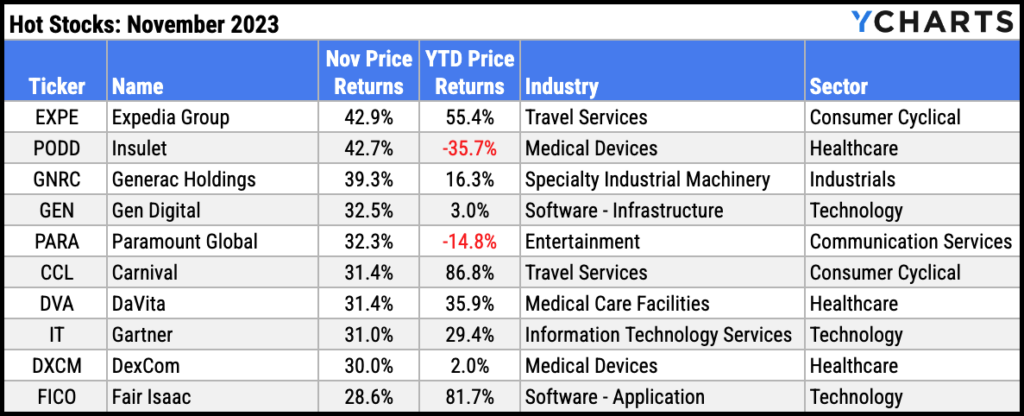
Download Visual | Modify in YCharts
Laggards & Losers: 10 Worst S&P 500 Performers of November 2023
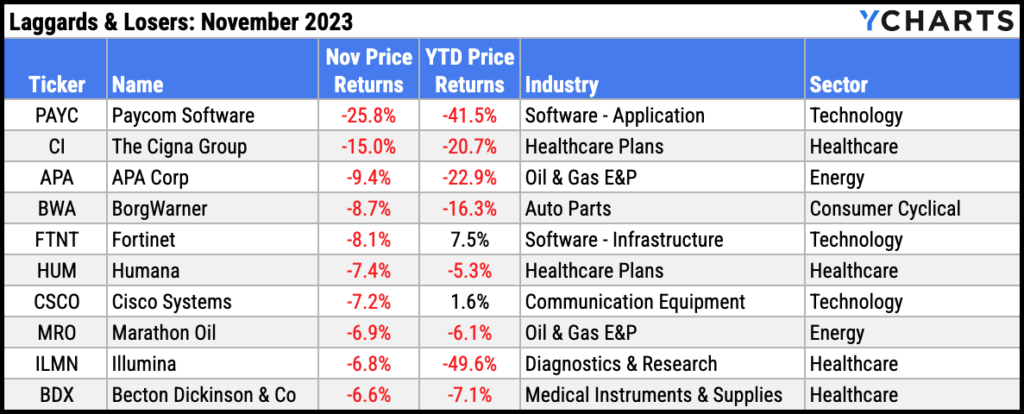
Download Visual | Modify in YCharts
Featured Market & Advisor News
Cerulli Finds 63% Of Affluent Investors Willing To Pay For Advice (FA-Mag)
Your Complete Guide to Sector Rotation (YCharts)
How do you value crypto assets? CFA Institute now has a guide (InvestmentNews)
How to Build Tax-Efficient Investment Strategies for 2024 (YCharts)
Charlie Munger, Who Helped Buffett Build Berkshire, Dies at 99 (WealthManagement.com)
Reduce Client Anxiety with YCharts Custom Stress Tests (YCharts)
Economic Data
Employment
October’s unemployment rate increased one-tenth of a percentage point to 3.9%, while the labor force participation rate decreased by that same amount to 62.7%. October nonfarm payroll data showed 150,000 jobs added, falling short of the 170,000 expected for the month.
Consumers and Inflation
The US inflation rate decreased to 3.24% in October, down from 3.70% in September. Core Inflation decelerated for the seventh consecutive month, from 4.15% in September to 4.03% in October. The US Consumer Price Index was essentially unchanged MoM, and US Personal Spending grew at a below-average rate of 0.22% MoM.
Production and Sales
The US ISM Manufacturing PMI remained unchanged at 46.7 in November and in contraction territory for the 13th consecutive month. October US Retail and Food Services Sales contracted by 0.1% MoM, while the YoY US Producer Price Index fell eight-tenths of a percentage point in October to 1.34%.
Housing
US New Single-Family Home Sales MoM continued its up-and-down ways in October, contracting by 5.6% after having jumped 8.6% in September. US Existing Home Sales sank 4%, down for the fifth consecutive month and 19th out of the last 21. The Median Sales Price of Existing Homes fell for the fourth straight month, to $391,800 in October. Mortgage rates cooled down in November; the 15-year Mortgage Rate closed out the month at 6.56% after topping 7% for the first time since December 2000, and the 30-year ended November at 7.22%, down 0.79 percentage points since the end of last month.
Commodities
The price of Gold crossed above $2,000 in November to $2,035.50 per ounce as of November 30th. Crude oil went the opposite direction; the price of WTI oil fell 8.8% in November to $74.46 per barrel as of November 27th, while Brent slipped 8.4% to $79.49 per barrel in that same time frame. This helped deliver motorists a second consecutive month of lower prices at the pump, as the average price of regular gas fell 16 cents in November to $3.36 per gallon, its lowest level since the start of 2023.
Cryptocurrencies
Major cryptocurrencies charged even higher in November. The price of Bitcoin added 9.6% in November to $37,810.35 per coin, while Ethereum jumped 12.0% to $2,025.94 per ether. November marked the first time Ethereum crossed above $2,000 per ether since July 2023. Bitcoin has advanced 126.6% on the year, and Ethereum is up 70.8% YTD.
Fixed Income
US Treasury Yield Curve
1 Month Treasury Rate: 5.56%
3 Month Treasury Rate: 5.45%
6 Month Treasury Rate: 5.38%
1 Year Treasury Rate: 5.16%
2 Year Treasury Rate: 4.73%
3 Year Treasury Rate: 4.48%
5 Year Treasury Rate: 4.31%
10 Year Treasury Rate: 4.37%
20 Year Treasury Rate: 4.72%
30 Year Treasury Rate: 4.54%
Download Visual | Modify in YCharts
Global Bonds
10 Year Treasury Rate: 4.37%
Italy Long Term Bond Interest Rate: 4.19%
Canada 10 Year Benchmark Bond Yield: 3.56%
Spain Long Term Bond Interest Rate: 3.44%
10-Year Eurozone Central Government Bond Par Yield: 3.16%
Germany Long Term Bond Interest Rate: 2.43%
Japan 10 Year Government Bond Interest Rate: 0.69%
Download Visual | Modify in YCharts
Have a great December! 📈
Whenever you’re ready, there are 3 ways YCharts can help you:
1. Looking for a communication tool to show the impact of monthly market events?
Send us an email at hello@ycharts.com or call (866) 965-7552. You’ll be directly in touch with one of our Chicago-based team members.
2. Want to test out YCharts for free?
Start a no-risk 7-Day Free Trial.
3. Download a copy of the Monthly Market Wrap slide deck:
Disclaimer
©2023 YCharts, Inc. All Rights Reserved. YCharts, Inc. (“YCharts”) is not registered with the U.S. Securities and Exchange Commission (or with the securities regulatory authority or body of any state or any other jurisdiction) as an investment adviser, broker-dealer or in any other capacity, and does not purport to provide investment advice or make investment recommendations. This report has been generated through application of the analytical tools and data provided through ycharts.com and is intended solely to assist you or your investment or other adviser(s) in conducting investment research. You should not construe this report as an offer to buy or sell, as a solicitation of an offer to buy or sell, or as a recommendation to buy, sell, hold or trade, any security or other financial instrument. For further information regarding your use of this report, please go to: ycharts.com/about/disclosure
Next Article
Value vs Growth: Current Trends, Top Stocks & ETFsRead More →