How Wholesalers Gain an Edge with YCharts SMA, Portfolio Data
YCharts provides access to key data for nearly 12,000+ Separately Managed Accounts (SMAs) and Models (UMAs) from dozens of asset managers that can be evaluated and compared with powerful research tools and customizable reports. Wholesalers can leverage YCharts to discuss SMAs and Models with their clients and prospects in the same ways the platform is used for analyzing Mutual Funds, ETFs, Closed-End Funds, and UITs.
Want to learn more? Reach out to see how YCharts enables wholesalers to improve their sales process with SMA data.
Using YCharts to Find and Compare SMAs
Wholesalers have the ability to use both SMA and UMA datasets throughout the YCharts platform when performing in-depth research, screening for competitors, or generating comparison reports in seconds. Below are a few workflows that YCharts users have found to be the most impactful in their day-to-day:
One-Stop-Shop for Key Performance Stats and Fundamentals
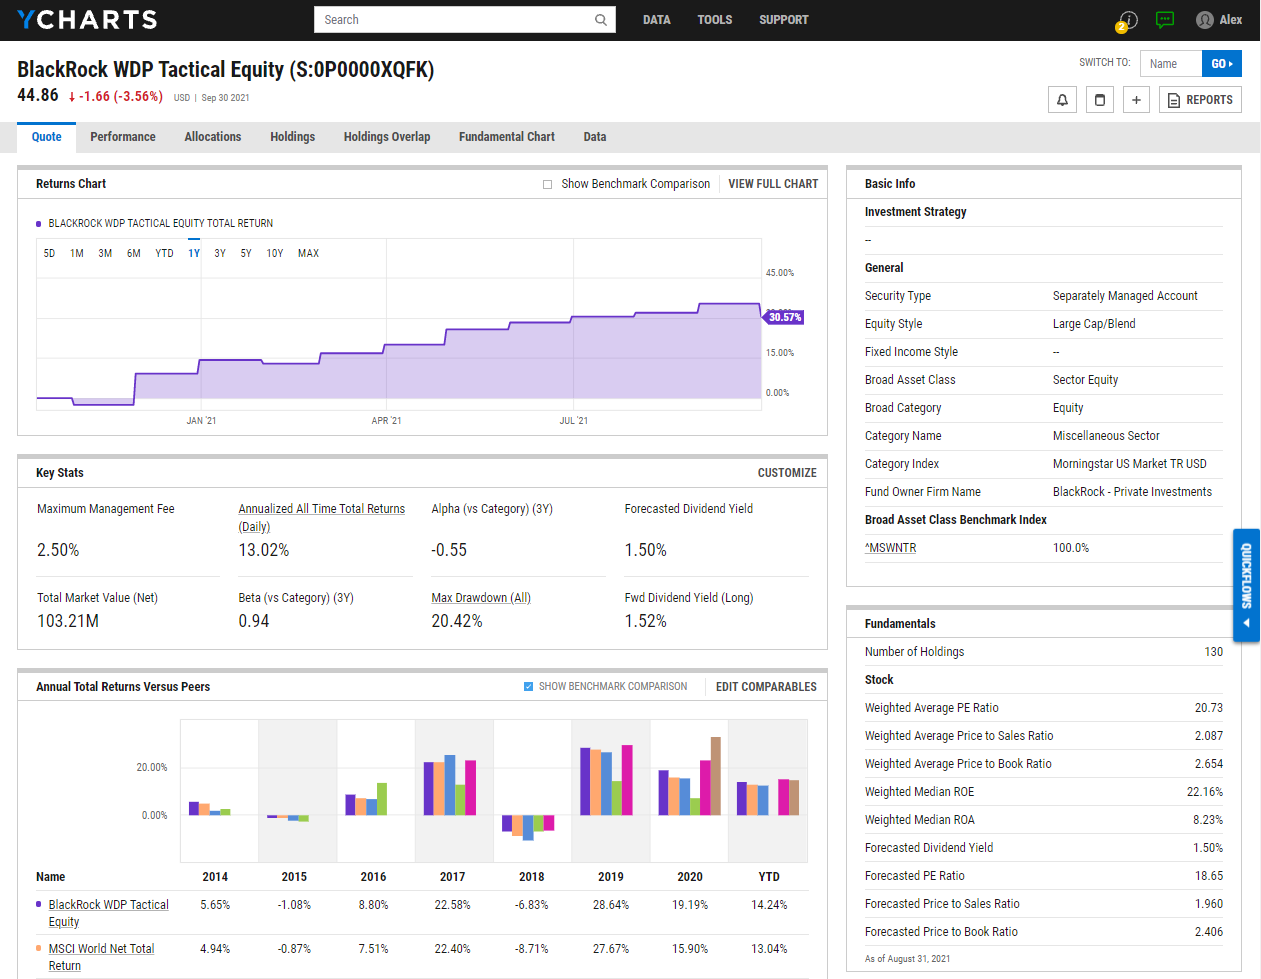
Separate account data on YCharts includes performance, risk, allocation, and exposure metrics, plus other SMA attributes like manager tenures, holdings, fees, and benchmarks.
Every SMA Quote Page gives access to key stats, performance, allocations, holdings, and the ability to create and download PDF-based SMA reports. See an example quote page for the BlackRock WDP Tactical Equity SMA below:
Click to access SMA Data in YCharts
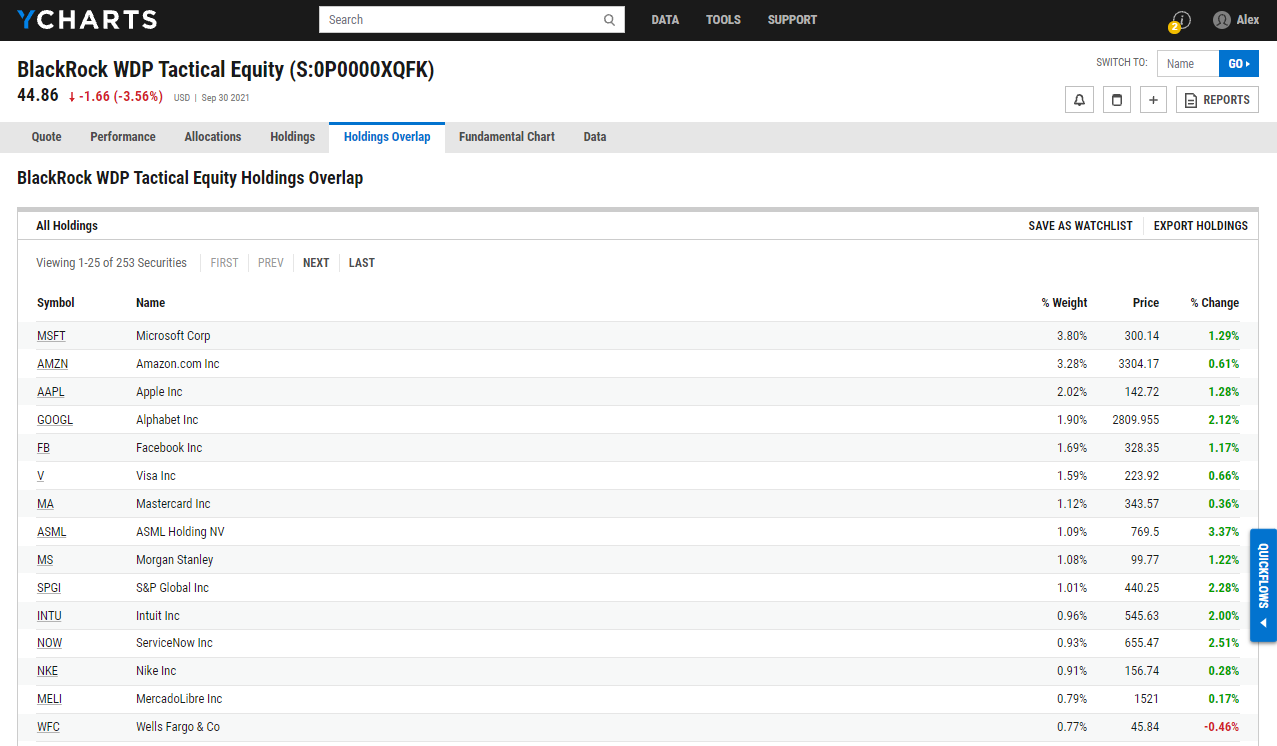
Purpose-built tabs on SMA quote pages can be used to build a deeper understanding of the strategy. For example, the “Holdings” tab gives information about the SMA’s top 25 holdings, and the “Holdings Overlap” provides a more granular view of combined exposures at the individual stock and bond level. These tabs are just one way to ensure diversification and identify whether an individual security is over (or under) weighted.
Click to access SMA Data in YCharts
Drive Meaningful Conversation with Custom Reports
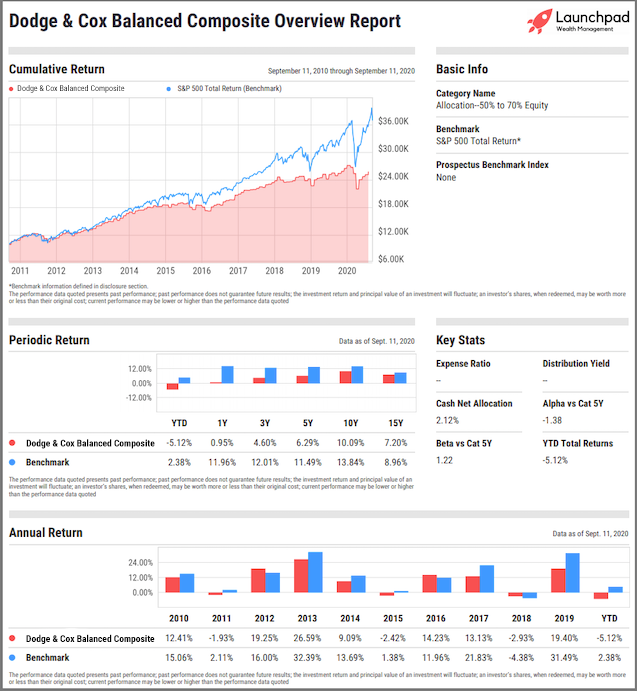
YCharts Overview and Comparison Reports are sales and conversation enablers that create engaging, personalized client experiences. All Custom Reports are PDF-based, customizable with firm logos and colors, and help you discuss the advantages and suitability of separate accounts with clients and prospects.
A valuable capability, Comparison Reports put two SMAs—or an SMA and a mutual fund or ETF or other security type—head-to-head so that you can best position your products in front of clients. See an example below, or access a Sample SMA Report.
Click to learn more about YCharts Custom Reports
Stay One Step Ahead of the Competition
Just as with mutual funds and ETFs, the YCharts Fund Screener enables you to filter our universe of 12,000+ SMAs and Models to build intelligence on your competition. The Fund Screener makes it easy to identify the top SMAs or Models in specific categories, based on size or performance. For instance, if you wanted to dial into a specific SMA or UMA Family (e.g. BlackRock, Inc.), you would be able to filter using the “Fund Family” securities attribute as a means of scoping out competitors. From there, you can add additional metrics to find ways to differentiate your funds from the competition.
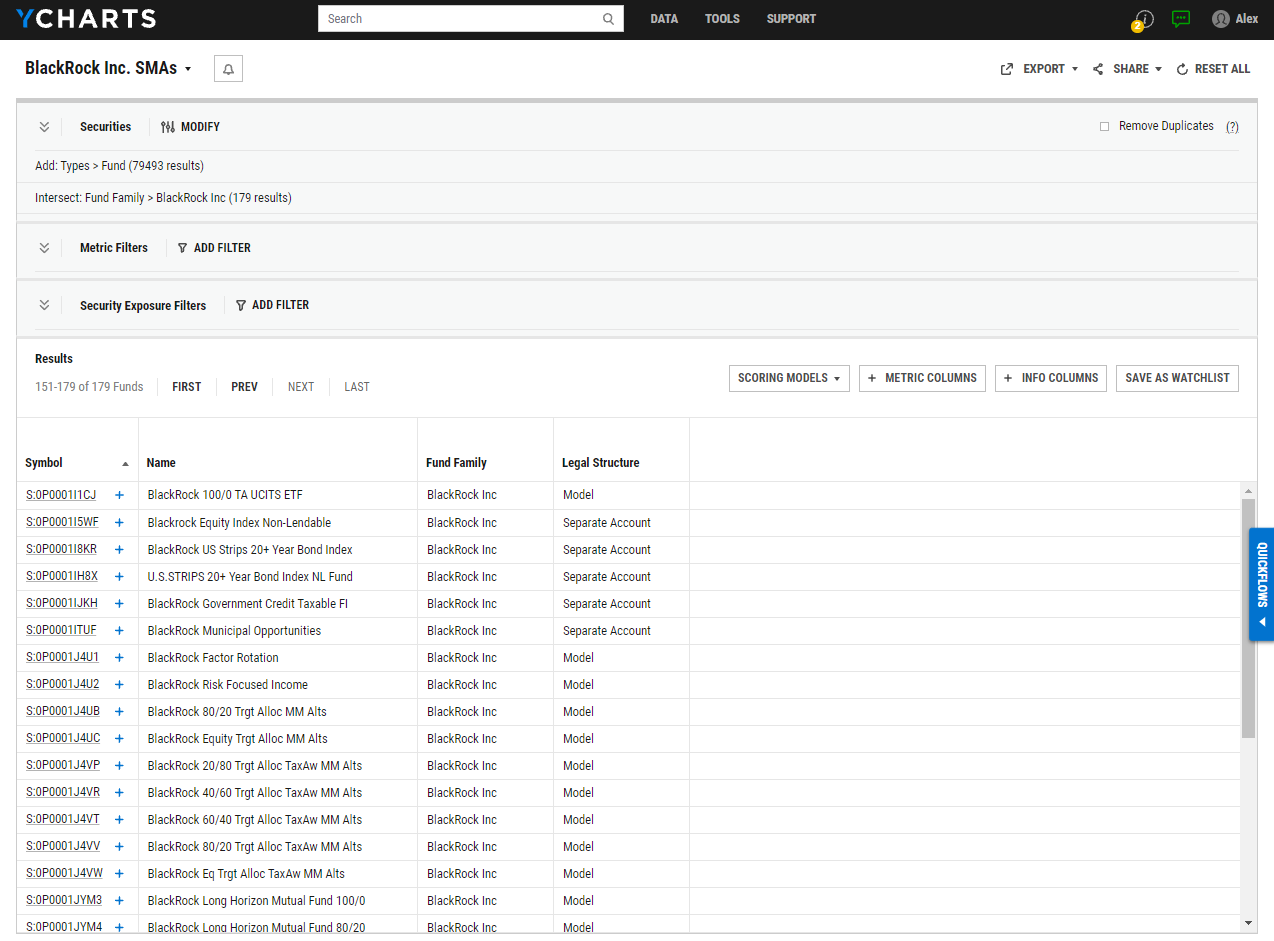
Once you’ve compiled your target list, you can add a custom scoring model, performance & risk metrics, and qualitative information columns. A popular information column amongst wholesalers is “Legal Structure”, which more clearly identifies SMAs from UMAs.
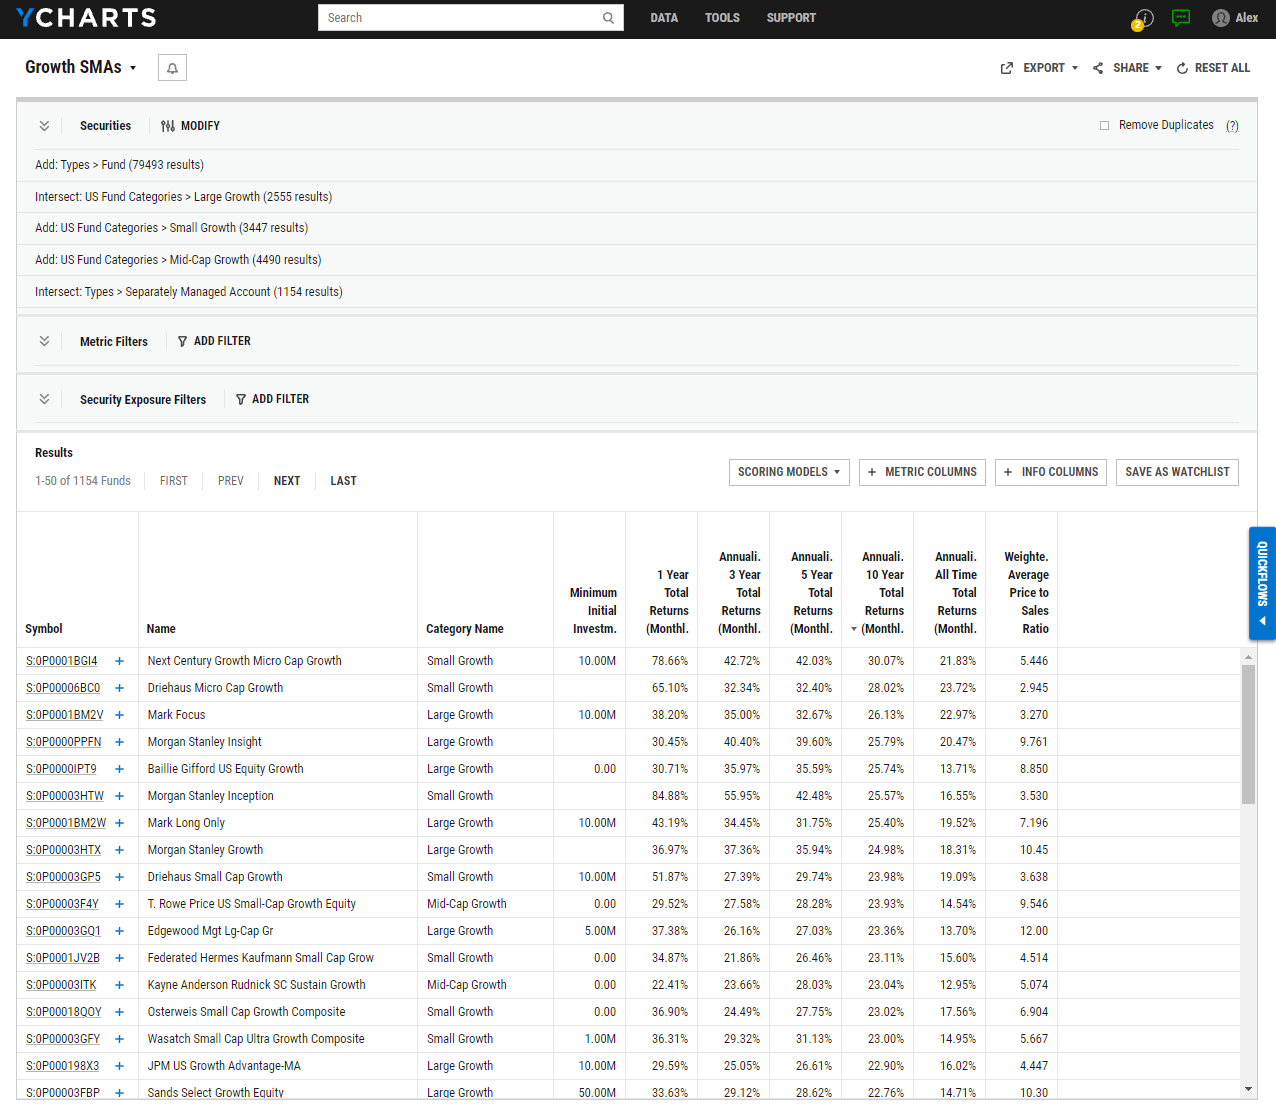
Jumpstart your Research with Pre-Built Templates
To help you find opportunities in separate accounts or models even faster, we’ve added pre-built screens that align with common investment goals. For example, the Growth SMAs screener template automatically finds separately managed accounts with growth tilts and presents several key metrics for further evaluation. See below:
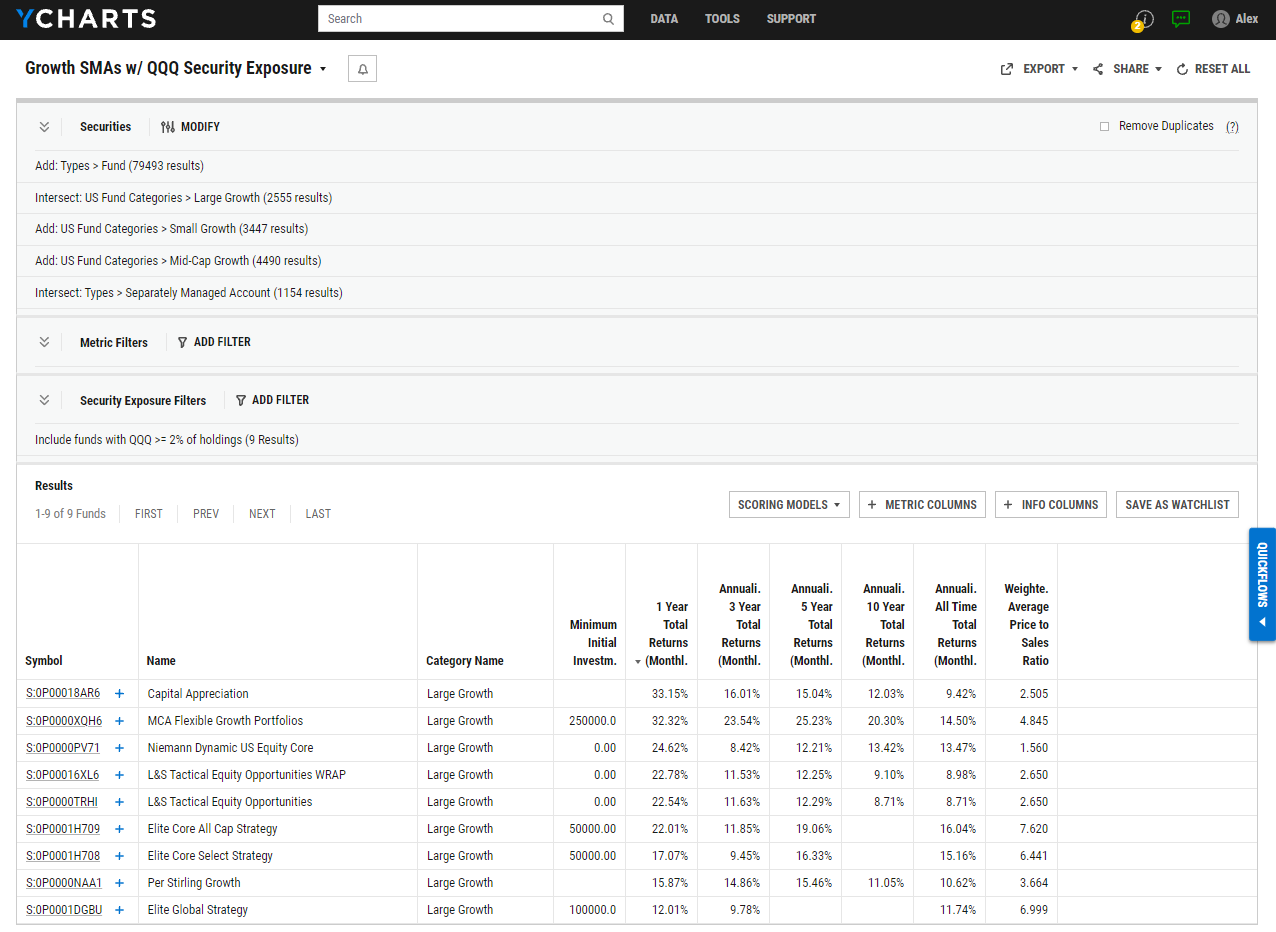
Create a Hit List Based on Security Exposure
For a more targeted approach, you can narrow your list of SMAs by their percent-exposure to a particular security. Building off of the previous example, this enables you to narrow the Growth SMAs screen to identify SMAs or Models that leverage a specific ETF, such as the Invesco QQQ Trust (QQQ), at or beyond a specific exposure percentage. For a wholesaler, this creates the potential for replacement opportunities using their own family of funds.
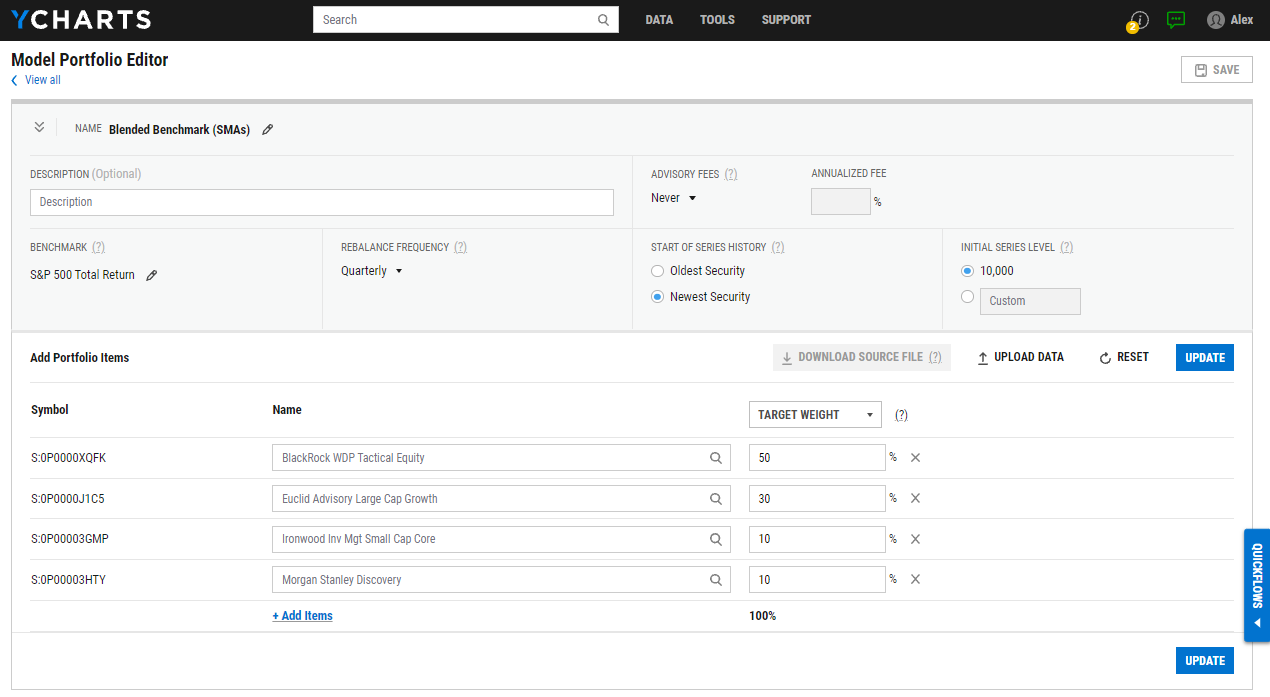
Create Custom Blends of SMAs or Models
It’s important to ensure that any portfolio strategy is tailor-made and driven by a client’s goals. Whether that means a more conventional 60/40 portfolio, such as 60% S&P 500 and 40% US Aggregate Bond or a less traditional blend, but more tailored option made up of various funds and securities—including SMAs & UMAs—YCharts allows users to construct custom portfolio strategies via the Model Portfolios tool ensuring an optimal allocation for advisors and their clients.
Connect With YCharts
For more info, a product demo, or to trial using SMA data, schedule time with us here, or contact us via email at sales@ycharts.com
If you already have YCharts, contact your Account Manager to request access to SMA Data.
Disclaimer
©2021 YCharts, Inc. All Rights Reserved. YCharts, Inc. (“YCharts”) is not registered with the U.S. Securities and Exchange Commission (or with the securities regulatory authority or body of any state or any other jurisdiction) as an investment adviser, broker-dealer, or in any other capacity, and does not purport to provide investment advice or make investment recommendations. This report has been generated through the application of the analytical tools and data provided through ycharts.com and is intended solely to assist you or your investment or other adviser(s) in conducting investment research. You should not construe this report as an offer to buy or sell, as a solicitation of an offer to buy or sell, or as a recommendation to buy, sell, hold or trade, any security or other financial instrument. For further information regarding your use of this report, please go to: ycharts.com/about/disclosure
Next Article
New on YCharts: Client-Friendly Data Table PDFsRead More →