The 10 Best Performing Growth ETFs in the Last 10 Years
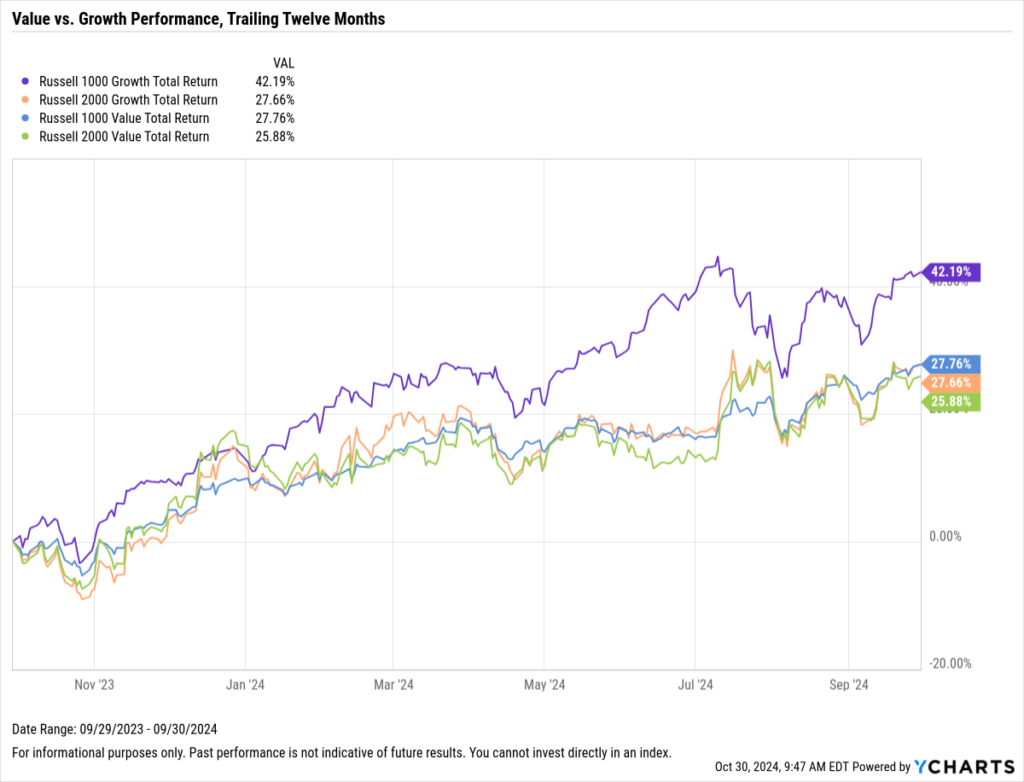
Over the past twelve months, large-cap growth stocks have outperformed other equity styles, and small-cap growth names have delivered returns comparable to those of large-cap value stocks.
This trend has been fueled mainly by a significant rally in the technology sector, which constitutes 51% of the Russell 1000 Growth Index (represented by IWF) and 21.5% of the Russell 2000 Growth Index (represented by IWO).
Download Visual | Modify in YCharts
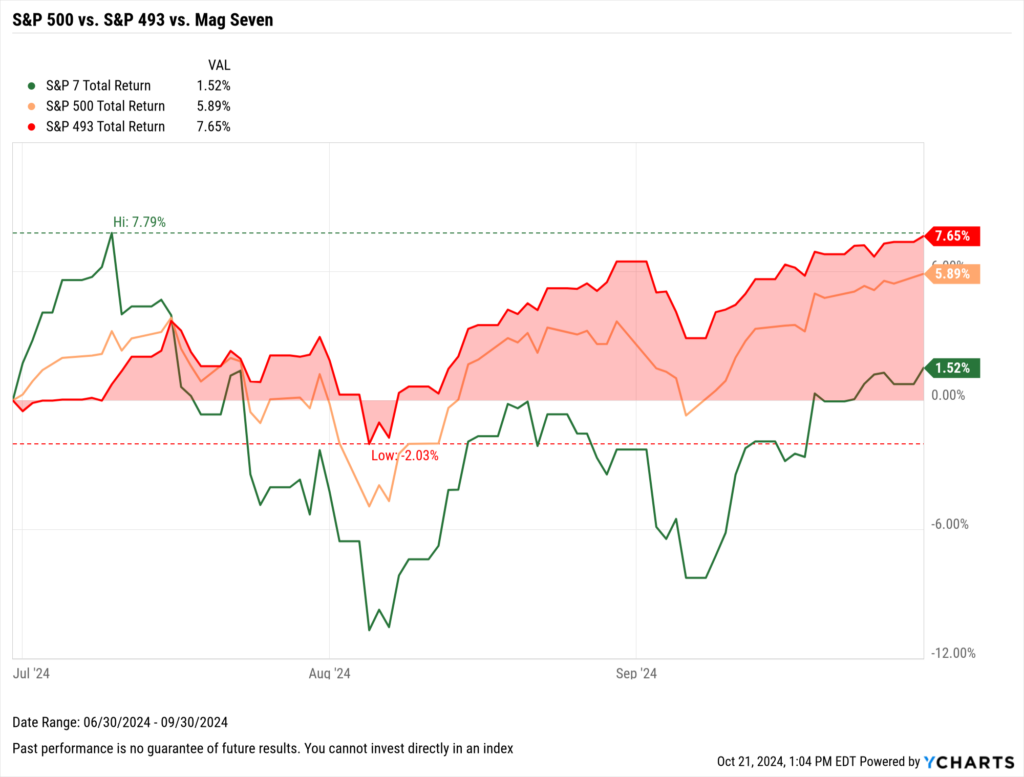
The year started with three major stocks propelling a significant portion of the market’s gains, including 49% of the S&P 500’s first-half returns. However, this dynamic shifted in the third quarter as the S&P 493 outperformed the “Magnificent Seven” stocks (see our full Q3 Economic Update for more on this storyline).
Download Visual | Modify in YCharts | Get in Touch to Access Chart
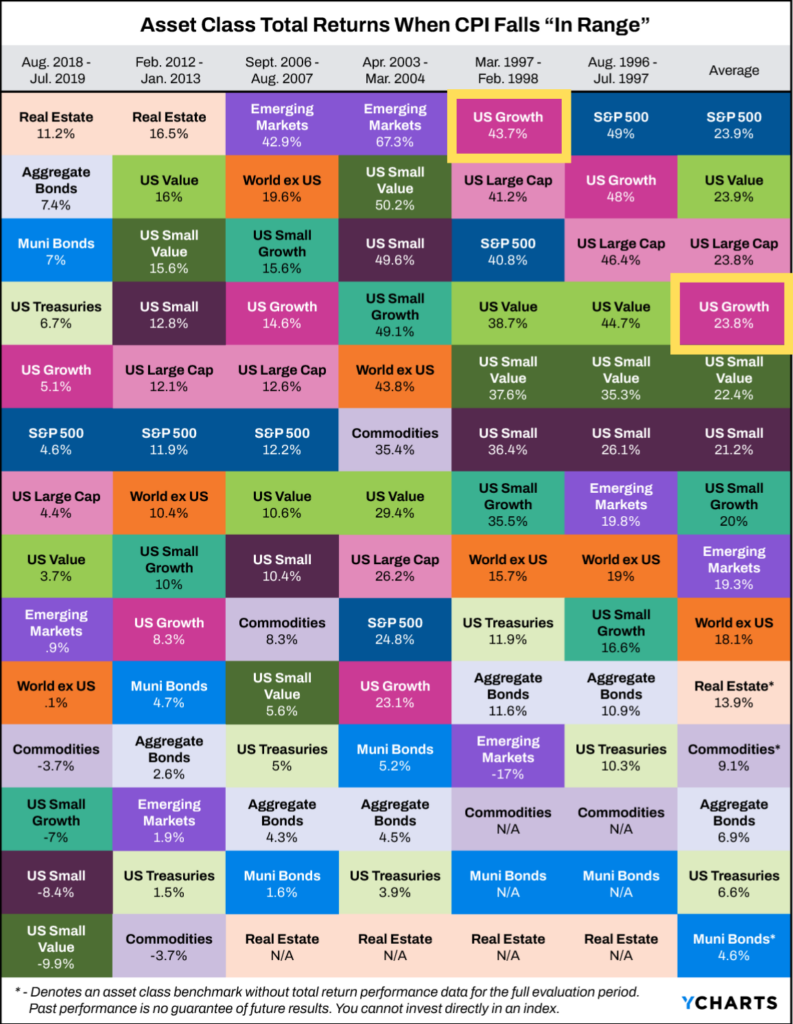
This market rotation can be partly attributed to a shift in monetary policy when the Federal Reserve implemented its first rate cut of the cycle—a 50 basis point cut in September. This adjustment was primarily in response to inflation rates falling closer to the Fed’s target and in accordance with the other half of their dual mandate—fostering maximum employment.
Our recent white paper, “Which Asset Classes Perform Best When Inflation Is Driven Lower?” highlights that equities tend to excel in stable price environments. On average, growth stocks have returned 23.8% during the six periods where inflation was effectively driven down and contained. Between March 1997 and February 1998, growth stocks produced a 43.7% return that outperformed all other asset classes.
Building on these insights, we have curated a list of the top-performing growth ETFs on a 1, 3, 5, 10, and year-to-date basis (excluding leveraged and inverse ETFs). Additionally, you’ll see examples of how efficiently you can examine each fund’s sector exposure using Quickflows in YCharts.
For a broader perspective, explore our additional blogs on the top-performing REITs, Value, Emerging Market, and overall equity ETFs to see how these growth strategies compare to the best in other categories.
Click to jump to a section:
- Best-Performing Growth ETFs YTD
- Best-Performing Growth ETFs over the Last Year
- Growth ETFs with the Lowest Drawdown in the Last Year
- Best-Performing Growth ETFs in the Last 3 Years
- Growth ETFs with the Lowest Drawdown in the Last 3 Years
- Best-Performing Growth ETFs in the Last 5 Years
- Growth ETFs with the Lowest Drawdown in the Last 5 Years
- Best-Performing Growth ETFs in the Last 10 Years
- Growth ETFs with the Lowest Drawdown in the Last 10 Years
- What Was the Growth of $10,000 Over the Last 10 Years?
Best Performing Growth ETFs YTD
These are the best-performing Growth ETFs year-to-date in 2024, as of September 30, 2024.
| Symbol | Name | Year to Date Total Returns (As of September 30, 2024) | Total Returns Since Inception (As of September 30, 2024) | Assets Under Management ($M) |
|---|---|---|---|---|
| SPMO | Invesco S&P 500 Momentum ETF | 38.83% | 304.42% | $2,841.59 |
| GARP | iShares MSCI USA Quality GARP ETF | 30.29% | 120.79% | $165.90 |
| FDG | American Century Foc Dynmc Gr ETF | 30.14% | 141.11% | $251.71 |
| MTUM | iShares MSCI USA Momentum Factor ETF | 29.76% | 358.31% | $10,507.05 |
| SNPG | Xtrackers S&P 500 Growth ESG ETF | 29.63% | 82.74% | $13.36 |
| FFOG | Franklin Focused Growth ETF | 28.98% | 44.99% | $129.48 |
| AMOM | QRAFT AI-Enhanced US Large Cap Mmntm ETF | 28.82% | 128.39% | $41.59 |
| HFGO | Hartford Large Cap Growth ETF | 28.78% | 10.17% | $135.82 |
| QMOM | Alpha Architect US Quantitative Momt ETF | 28.75% | 170.43% | $266.19 |
| IWFG | NYLI Winslow Focused Large Cap Gr ETF | 28.70% | 84.79% | $10.38 |
View & Modify in Fund Screener

Download Visual | Modify in YCharts
Interested in seeing the sector exposure of these funds? It only takes two taps on your tablet or two clicks on your desktop with Quickflows:
Best-Performing Growth ETFs over the Last Year
These are the best-performing Growth ETFs over the past year as of September 30, 2024.
| Symbol | Name | 1 Year Total Returns (As of September 30, 2024) | Annualized Total Returns Since Inception (As of September 30, 2024) | Total Returns Since Inception (As of September 30, 2024) | Assets Under Management ($M) |
|---|---|---|---|---|---|
| SPMO | Invesco S&P 500 Momentum ETF | 59.14% | 17.50% | 304.42% | $2,865.80 |
| ATFV | Alger 35 ETF | 53.81% | 4.10% | 13.97% | $27.10 |
| QMOM | Alpha Architect US Quantitative Momt ETF | 50.18% | 12.16% | 170.43% | $282.79 |
| GARP | iShares MSCI USA Quality GARP ETF | 50.18% | 19.64% | 120.79% | $166.35 |
| IWFG | NYLI Winslow Focused Large Cap Gr ETF | 49.53% | 31.38% | 84.79% | $10.44 |
| HFGO | Hartford Large Cap Growth ETF | 49.15% | 3.70% | 10.17% | $138.77 |
| FBCG | Fidelity Blue Chip Growth ETF | 47.74% | 19.65% | 114.35% | $2,443.71 |
| IWLG | NYLI Winslow Large Cap Growth ETF | 47.16% | 29.48% | 78.82% | $76.62 |
| FDG | American Century Foc Dynmc Gr ETF | 46.95% | 22.05% | 141.11% | $253.68 |
| NWLG | Nuveen Winslow Large-Cap Growth ESG ETF | 46.14% | 8.46% | 27.60% | $9.51 |
View & Modify in Fund Screener

Download Visual | Modify in YCharts | View Sector Exposure in Comp Tables
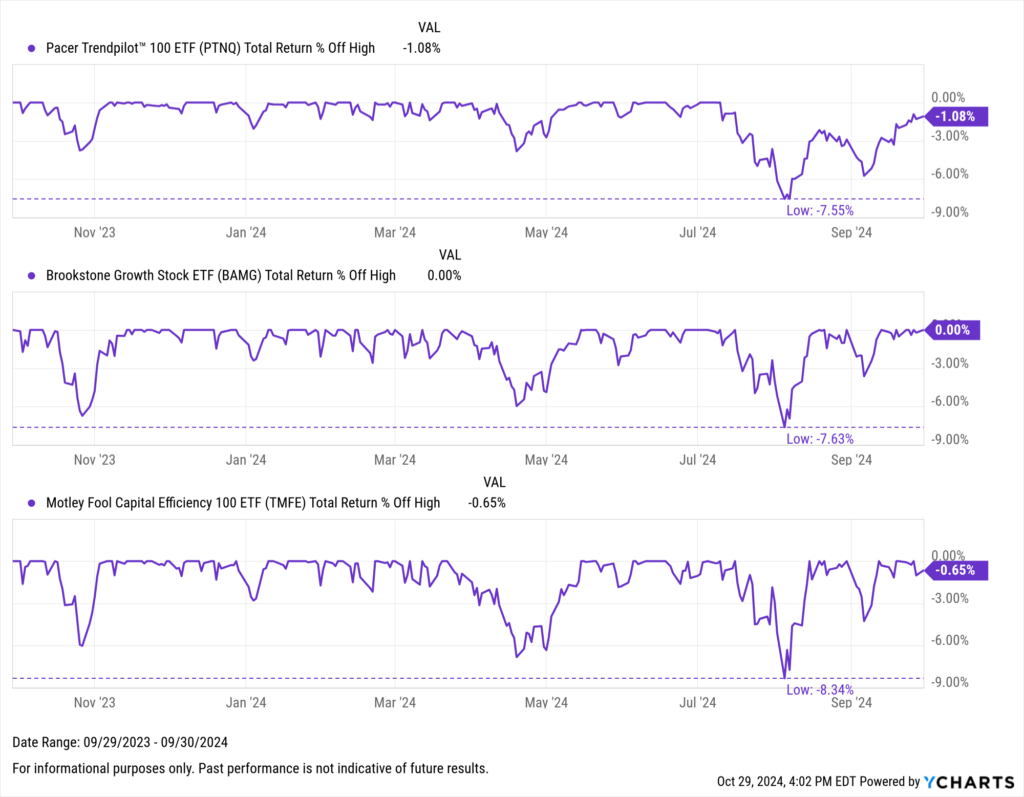
Growth ETFs with the Lowest Drawdown in the Last Year
These Growth ETFs had the lowest drawdown over the past year as of September 30, 2024.
| Symbol | Name | Max Drawdown (1Y) | Max Drawdown (Since Inception) | Assets Under Management ($M) |
|---|---|---|---|---|
| PTNQ | Pacer Trendpilot 100 ETF | 7.6% | 28.1% | $1,336.07 |
| BAMG | Brookstone Growth Stock ETF | 7.6% | 7.6% | $91.52 |
| TMFE | Motley Fool Capital Efficiency 100 ETF | 8.4% | 31.1% | $52.01 |
| BCHP | Principal Focused Blue Chip ETF | 8.6% | 8.6% | $84.61 |
| SXQG | ETC 6 Meridian Quality Growth ETF | 9.2% | 34.0% | $47.51 |
| MBCC | Monarch Blue Chips Core ETF | 9.4% | 30.6% | $114.65 |
| GLRY | Inspire Momentum ETF | 9.4% | 40.6% | $71.84 |
| JMOM | JPMorgan US Momentum Factor ETF | 9.5% | 34.3% | $1,179.14 |
| FTGS | First Trust Growth Strength ETF | 9.5% | 9.5% | $783.53 |
| PLDR | Putnam Sustainable Leaders ETF | 9.7% | 29.6% | $626.82 |
View & Modify in Fund Screener
Download Visual | Modify in YCharts
Best Performing Growth ETFs in the Last 3 Years
These are the best-performing Growth ETFs on an annualized basis between September 30, 2021 and September 30, 2024.
| Symbol | Name | Annualized 3 Year Total Returns (As of September 30, 2024) | 3 Year Total Returns (As of September 30, 2024) | Assets Under Management ($M) |
|---|---|---|---|---|
| SPMO | Invesco S&P 500 Momentum ETF | 16.07% | 56.38% | $2,865.80 |
| GARP | iShares MSCI USA Quality GARP ETF | 15.18% | 52.82% | $166.35 |
| SPUS | SP Funds S&P 500 Sharia Industry Ex ETF | 13.79% | 47.35% | $815.61 |
| IWY | iShares Russell Top 200 Growth ETF | 13.74% | 47.13% | $12,296.59 |
| FELG | Fidelity Enhanced Large Cap Growth ETF | 13.05% | 44.47% | $2,982.06 |
| MMTM | SPDR S&P 1500 Momentum Tilt ETF | 12.66% | 43.00% | $123.86 |
| SCHG | Schwab US Large-Cap Growth ETFTM | 12.62% | 42.84% | $34,105.71 |
| TMFC | Motley Fool 100 ETF | 12.44% | 42.16% | $1,080.95 |
| USXF | iShares ESG Advanced MSCI USA ETF | 12.14% | 41.04% | $1,221.87 |
| VONG | Vanguard Russell 1000 Growth ETF | 11.92% | 40.21% | $22,503.44 |
View & Modify in Fund Screener

Download Visual | Modify in YCharts | View Sector Exposure in Comp Tables
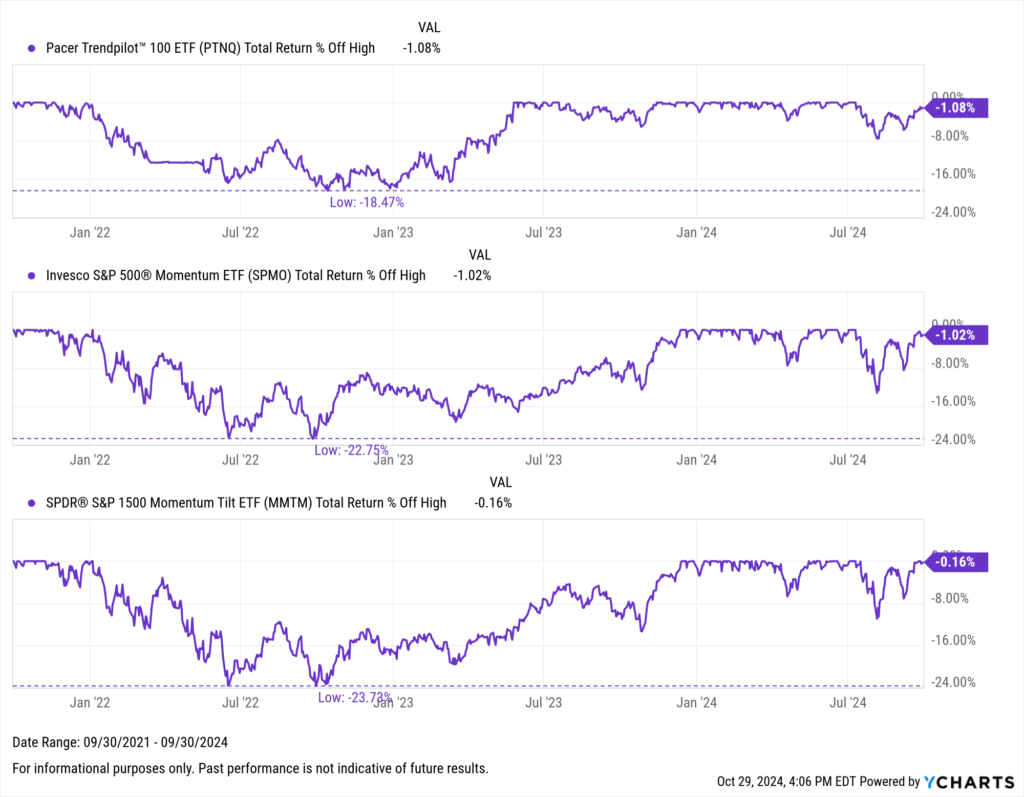
Growth ETFs with the Lowest Drawdown in the Last 3 Years
These Growth ETFs had the lowest drawdown between September 30, 2021 and September 30, 2024.
| Symbol | Name | Max Drawdown (3Y) | Max Drawdown (Since Inception) | Assets Under Management ($M) |
|---|---|---|---|---|
| PTNQ | Pacer Trendpilot 100 ETF | 18.5% | 28.1% | $1,336.07 |
| SPMO | Invesco S&P 500 Momentum ETF | 22.7% | 30.9% | $2,865.80 |
| MMTM | SPDR S&P 1500 Momentum Tilt ETF | 23.7% | 33.8% | $123.86 |
| QQXT | First Trust NASDAQ-100 ex-Tech Sect ETF | 24.7% | 57.5% | $121.30 |
| FDMO | Fidelity Momentum Factor ETF | 25.4% | 33.9% | $328.22 |
| VFMO | Vanguard US Momentum Factor ETF | 25.8% | 36.8% | $664.53 |
| DWUS | AdvisorShares DW FSM US Core ETF | 26.5% | 30.5% | $115.69 |
| JOET | Virtus Terranova US Quality Momentum ETF | 26.6% | 26.6% | $123.68 |
| SFY | SoFi Select 500 ETF | 27.7% | 33.2% | $937.32 |
| SPUS | SP Funds S&P 500 Sharia Industry Ex ETF | 28.1% | 30.8% | $815.61 |
View & Modify in Fund Screener
Download Visual | Modify in YCharts
Best Performing Growth ETFs in the Last 5 Years
These are the best-performing Growth ETFs on an annualized basis between September 30, 2019 and September 30, 2024.
| Symbol | Name | Annualized 5 Year Total Returns (As of September 30, 2024) | 5 Year Total Returns (As of September 30, 2024) | Assets Under Management ($M) |
|---|---|---|---|---|
| QQQ | Invesco QQQ Trust | 21.71% | 167.06% | $300,526.71 |
| IWY | iShares Russell Top 200 Growth ETF | 21.27% | 162.24% | $12,296.59 |
| SCHG | Schwab US Large-Cap Growth ETFTM | 20.57% | 154.81% | $34,105.71 |
| TMFC | Motley Fool 100 ETF | 20.56% | 154.72% | $1,080.95 |
| MGK | Vanguard Mega Cap Growth ETF | 20.19% | 150.85% | $22,921.62 |
| FELG | Fidelity Enhanced Large Cap Growth ETF | 20.18% | 150.66% | $2,982.06 |
| VONG | Vanguard Russell 1000 Growth ETF | 19.62% | 144.91% | $22,503.44 |
| IWF | iShares Russell 1000 Growth ETF | 19.52% | 143.94% | $99,938.72 |
| ONEQ | Fidelity Nasdaq Composite ETF | 19.07% | 139.38% | $7,046.81 |
| NULG | Nuveen ESG Large-Cap Growth ETF | 19.04% | 139.04% | $1,538.14 |
View & Modify in Fund Screener

Download Visual | Modify in YCharts | View Sector Exposure in Comp Tables
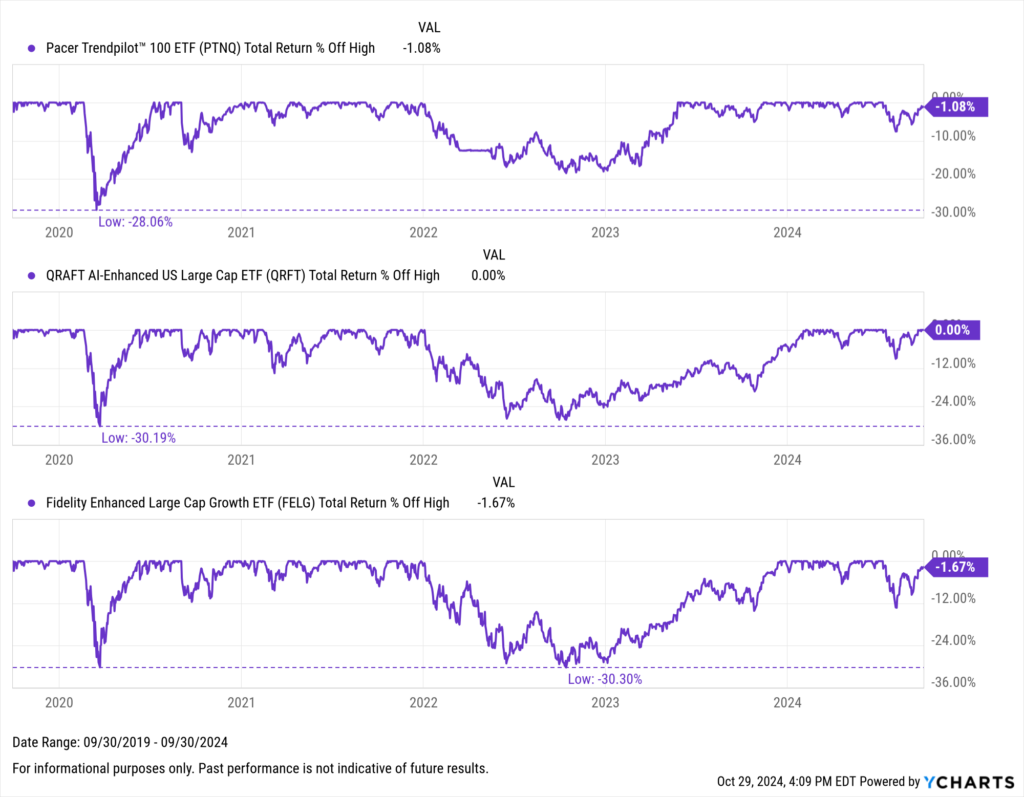
Growth ETFs with the Lowest Drawdown in the Last 5 Years
These Growth ETFs had the lowest drawdown between September 30, 2019 and September 30, 2024.
| Symbol | Name | Max Drawdown (5Y) | Max Drawdown (Since Inception) | Share Class Assets Under Management |
|---|---|---|---|---|
| PTNQ | Pacer Trendpilot 100 ETF | 28.1% | 28.1% | $1,336.07 |
| QRFT | QRAFT AI-Enhanced US Large Cap ETF | 30.2% | 30.2% | $13.32 |
| FELG | Fidelity Enhanced Large Cap Growth ETF | 30.3% | 50.9% | $2,982.06 |
| QQXT | First Trust NASDAQ-100 ex-Tech Sect ETF | 30.4% | 57.5% | $121.30 |
| SPMO | Invesco S&P 500 Momentum ETF | 30.9% | 30.9% | $2,865.80 |
| QQQE | Direxion NASDAQ-100 Equal Wtd ETF | 32.1% | 32.1% | $1,289.61 |
| QQEW | First Trust NASDAQ-100 Equal Wtd ETF | 32.1% | 58.2% | $1,951.39 |
| IUSG | iShares Core S&P US Growth ETF | 32.3% | 63.4% | $20,075.19 |
| PWB | Invesco Large Cap Growth ETF | 32.4% | 52.7% | $950.79 |
| QGRO | American Century US Quality Growth ETF | 32.6% | 32.6% | $967.36 |
View & Modify in Fund Screener
Download Visual | Modify in YCharts
Best Performing Growth ETFs in the Last 10 Years
These are the best-performing Growth ETFs on an annualized basis between September 30, 2014 and September 30, 2024.
| Symbol | Name | Annualized 10 Year Total Returns (As of September 30, 2024) | 10 Year Total Returns (As of September 30, 2024) | Assets Under Management ($M) |
|---|---|---|---|---|
| QQQ | Invesco QQQ Trust | 18.28% | 435.83% | $300,526.71 |
| IWY | iShares Russell Top 200 Growth ETF | 17.57% | 404.55% | $12,296.59 |
| SCHG | Schwab US Large-Cap Growth ETF | 16.48% | 359.84% | $34,105.71 |
| VONG | Vanguard Russell 1000 Growth ETF | 16.38% | 355.85% | $22,503.44 |
| MGK | Vanguard Mega Cap Growth ETF | 16.35% | 354.71% | $22,921.62 |
| IWF | iShares Russell 1000 Growth ETF | 16.32% | 353.30% | $99,938.72 |
| ONEQ | Fidelity Nasdaq Composite ETF | 16.21% | 349.11% | $7,046.81 |
| FELG | Fidelity Enhanced Large Cap Growth ETF | 15.63% | 327.45% | $2,982.06 |
| VUG | Vanguard Growth ETF | 15.55% | 324.18% | $140,282.11 |
| ILCG | iShares Morningstar Growth ETF | 15.29% | 314.81% | $2,396.50 |
View & Modify in Fund Screener

Download Visual | Modify in YCharts | View Sector Exposure in Comp Tables
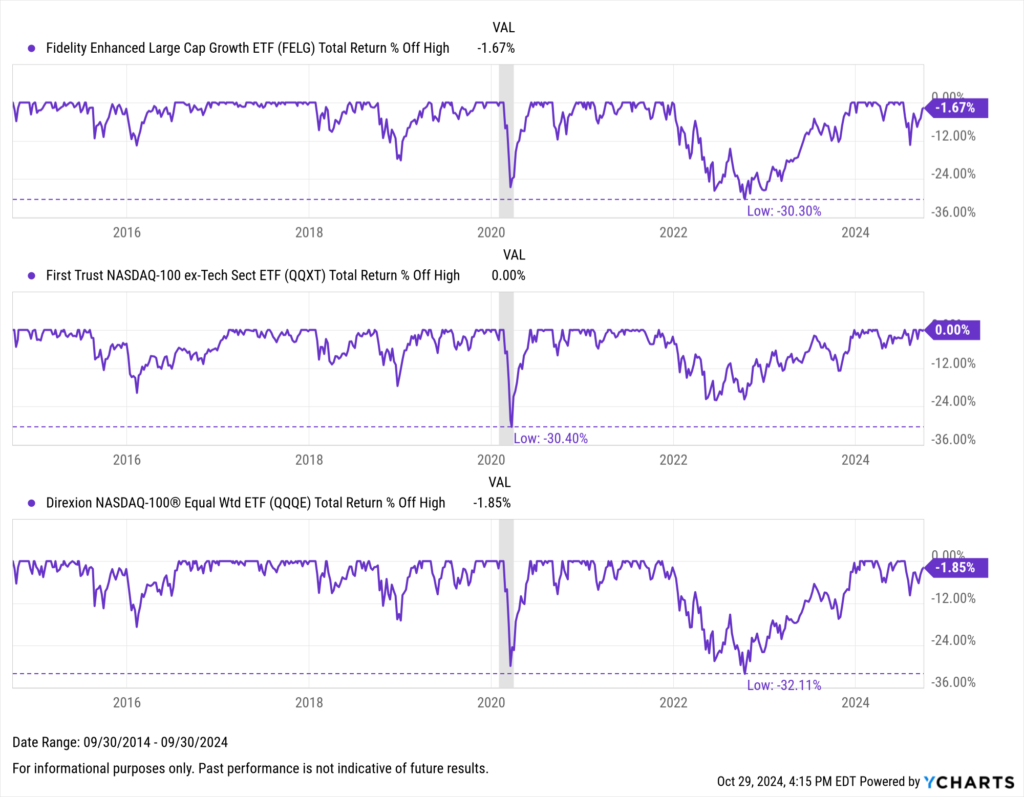
Growth ETFs with the Lowest Drawdown in the Last 10 Years
These Growth ETFs had the lowest drawdown between September 30, 2014 and September 30, 2024.
| Symbol | Name | Max Drawdown (10Y) | Max Drawdown (Since Inception) | Assets Under Management ($M) |
|---|---|---|---|---|
| FELG | Fidelity Enhanced Large Cap Growth ETF | 30.3% | 50.9% | $2,982.06 |
| QQXT | First Trust NASDAQ-100 ex-Tech Sect ETF | 30.4% | 57.5% | $121.30 |
| QQQE | Direxion NASDAQ-100 Equal Wtd ETF | 32.1% | 32.1% | $1,289.61 |
| QQEW | First Trust NASDAQ-100 Equal Wtd ETF | 32.1% | 58.2% | $1,951.39 |
| IUSG | iShares Core S&P US Growth ETF | 32.3% | 63.4% | $20,075.19 |
| PWB | Invesco Large Cap Growth ETF | 32.4% | 52.7% | $950.79 |
| SPYG | SPDR Portfolio S&P 500 Growth ETF | 32.7% | 68.2% | $30,717.31 |
| IWY | iShares Russell Top 200 Growth ETF | 32.7% | 32.7% | $12,296.59 |
| IVW | iShares S&P 500 Growth ETF | 32.7% | 57.3% | $54,409.32 |
| IWF | iShares Russell 1000 Growth ETF | 32.7% | 64.2% | $99,938.72 |
View & Modify in Fund Screener
Download Visual | Modify in YCharts
What Was the Growth of $10,000 Over the Last 10 Years?
If you invested $10,000 10 years ago into any of the ten best-performing Growth ETFs over the last 10 years, your balance today would be no less than $40K. (See the best-performing equity ETFs, Value ETFs, and Emerging Market ETFs for comparison)
The best-performing Growth ETF over the past decade was the Invesco QQQ Trust (QQQ). A $10,000 investment into QQQ 10 years ago would be worth over $53K today. Right behind it was the iShares Russell Top 200 Growth ETF (IWY); investing $10,000 into IWY back in 2014 would’ve turned into over $50K.

Download Visual | Modify in YCharts
Advisors and distribution teams can effectively explore and compare the performance of various Growth ETFs or any other ETF or mutual fund using YCharts tools like the Fund Screener, Comp Tables, and Quickflows, simplifying the process of identifying top performers or assessing sector exposures with ease. These functionalities underscore the utility of YCharts in facilitating informed investment decisions, particularly in a shifting economic landscape.
Whenever you’re ready, there are 3 ways YCharts can help you:
Interested in doing further ETF research with YCharts?
Email us at hello@ycharts.com or call (866) 965-7552. You’ll get a response from one of our Chicago-based team members.
Want to test out YCharts for free?
Start a no-risk 7-Day Free Trial.
Want to know which Asset Classes Perform Best When Inflation is Driven Lower? Download our latest piece of research on the subject:
Get your copy of “Which Asset Classes Perform Best As Inflation is Driven Lower” here:Disclaimer
©2024 YCharts, Inc. All Rights Reserved. YCharts, Inc. (“YCharts”) is not registered with the U.S. Securities and Exchange Commission (or with the securities regulatory authority or body of any state or any other jurisdiction) as an investment adviser, broker-dealer or in any other capacity, and does not purport to provide investment advice or make investment recommendations. This report has been generated through application of the analytical tools and data provided through ycharts.com and is intended solely to assist you or your investment or other adviser(s) in conducting investment research. You should not construe this report as an offer to buy or sell, as a solicitation of an offer to buy or sell, or as a recommendation to buy, sell, hold or trade, any security or other financial instrument. For further information regarding your use of this report, please go to: ycharts.com/about/disclosure
Next Article
Economic Update: Reviewing Q3 2024Read More →