The 10 Best Performing Emerging Market ETFs over the Last 10 Years

Most investors accept that US equities have typically outperformed their global counterparts on a return basis. That has been particularly true for emerging markets in relation to US stocks.
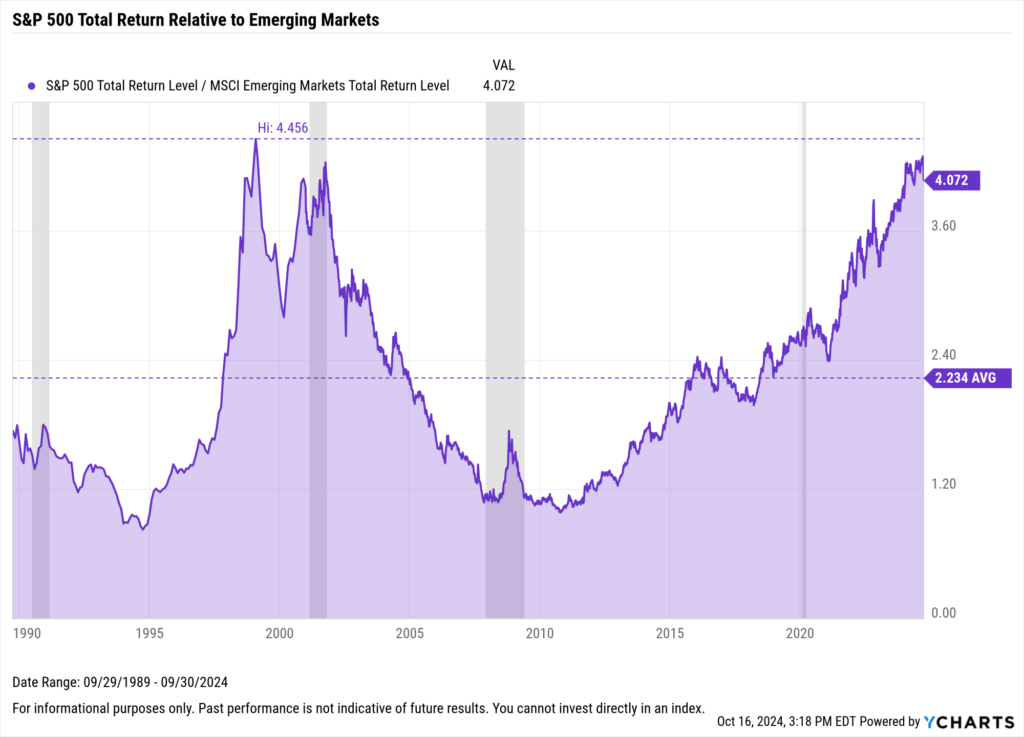
However, the current performance spread between the MSCI Emerging Market Index and the S&P 500 may have some investors anticipating a mean reversion. As of September 30, 2024, the total return performance gap between the S&P 500 and emerging markets has expanded to 4 to 1, which is well above the near-35-year average ratio of 2.2.

Download Visual | Modify in YCharts
The significant divergence between these two indices has been influenced by a combination of global economic headwinds, particularly in China, alongside rapid advancements in AI in the U.S. and a relatively strong U.S. dollar.
However, market sentiment may be shifting following significant central bank policy changes. The People’s Bank of China has introduced a fiscal and monetary policy plan that includes rate cuts aimed at stimulating growth. Concurrently, a recalibration of U.S. monetary policy, featuring a 50 basis point Fed Funds rate cut in September, can potentially soften the US dollar’s strength against other currencies, which can bolster growth for companies that rely on exporting to the U.S.
The influence of China’s monetary decisions on emerging market ETFs is particularly potent, as nearly a third of the holdings in the MSCI Emerging Market Index (represented by EEM here) are Chinese stocks. Thus, any significant policy changes by China’s central bank can ripple across most emerging market strategies.
As mentioned above, the Federal Open Market Committee (FOMC) voted to lower interest rates by a half point on September 18th, and FOMC Chair Jerome Powell highlighted increased downside risks to employment in his statement. This shift in focus towards maximizing employment suggests that the Fed may be feeling more confident about inflation, which is now within their target range. The priority now shifts to maintaining price stability.
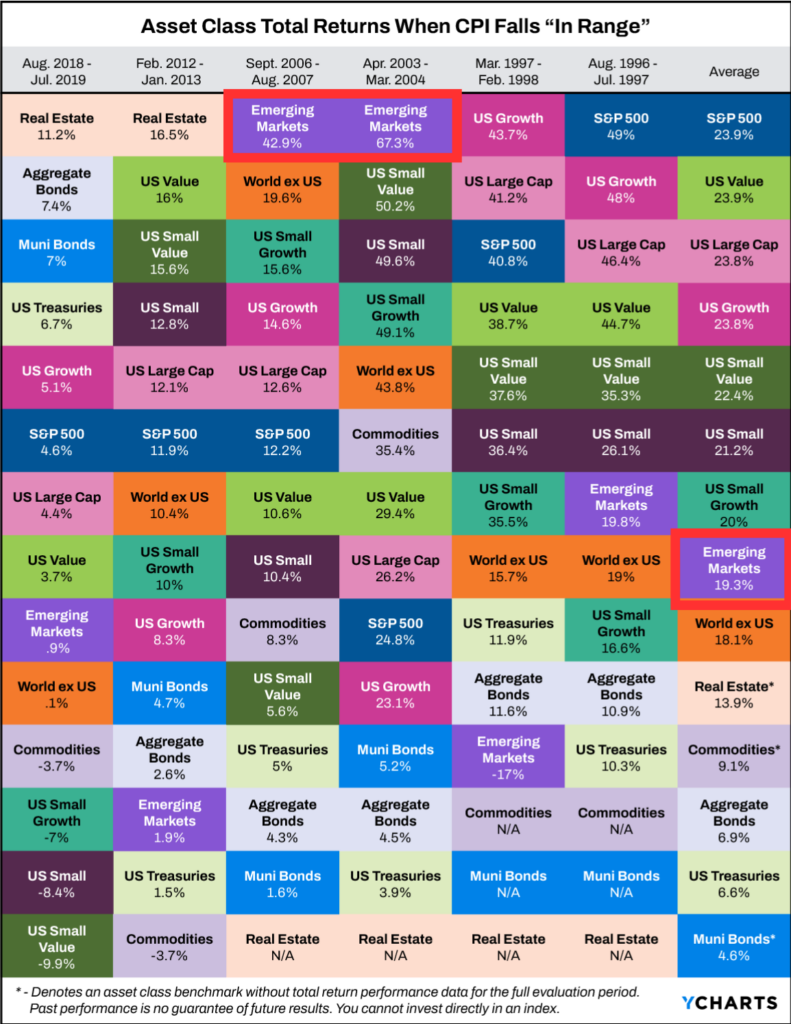
If the Fed can continue to keep prices stable, it may encourage conditions where equities–including emerging market stocks–thrive, as we found in our recent white paper, “Which Asset Classes Perform Best When Inflation Is Driven Lower?“. During controlled inflation regimes, emerging market stocks produced average returns of 19.3%, far surpassing the MSCI Emerging Markets index’s annualized return of 4.4% over the last decade.

Moreover, Emerging Markets trounced the S&P 500 between 2006-2007, highlighting the potential benefits of overcoming the typical home-country bias in investing and increasing geographic diversification in a portfolio’s equity sleeve.
With that in mind, we composed a list of the best-performing Emerging Market ETFs on a 1, 3, 5, 10, and year-to-date basis (excluding leveraged, inverse, and single-country Emerging Market ETFs).
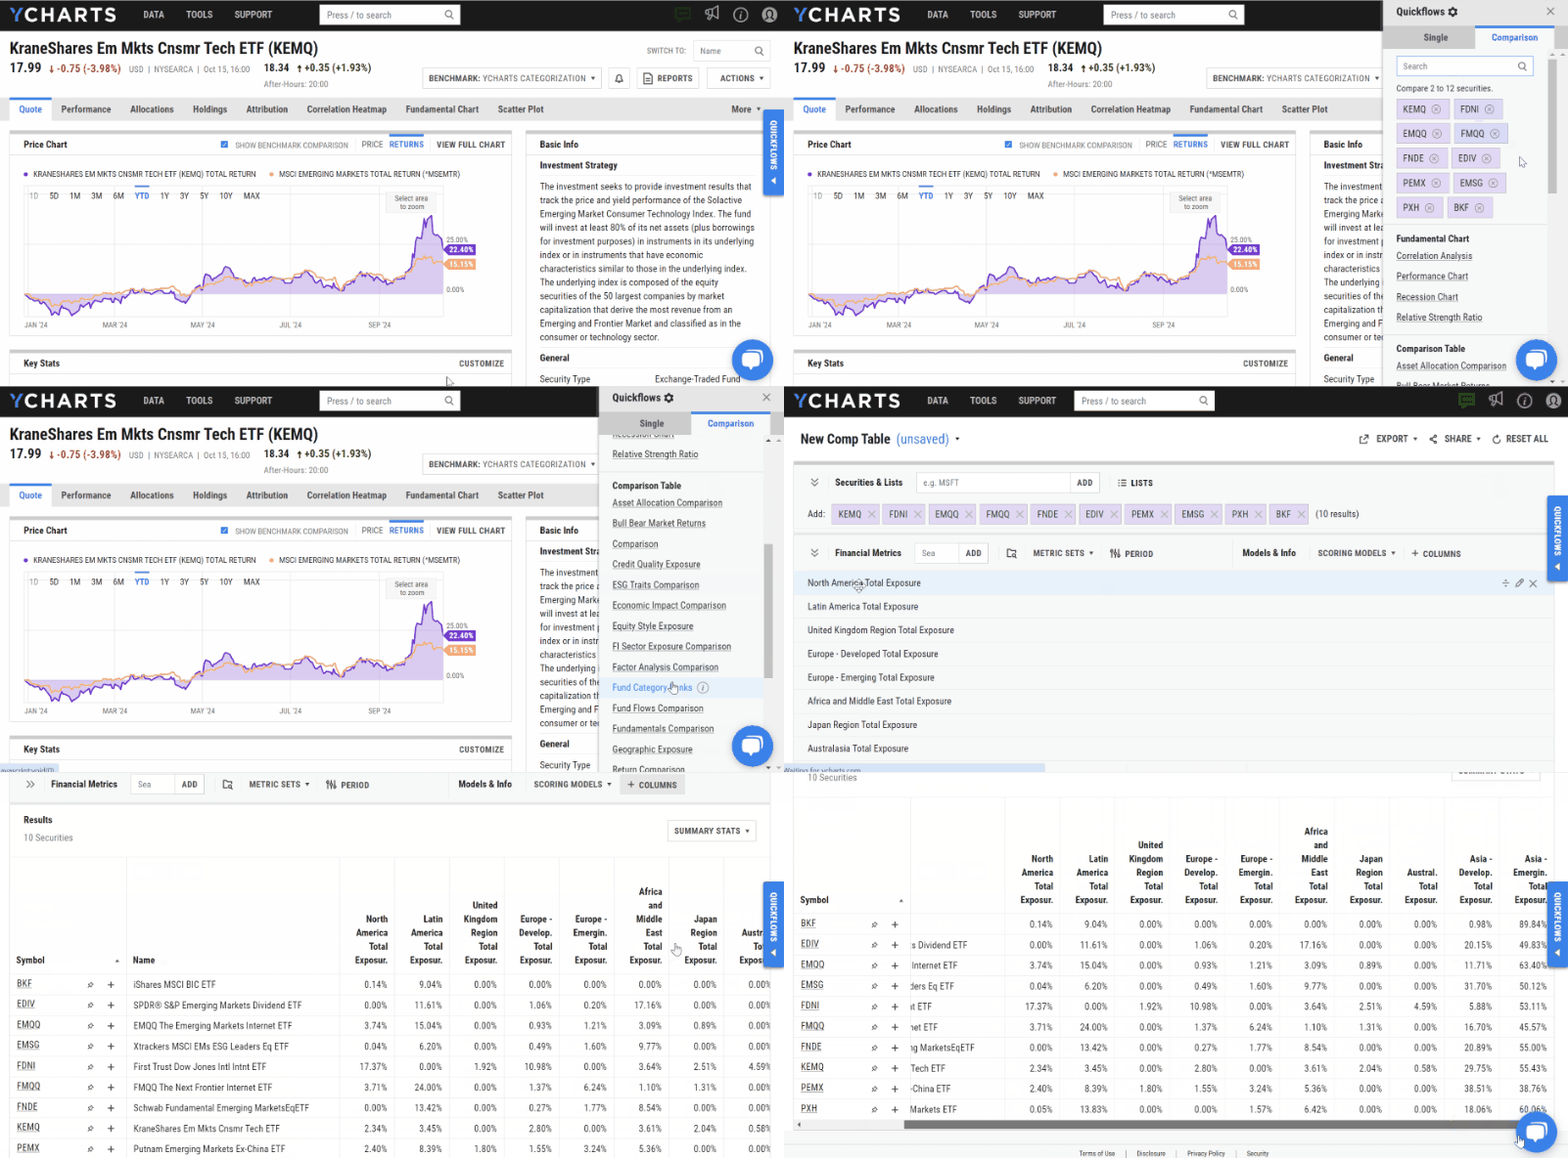
In addition, you’ll see examples of how efficiently you can examine the geographic exposure of each fund using Quickflows in YCharts.
Click to jump to a section:
- Best-Performing Emerging Market ETFs YTD
- Best-Performing Emerging Market ETFs over the Last Year
- Best-Performing Emerging Market ETFs in the Last 3 Years
- Best-Performing Emerging Market ETFs in the Last 5 Years
- Best-Performing Emerging Market ETFs in the Last 10 Years
- What Was the Growth of $10,000 Over the Last 10 Years?
Best Performing Emerging Market ETFs YTD
These are the best-performing Emerging Market ETFs year-to-date in 2024, as of September 30, 2024.
View & Modify in Fund Screener

Download Visual | Modify in YCharts
Interested in seeing the geographic exposure of these funds? It only takes two taps on your tablet or two clicks on your desktop with Quickflows:

Best-Performing Emerging Market ETFs over the Last Year
These are the best-performing Emerging Market ETFs over the past year as of September 30, 2024.
| Symbol | Name | 1 Year Total Returns (As of September 30, 2024) | Annualized Total Returns Since Inception (As of September 30, 2024) | Total Returns Since Inception (As of September 30, 2024) | Net Expense Ratio | Assets Under Management ($M) |
|---|---|---|---|---|---|---|
| FDNI | First Trust Dow Jones Intl Intnt ETF | 38.37% | 7.23% | 50.25% | 0.65% | $40.38 |
| EMQQ | EMQQ The Emerging Markets Internet ETF | 34.54% | 4.71% | 57.20% | 0.86% | $404.67 |
| KEMQ | KraneShares Em Mkts Cnsmr Tech ETF | 34.46% | -3.50% | -21.60% | 0.60% | $16.43 |
| PEMX | Putnam Emerging Markets Ex-China ETF | 34.20% | 29.08% | 37.59% | 0.85% | $8.32 |
| DVYE | iShares Emerging Markets Dividend ETF | 31.46% | 0.93% | 12.42% | 0.49% | $693.39 |
| RFEM | First Trust RiverFront Dyn Em Mkts ETF | 31.43% | 7.40% | 80.18% | 0.95% | $29.98 |
| EDIV | SPDR S&P Emerging Markets Dividend ETF | 31.08% | 2.30% | 36.23% | 0.49% | $504.47 |
| FMQQ | FMQQ The Next Frontier Internet ETF | 30.08% | -18.55% | -45.97% | 0.86% | $30.81 |
| FRDM | Freedom 100 Emerging Markets ETF | 29.61% | 9.61% | 61.92% | 0.49% | $903.00 |
| DIEM | Franklin Emerging Mkt Core Div TltIdxETF | 29.54% | 5.19% | 51.80% | 0.19% | $14.12 |
View & Modify in Fund Screener

Download Visual | Modify in YCharts | View Geographic Exposure in Comp Tables
Best Performing Emerging Market ETFs in the Last 3 Years
These are the best-performing Emerging Market ETFs on an annualized basis between September 30, 2021 and September 30, 2024.
| Symbol | Name | Annualized 3 Year Total Returns (As of September 30, 2024) | 3 Year Total Returns (As of September 30, 2024) | Net Expense Ratio | Assets Under Management ($M) |
|---|---|---|---|---|---|
| EDIV | SPDR S&P Emerging Markets Dividend ETF | 13.30% | 45.45% | 0.49% | $504.47 |
| DEM | WisdomTree Emerging Markets High Div ETF | 7.35% | 23.72% | 0.63% | $2,914.51 |
| RNEM | First Trust Emerging Markets Eq Sel ETF | 6.78% | 21.75% | 0.75% | $18.76 |
| EMMF | WisdomTree Emerging Markets Mltfctr | 6.50% | 20.78% | 0.48% | $36.39 |
| ROAM | Hartford Multifactor Emerging Mkts ETF | 6.42% | 20.54% | 0.44% | $31.35 |
| EELV | Invesco S&P Emerging Markets Low Vol ETF | 6.24% | 19.90% | 0.29% | $424.94 |
| UEVM | VictoryShares Emerging Mkts Val MomtETF | 6.06% | 19.31% | 0.45% | $186.64 |
| FRDM | Freedom 100 Emerging Markets ETF | 5.93% | 18.87% | 0.49% | $903.00 |
| FDEM | Fidelity Emerging Markets Mltfct ETF | 5.58% | 17.70% | 0.25% | $105.89 |
| EYLD | Cambria Emerging Shareholder Yield ETF | 5.56% | 17.64% | 0.63% | $488.75 |
View & Modify in Fund Screener

Download Visual | Modify in YCharts | View Geographic Exposure in Comp Tables
Best Performing Emerging Market ETFs in the Last 5 Years
These are the best-performing Emerging Market ETFs on an annualized basis between September 30, 2019 and September 30, 2024.
| Symbol | Name | Annualized 5 Year Total Returns (As of September 30, 2024) | 5 Year Total Returns (As of September 30, 2024) | Net Expense Ratio | Assets Under Management ($M) |
|---|---|---|---|---|---|
| EEMS | iShares MSCI Emerging Markets Sm-Cp ETF | 11.28% | 70.65% | 0.70% | $376.58 |
| EWX | SPDR S&P Emerging Markets Small Cap ETF | 10.38% | 63.89% | 0.65% | $759.64 |
| FRDM | Freedom 100 Emerging Markets ETF | 9.46% | 57.17% | 0.49% | $903.00 |
| EDIV | SPDR S&P Emerging Markets Dividend ETF | 9.24% | 55.59% | 0.49% | $504.47 |
| EYLD | Cambria Emerging Shareholder Yield ETF | 8.91% | 53.20% | 0.63% | $488.75 |
| FEMS | First Trust Emerg Mkts SC AlphaDEX ETF | 8.82% | 52.63% | 0.80% | $319.97 |
| DGS | WisdomTree Emerging Markets SmCp Div ETF | 8.51% | 50.42% | 0.58% | $2,161.47 |
| UEVM | VictoryShares Emerging Mkts Val MomtETF | 8.27% | 48.81% | 0.45% | $186.64 |
| AVEM | Avantis Emerging Markets Equity ETF | 8.16% | 48.01% | 0.33% | $7,075.47 |
| EMMF | WisdomTree Emerging Markets Mltfctr | 8.13% | 47.83% | 0.48% | $36.39 |
View & Modify in Fund Screener

Download Visual | Modify in YCharts | View Geographic Exposure in Comp Tables
Best Performing Emerging Market ETFs in the Last 10 Years
These are the best-performing Emerging Market ETFs on an annualized basis between September 30, 2014 and September 30, 2024.
| Symbol | Name | Annualized 10 Year Total Returns (As of September 30, 2024) | 10 Year Total Returns (As of September 30, 2024) | Net Expense Ratio | Assets Under Management ($M) |
|---|---|---|---|---|---|
| DGS | WisdomTree Emerging Markets SmCp Div ETF | 5.52% | 71.06% | 0.58% | $2,161.47 |
| FEMS | First Trust Emerg Mkts SC AlphaDEX ETF | 5.49% | 70.70% | 0.80% | $319.97 |
| EWX | SPDR S&P Emerging Markets Small Cap ETF | 5.48% | 70.51% | 0.65% | $759.64 |
| FNDE | Schwab Fundamental Emerging MarketsEqETF | 5.44% | 69.84% | 0.39% | $6,633.22 |
| EEMS | iShares MSCI Emerging Markets Sm-Cp ETF | 5.22% | 66.34% | 0.70% | $376.58 |
| HEEM | iShares Currency Hedged MSCI Em Mkts ETF | 4.88% | 61.09% | 0.70% | $174.56 |
| SPEM | SPDR Portfolio Emerging Markets ETF | 4.69% | 58.10% | 0.07% | $10,398.35 |
| PXH | Invesco FTSE RAFI Emerging Markets ETF | 4.59% | 56.62% | 0.49% | $1,280.06 |
| EDIV | SPDR S&P Emerging Markets Dividend ETF | 4.47% | 54.84% | 0.49% | $504.47 |
| DEM | WisdomTree Emerging Markets High Div ETF | 4.42% | 54.09% | 0.63% | $2,914.51 |
View & Modify in Fund Screener

Download Visual | Modify in YCharts | View Geographic Exposure in Comp Tables
What Was the Growth of $10,000 Over the Last 10 Years?
If you invested $10,000 10 years ago into any of the ten best-performing Emerging Market ETFs over the last 10 years, your balance today would be no less than $15K. (See the best-performing equity ETFs and Value ETFs for comparison)
The best-performing Emerging Market ETF over the past decade was the WisdomTree Emerging Markets Small Cap Div ETF (DGS). A $10,000 investment into DGS 10 years ago would be worth over $17K today. Right behind it was the First Trust Emerging Markets Small Cap AlphaDEX® ETF (FEMS) and the SPDR® S&P Emerging Markets Small Cap ETF (EWX); investing $10,000 into FEMS or EWX back in 2014 would’ve also turned into over $17K.

Download Visual | Modify in YCharts
The recent performance gap between the S&P 500 and the MSCI Emerging Market Index may signal an opportunity for a strategic or tactical rebalance in anticipation of a possible mean reversion.
Advisors and distribution teams can effectively explore and compare the performance of various Emerging Market ETFs using YCharts tools like the Fund Screener, Comp Tables, and Quickflows, simplifying the process of identifying top performers or assessing geographic exposures with ease. These functionalities underscore the utility of YCharts in facilitating informed investment decisions, particularly in a shifting economic landscape.
Whenever you’re ready, there are 3 ways YCharts can help you:
Interested in doing further ETF research with YCharts?
Email us at hello@ycharts.com or call (866) 965-7552. You’ll get a response from one of our Chicago-based team members.
Want to test out YCharts for free?
Start a no-risk 7-Day Free Trial.
3. Sign up to receive a copy of our latest research, “Which Asset Classes Perform Best As Inflation is Driven Lower.”
Disclaimer
©2024 YCharts, Inc. All Rights Reserved. YCharts, Inc. (“YCharts”) is not registered with the U.S. Securities and Exchange Commission (or with the securities regulatory authority or body of any state or any other jurisdiction) as an investment adviser, broker-dealer or in any other capacity, and does not purport to provide investment advice or make investment recommendations. This report has been generated through application of the analytical tools and data provided through ycharts.com and is intended solely to assist you or your investment or other adviser(s) in conducting investment research. You should not construe this report as an offer to buy or sell, as a solicitation of an offer to buy or sell, or as a recommendation to buy, sell, hold or trade, any security or other financial instrument. For further information regarding your use of this report, please go to: ycharts.com/about/disclosure
Next Article
An Advisor’s Guide to Elections and the MarketsRead More →
