US Nonfarm Payrolls Monthly Update | YCharts Report
The US Nonfarm Payrolls report, released monthly by the Bureau of Labor Statistics (BLS), provides critical data on the number of jobs added or lost in the economy, excluding the farming sector. This report offers insights into the labor market’s health and is a vital economic indicator that influences financial markets, monetary policy, and investment decisions.
Latest Data Release
The latest Nonfarm Payrolls report was released on October 4, 2024. Key figures from this report include:
Month-over-Month (MoM) change: +12,000
The chart below from YCharts illustrates the Nonfarm Payrolls trend over time:
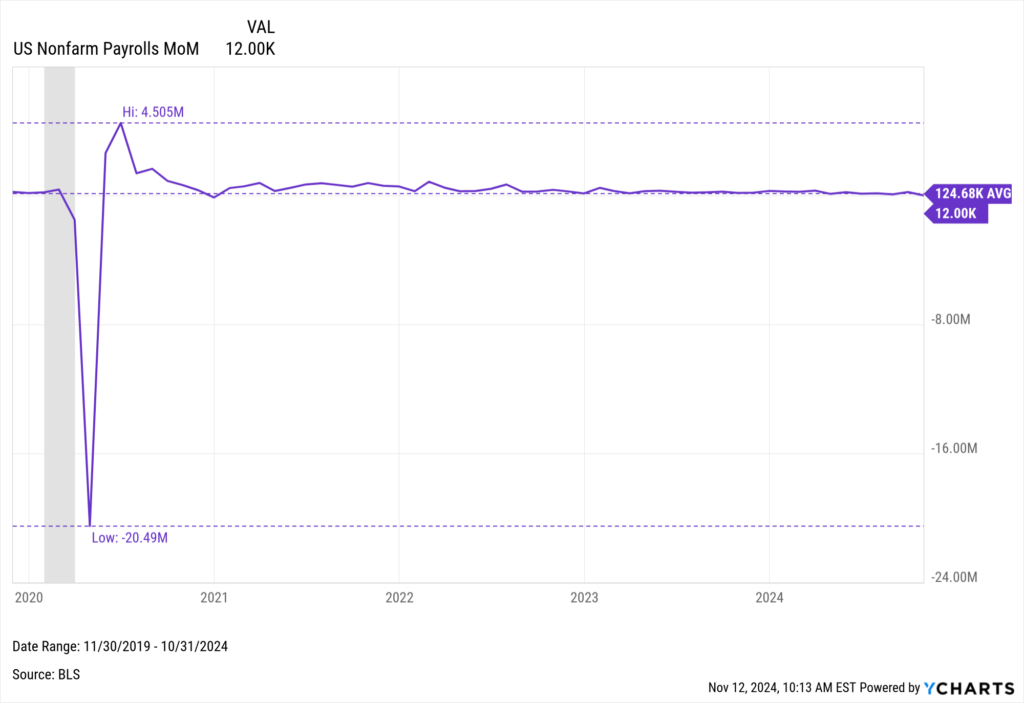
Download Visual | Modify in YCharts
Analysis and Insights
The latest Nonfarm Payrolls report indicates that job growth is below the long-term average, reflecting a slowing labor market. As of November 1, 2024, the US economy added 12,000 jobs, the smallest gain since December 2020, and a substantial decrease of 94.62% from the previous month, largely due to the impact of hurricanes Helene and Milton and a strike at Boeing (BA).
Also referred to as “Nonfarm Employment Change,” the Nonfarm Payrolls report is a vital economic indicator tracked on YCharts. It provides comprehensive insights into the health of the labor market by measuring the number of jobs added or lost in the economy, excluding the farming sector. This data is released monthly by the Bureau of Labor Statistics (BLS), offering a timely and responsive measure of economic conditions.
Economists, investors, and policymakers closely watch nonfarm payroll data because it serves as a key indicator of labor market trends. High levels of job creation suggest economic growth and stability, while declines may indicate economic distress and rising unemployment.
Key Metrics:
- Monthly Change: The absolute number of jobs added or lost each month.
- Year-over-Year Change: The percentage change compared to the same month in the previous year, providing context on how the current labor market compares to historical conditions.
- Sector Breakdown: Insight into which sectors are contributing most to job growth or decline.
Historical Nonfarm Payrolls data on YCharts dates back several decades. Users can create interactive charts to visualize trends and correlate them with other economic indicators. By examining this data, users can identify patterns, such as sustained growth or contraction periods, and correlate them with broader economic events.
Access Nonfarm Payrolls Data on YCharts:
- Log on to ycharts.com
- From anywhere on the platform, type “US Nonfarm Payrolls” into the search bar and click on the result.
- Once on the indicator page, toggle the navigation bar to browse historical data on a month-by-month basis or view data in an interactive chart.
Clicking “View Full Chart” will open data in an interactive Fundamental Chart, which can be compared against other economic indicators, such as GDP growth or unemployment rates. Recession periods can also be added to the backdrop on any chart. Additionally, users can export historical data to a CSV file for offline analysis by clicking the “Export” button.
Related Financial Indicators
YCharts’ aggregated report, US Nonfarm Payrolls, contains several additional indicators related to US Nonfarm Payrolls. Many of the indicators on YCharts are sourced directly from BSL’s reports. The indicators on YCharts’ report include:
US Labor Force Participation Rate
US Job Openings: Total Nonfarm
US Job Openings Rate: Total Nonfarm
US Average Hourly Earnings MoM
US Average Hourly Earnings YoY
US Continued Claims for Unemployment Insurance
US Initial Claims for Unemployment Insurance (click here to see how to use this indicator in YCharts)
Implications for Businesses and Investors
For Investors:
- Market Sentiment: A significant increase in Nonfarm Payrolls can signal economic strength, leading to market confidence as investors anticipate higher consumer spending and corporate earnings. Conversely, a decrease may raise concerns about an economic slowdown, affecting market stability.
- Interest Rates and Bond Yields: Rising Nonfarm Payrolls can lead to expectations of interest rate hikes as the Federal Reserve may tighten monetary policy to prevent an overheated economy, typically resulting in higher bond yields. Conversely, declining payrolls may lead to expectations of rate cuts to stimulate growth, driving bond yields lower.
- Stock Market Sectors:
- Consumer Goods and Services: Positive payroll growth can boost consumer-driven sectors as job gains increase disposable income and spending.
- Technology: May benefit from a robust economy as consumer and business spending rise, although it could face headwinds if wage pressures increase.
- Financials: Banks and financial institutions may see increased lending and reduced defaults with a strong labor market while declining payrolls can lead to higher default rates and reduced borrowing.
- Industrials: Sectors dependent on economic cycles, such as manufacturing and construction, are significantly impacted by changes in Nonfarm Payrolls.
For the Economy:
- Consumer Spending: Nonfarm Payrolls directly correlate with consumer spending. Increased job creation leads to higher disposable income, boosting spending and economic growth. Conversely, declining payrolls can reduce consumer spending and slow economic growth.
- Business Investment: Strong payroll numbers often increase business confidence, leading to higher capital expenditure and expansion plans. Declining payrolls can result in reduced business investment and caution in hiring.
- Inflation: Persistent payroll growth can tighten the labor market, potentially increasing wages and inflationary pressures. This dynamic influences Federal Reserve policies on interest rates.
For Policymakers:
- Economic Policy: An increase in Nonfarm Payrolls can reduce the need for economic stimulus measures. At the same time, a decline may prompt policymakers to implement or extend stimulus efforts, such as tax relief or infrastructure spending, to boost employment.
- Monetary Policy: The Federal Reserve closely monitors Nonfarm Payrolls to adjust monetary policies. Rising payrolls may lead to interest rate hikes to control inflation, while falling payrolls may result in rate cuts and quantitative easing to stimulate the economy.
- Fiscal Policy: High payroll growth can lead to reduced government spending on social safety nets, allowing for reallocation of funds. Conversely, declining payrolls may increase government spending on unemployment benefits and social programs, impacting budget allocations.
Impact on Business Strategies and Sectors:
- Human Resources: Companies may adjust hiring and workforce management strategies based on payroll trends. During periods of strong payroll growth, they might expand hiring and invest in workforce development. Conversely, declining payrolls may lead to hiring freezes, workforce reductions, or more flexible work arrangements.
- Consumer-Focused Businesses: Businesses in retail, hospitality, and travel may adjust their marketing and sales strategies based on payroll trends, offering promotions and discounts during periods of economic uncertainty.
- Real Estate: If payroll growth suggests a strong economy, real estate developers and investors might increase new projects or focus on higher-end developments. Conversely, they may slow down projects or focus on affordable housing options if payrolls decline.
- Tech Sector: Tech companies may invest in automation and efficiency improvements to reduce reliance on human labor, especially during periods of economic uncertainty, while also focusing on innovation and R&D.
- Financial Planning: Companies may prioritize liquidity and risk management, ensuring sufficient cash flow to weather periods of economic uncertainty and adjusting their investment strategies based on payroll trends.
- Government Contracts: Businesses reliant on government contracts may see growth opportunities if payroll data indicates robust economic conditions and increased public sector spending, particularly in infrastructure and public works.
Understanding the implications of Nonfarm Payrolls helps investors, policymakers, and businesses anticipate economic trends and adjust their strategies to navigate different economic cycles effectively.
YCharts Feature Highlights
Interactive Charts
Build a fundamental chart to visualize nonfarm payrolls over time. Users can explore the data across various time frames, compare it with other economic indicators, and overlay it with market indices, securities, and funds for a comprehensive visual comparison. Emphasize critical junctures with interactive annotations, static Min, Max, and Average annotation lines, and aesthetic modifications such as custom colors or an Area Chart.
All charts are equipped with a recession overlay feature, which provides shaded gray boxes during U.S. recessions. This feature is especially useful for showing correlations between recessions and changes in Nonfarm Payrolls during economic cycles.
Timeseries Analysis
Using Nonfarm Payrolls data in a Timeseries Analysis, you can conduct a thorough historical examination across custom frequency periods. Users can export data into CSV format for detailed analysis in YCharts’ Excel Add-in or as a standalone file.
Comp Tables
Pull Nonfarm Payrolls data into Comp Tables and additional economic indicators to compare movements over time, identify trends, and make informed investment decisions. Results can be exported to a CSV file or a printable PDF for convenient, single-page analysis.
Custom Reports
Investors and analysts can create custom reports combining Nonfarm Payrolls data with other metrics, such as GDP growth, consumer confidence, and inflation rates. These reports provide a holistic view of economic conditions and labor market trends.
Alerts and Dashboards
Set up alerts to monitor significant changes in Nonfarm Payrolls data and integrate this information into personalized dashboards for real-time analysis. This allows users to stay updated on critical shifts in the labor market and make timely decisions.
By leveraging YCharts’ comprehensive suite of tools, financial advisors can gain deep insights into Nonfarm Payrolls trends, correlating them with broader economic indicators to inform their investment strategies and economic forecasts.
Conclusion
Nonfarm Payrolls data on YCharts is a crucial indicator for gauging economic health and labor market conditions. Its implications for consumer behavior, business investment, inflation, and financial markets make it indispensable for informed decision-making. By leveraging YCharts’ analytical tools, users can gain deep insights into the trends and impacts of Nonfarm Payrolls, helping them navigate economic cycles and make strategic investment choices.
The US Nonfarm Payrolls indicator offers valuable insights into the health of the U.S. labor market.
To arm yourself with YCharts’ extensive library of economic indicators, charting software, and analysis tools, get in touch for a personalized information session or start a free trial.
Whenever you’re ready, there are 3 ways YCharts can help you:
1. Looking to better communicate the importance of economic events to clients?
Send us an email at hello@ycharts.com or call (866) 965-7552. You’ll be directly in touch with one of our Chicago-based team members.
2. Want to test out YCharts for free?
Start a no-risk 7-Day Free Trial.
3. Download a copy of the Quarterly Economic Update slide deck:
Disclaimer
©2024 YCharts, Inc. All Rights Reserved. YCharts, Inc. (“YCharts”) is not registered with the U.S. Securities and Exchange Commission (or with the securities regulatory authority or body of any state or any other jurisdiction) as an investment adviser, broker-dealer or in any other capacity, and does not purport to provide investment advice or make investment recommendations. This report has been generated through application of the analytical tools and data provided through ycharts.com and is intended solely to assist you or your investment or other adviser(s) in conducting investment research. You should not construe this report as an offer to buy or sell, as a solicitation of an offer to buy or sell, or as a recommendation to buy, sell, hold or trade, any security or other financial instrument. For further information regarding your use of this report, please go to: ycharts.com/about/disclosure
Next Article
ADP Employment Change Report: Insights and ImplicationsRead More →