Maximizing Returns Through Portfolio Optimization: A Comprehensive Guide for Financial Advisors
In today’s fast-paced and often volatile market environment, achieving the delicate balance between maximizing returns and minimizing risk is more crucial than ever. For research-oriented financial advisors, portfolio optimization is a cornerstone of effective investment strategy. This blog post delves into the intricacies of portfolio optimization, advanced techniques, and the role of YCharts in enhancing portfolio performance.
Introduction to Portfolio Optimization
The Imperative of Portfolio Optimization
In an era when market fluctuations can swiftly erode investment value, the ability to optimize portfolios becomes a critical skill for financial advisors. Portfolio optimization is not merely a theoretical exercise but a practical approach to navigating uncertain markets. By leveraging advanced optimization techniques, advisors can enhance returns and safeguard investments, providing their clients with robust, resilient portfolios.
Benefits of Advanced Optimization Techniques
Advanced portfolio optimization techniques offer significant advantages, including improved risk management, enhanced return potential, and better alignment with clients’ financial goals. These techniques enable advisors to create well-diversified portfolios that can withstand market turbulence while capitalizing on growth opportunities.
Understanding Portfolio Optimization
Defining Portfolio Optimization
Portfolio optimization is the process of selecting the best mix of assets to achieve specific investment goals, typically maximizing returns for a defined level of risk or minimizing risk for a given level of returns. It involves the application of mathematical models to balance the risk-return trade-off efficiently.
The Goal: Maximizing Returns While Minimizing Risk
At its core, portfolio optimization seeks to construct a portfolio that offers the highest possible returns for the least amount of risk. This involves diversifying investments across various asset classes, sectors, and geographies to mitigate risk and enhance potential returns.
Test Drive the Portfolio Optimizer Tool with a Free Trial
Core Principles of Portfolio Optimization
Risk-Return Trade-Off
The risk-return trade-off is a fundamental principle in investing, illustrating the correlation between the potential return of an investment and the risk taken to achieve that return. Investors must decide how much risk they are willing to accept to achieve their desired returns.
Diversification
Diversification involves spreading investments across various assets to reduce exposure to any single asset or risk. A well-diversified portfolio minimizes unsystematic risk, ensuring more stable returns over time.
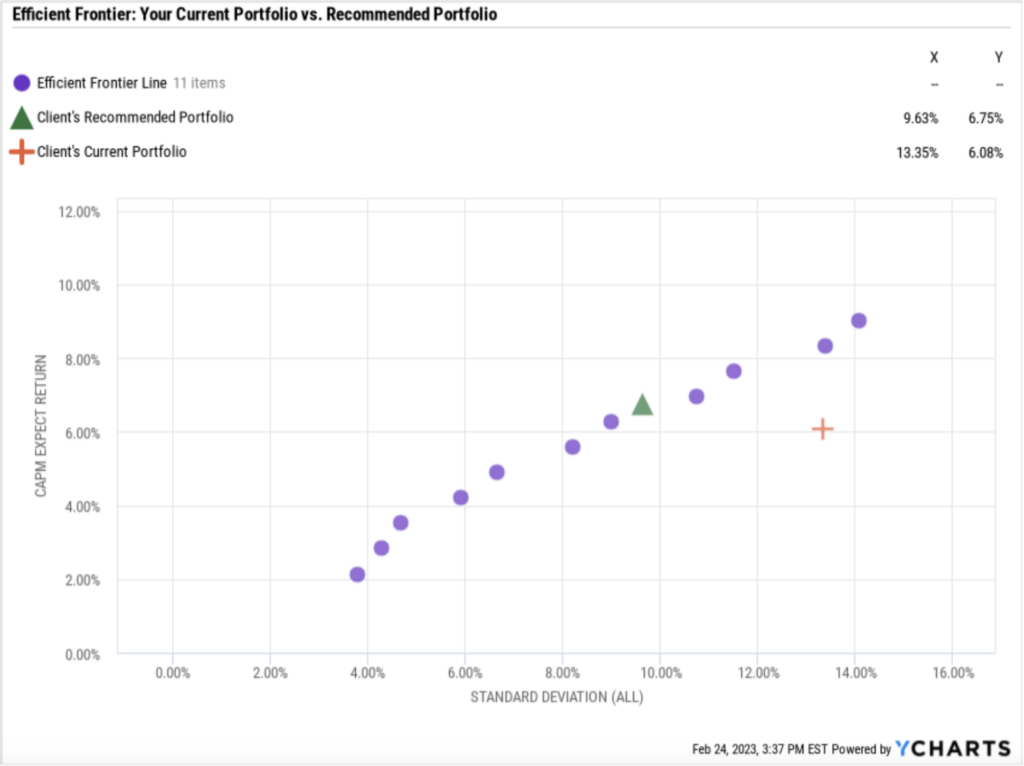
Efficient Frontier
The efficient frontier is a graphical representation of optimal portfolios that offer the highest expected return for a defined level of risk. Portfolios that lie on the efficient frontier are considered optimally diversified, maximizing returns for a given risk level.
Portfolio Optimization Techniques
1. Mean-Variance Optimization (MVO)
- Overview: Introduced by Harry Markowitz in 1952, Mean-Variance Optimization is the foundation of modern portfolio theory. It involves constructing a portfolio that offers the highest expected return for a given level of risk (or the lowest risk for a given level of return).
- Key Concepts:
- Expected Returns: The mean returns of the assets.
- Covariance Matrix: The variance and covariances between asset returns.
- Efficient Frontier: The set of optimal portfolios that offer the highest return for a given level of risk.
2. Monte Carlo Simulation
- Overview: Monte Carlo simulation uses random sampling and statistical modeling to estimate the probability distribution of portfolio returns.
- Key Concepts:
- Simulated Scenarios: Generating a large number of possible outcomes.
- Risk Assessment: Analyzing the distribution of returns to understand potential risks.
3. Capital Asset Pricing Model (CAPM)
- Overview: CAPM is used to determine an asset’s expected return based on its beta (sensitivity to market movements) and the expected market return.
- Key Concepts:
- Risk-Free Rate (Rf): The return on a risk-free asset, typically government bonds.
- Market Return (Rm): The expected return of the market.
- Beta (β): The measure of an asset’s volatility relative to the market.
4. Black-Litterman Model
- Overview: This model addresses the limitations of MVO by incorporating investor views and market equilibrium. It blends subjective views with market data to produce a more robust portfolio.
- Key Concepts:
- Market Equilibrium: Assumes that the market portfolio is efficient.
- Investor Views: Adjustments based on investor expectations.
5. Factor Models
- Overview: Factor models explain asset returns through exposure to various risk factors, such as size, value, momentum, etc. The Fama-French Three-Factor Model is a well-known example.
- Key Concepts:
- Factors: Variables that explain returns, such as market risk, company size (small vs. large), and book-to-market value (value vs. growth).
- Loadings: Sensitivities (correlations) of asset returns to these factors.
6. Robust Optimization
- Overview: This technique aims to handle uncertainty in the input parameters (such as expected returns and covariances) by optimizing for the worst-case scenario.
- Key Concepts:
- Uncertainty Sets: Bounds within which the true values of parameters lie.
- Robust Solutions: Portfolios that perform well under various possible scenarios.
7. Hierarchical Risk Parity (HRP)
- Overview: HRP is a more recent method that focuses on diversification by considering the hierarchical structure of asset returns. It aims to improve risk diversification by constructing portfolios based on clustering algorithms.
- Key Concepts:
- Hierarchical Clustering: Grouping assets based on similarities.
- Risk Parity: Allocating risk equally across different clusters.
8. Genetic Algorithms and Machine Learning
- Overview: These techniques use advanced computational algorithms to optimize portfolios. Genetic algorithms mimic the process of natural selection, while machine learning models can identify complex patterns in financial data.
- Key Concepts:
- Evolutionary Processes: Selection, crossover, and mutation for genetic algorithms.
- Training and Testing: Using historical data to train models and predict future performance.
9. Risk Budgeting
- Overview: This method allocates risk rather than capital, focusing on contributions to the total portfolio risk from individual assets or strategies.
- Key Concepts:
- Risk Contributions: The proportion of total portfolio risk attributable to each asset.
- Risk Limits: Constraints on the risk each asset can contribute.
10. Liability-Driven Investment (LDI)
- Overview: LDI strategies focus on matching the asset portfolio to future liabilities, commonly used by pension funds and insurance companies.
- Key Concepts:
- Duration Matching: Aligning the duration of assets and liabilities.
- Hedging Liabilities: Using fixed-income instruments to cover future payout obligations.
Each technique has its strengths and is suited to different types of advisors and market conditions based on client needs. Advisors often use a combination of these methods to achieve a more robust and diversified portfolio.
Leveraging YCharts for Portfolio Optimization
YCharts Tools for Portfolio Optimization
YCharts offers a suite of powerful tools designed to support advanced portfolio optimization:
- Model Portfolios: Allows advisors to create and test portfolio strategies against various market scenarios, providing insights into potential performance.
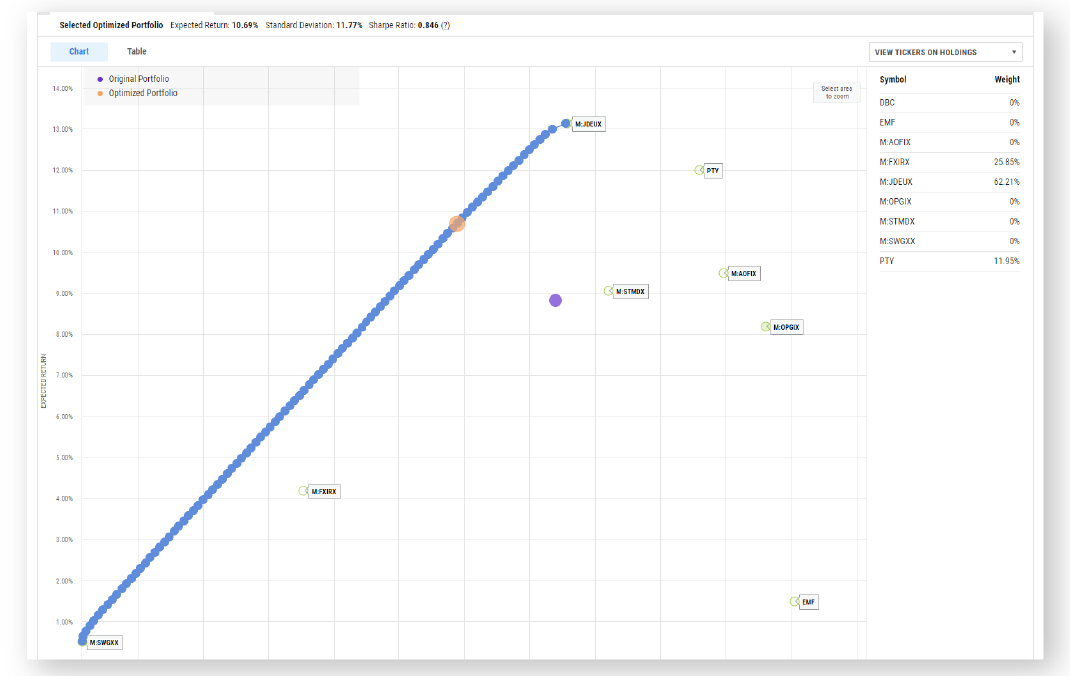
- Portfolio Optimizer: Enables the construction of optimal allocation strategies by maximizing the Sharpe Ratio, minimizing standard deviation, or achieving target returns.
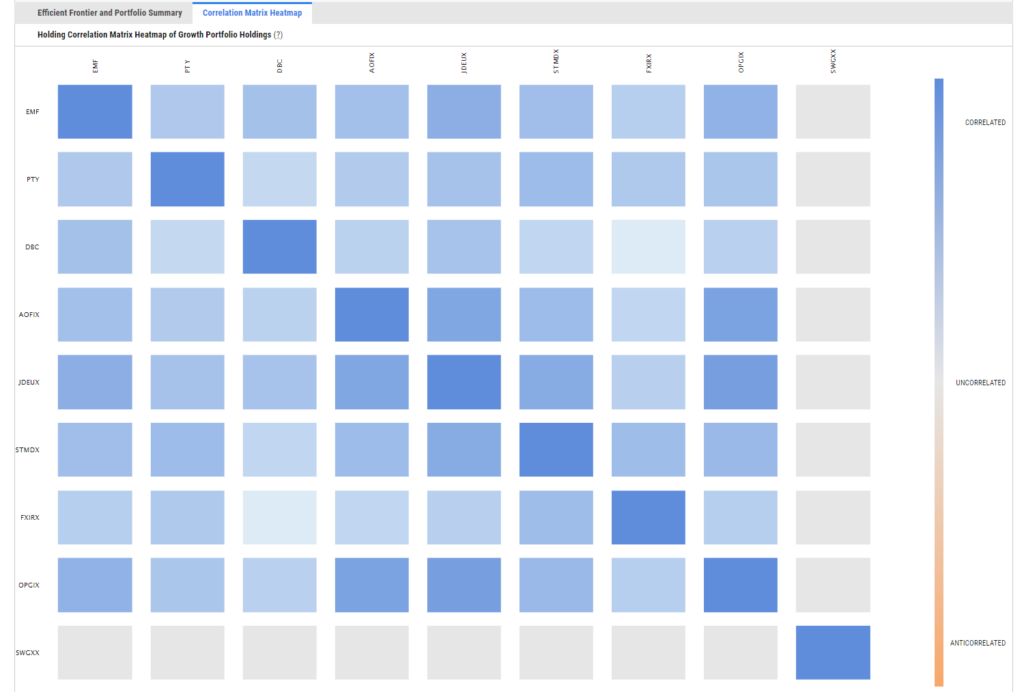
- Correlation Matrix: located within the Portfolio Optimizer, the Correlation Matrix provides insights into the interconnections between holdings to help identify potential areas of overlap or concentration. From here, advisors can make informed decisions to maintain a well-balanced and diversified portfolio, aligning with your client’s investment objectives and risk tolerance.
- Correlation Matrix: located within the Portfolio Optimizer, the Correlation Matrix provides insights into the interconnections between holdings to help identify potential areas of overlap or concentration. From here, advisors can make informed decisions to maintain a well-balanced and diversified portfolio, aligning with your client’s investment objectives and risk tolerance.
- Stock and Fund Screeners: Identifies potential investments based on specific optimization criteria, facilitating the selection of high-potential assets.
- Stress Tests: located within the Model Portfolios tab, Stress Tests illustrate the resilience of your strategies before, during, and following volatile market moments, including the Great Financial Crisis of 2008 and the Coronavirus Pandemic of 2020. Advisors can present a compelling narrative on the merits of prudent portfolio risk management that aligns with their clients’ investment goals and comfort levels.
These tools empower advisors to develop and implement sophisticated optimization strategies with ease.
Test Drive the Correlation Matrix with a Free Trial
Case Studies: Successful Portfolio Optimization with YCharts
Real-World Examples
Financial advisors and firms across the country have used YCharts to successfully optimize portfolios and achieve impressive results. Examples include:
- George Wootten, AIF®, investment analyst at Valley Wealth Group, an LPL-partnered RIA firm: George and his team develop investment models based on their clients’ risk tolerance and preferences. “YCharts’ data is not only comprehensive but pulling in data feels automatic. Any rebalancing tasks or recurring tasks are now seamless and streamlined”, George said. He’s been able to save an average of 10 hours on quarterly rebalancing efforts.
- Matt Blandford, Sr. VP & Divisional Sales Manager at John Hancock Investment Management: Matt appreciates how easy-to-use and accessible YCharts is compared with other clunky, antiquated solutions, and loves how it’s enabling collaboration across the entire team. “YCharts helps those [internal/external wholesaler] teams stay on the same page. The internals stress test the model portfolios that advisors are using and make recommendations for adjustments. When we take all that portfolio analysis that’s done internally and put it into the wholesaler’s fingertips, they’re more prepared for meetings and feel more informed.”
- Terrance (“Terry”) Agnew, AIF®, MBA, Principal and Founder of Agnew Capital Management: Terry’s day-to-day responsibilities revolve around managing and optimizing his clients’ portfolios. “I needed something to help me automate portfolio construction and import holdings from my CRM, so I could spend more time putting together new portfolio options for my clients,” says Terry. Terry leverages the YCharts Screener to identify funds that are best-suited for his clients’ portfolios, leveraging 4,000+ financial metrics to search through 75,000 funds in YCharts. “The Fund Screener has made me more efficient and helped me generate new ideas.”
These case studies highlight the practical benefits of YCharts’ advanced optimization capabilities.
Integrating Advanced Optimization Techniques into Your Practice
Step-by-Step Implementation
Implement portfolio optimization techniques using YCharts in just a few steps:
- Define Investment Objectives: Establish clear goals for the portfolio, such as target return or risk level.
- Select Appropriate Tools: Utilize YCharts’ Model Portfolios and Portfolio Optimizer to design, test, and optimize strategies.
- Backtest Strategies: Use historical data to evaluate the performance of different strategies under various market conditions using our Stress Tests.
- Optimize Allocations: Adjust asset allocations to achieve the desired balance between risk and return.
- Monitor and Adjust: Continuously monitor portfolio performance and make adjustments in response to market changes.
Continuous Optimization
Advisors should regularly review and adjust portfolios to ensure they remain aligned with client goals and market conditions. YCharts provides the tools needed for ongoing portfolio management and optimization.
Conclusion
Portfolio optimization techniques are essential for maximizing returns and managing risk in today’s volatile markets. However, it can be time-consuming work.
By leveraging the powerful tools offered by YCharts, financial advisors can simplify the workflows required to enhance their portfolio strategies, saving valuable time while continuing to achieve superior performance and better serve their clients.
Harness the power of advanced portfolio optimization with YCharts and transform your investment approach today. To test-drive Portfolio Optimization capabilities on YCharts, check out this 2-minute demonstration of the YCharts Portfolio Optimizer tool or select one of the options below:
Whenever you’re ready, there are 3 ways YCharts can help you:
1. Looking for portfolio construction and optimization capabilities in a single tool?
Send us an email at hello@ycharts.com or call (866) 965-7552. You’ll be directly in touch with one of our Chicago-based team members.
2. Want to test out YCharts for free?
Start a no-risk 7-Day Free Trial.
3. See YCharts’ Portfolio Optimization tools in action:
Schedule a personalized information session.
Disclaimer
©2024 YCharts, Inc. All Rights Reserved. YCharts, Inc. (“YCharts”) is not registered with the U.S. Securities and Exchange Commission (or with the securities regulatory authority or body of any state or any other jurisdiction) as an investment adviser, broker-dealer or in any other capacity, and does not purport to provide investment advice or make investment recommendations. This report has been generated through application of the analytical tools and data provided through ycharts.com and is intended solely to assist you or your investment or other adviser(s) in conducting investment research. You should not construe this report as an offer to buy or sell, as a solicitation of an offer to buy or sell, or as a recommendation to buy, sell, hold or trade, any security or other financial instrument. For further information regarding your use of this report, please go to: ycharts.com/about/disclosure
Next Article
The Ultimate Guide to Streamlining Your Financial Advisory PracticeRead More →