Monthly Market Wrap: April 2026

Welcome back to YCharts’ Monthly Market Wrap, your data-driven recap of market trends shaping portfolios and client conversations. In April, all major indices, both domestic and international, posted incredible results. The S&P 500 posted its best month since November 2020, advancing by 10.4% and setting new all-time highs. Oil prices remain elevated, as the Technology sector accounted for 9 of the top 10 S&P 500 stock performers in April.
Want to use these visuals in your own presentations? Download our free Monthly Market Wrap slide deck, containing all charts featured in the Market Wrap and more in a shareable, presentation-ready format.
Market Summary: Yields Rise as the Nasdaq Leads All Indices, Technology Stands Out As Winner
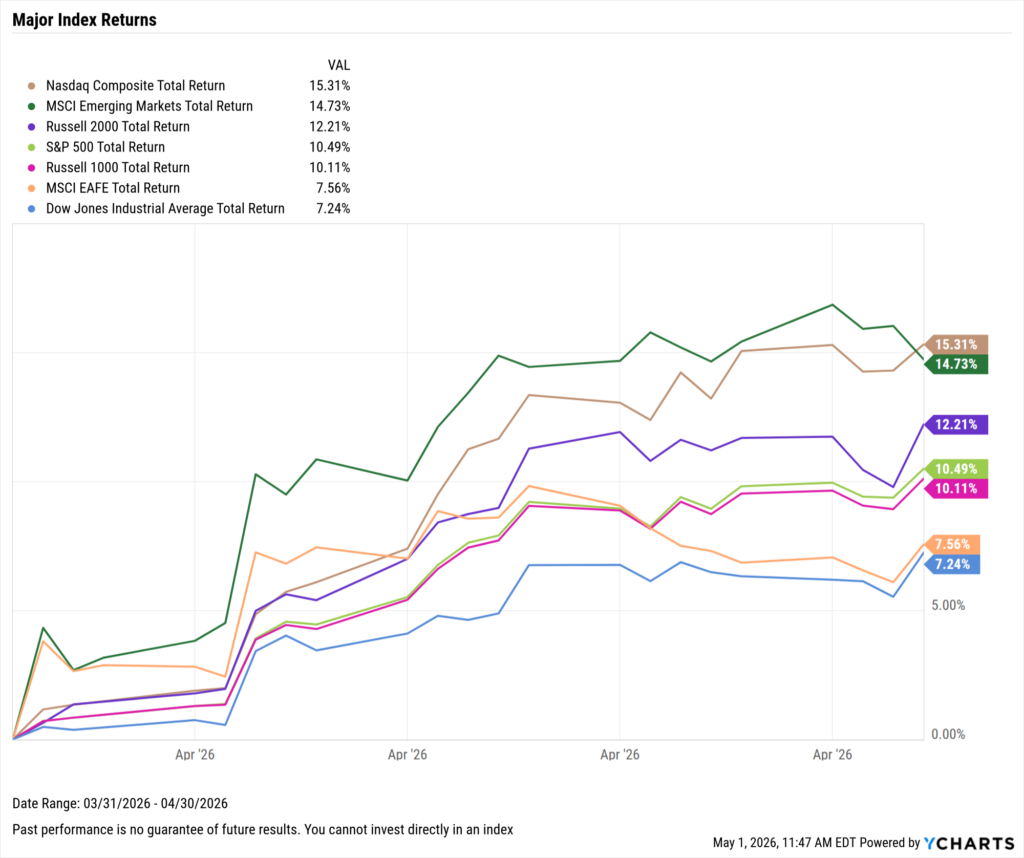
Markets rose sharply in April, with the S&P 500 rising by 10.4% and posting its best month since November 2020. The Nasdaq led the way, up 15.3% as a total of five major indices posted returns of more than 10%.
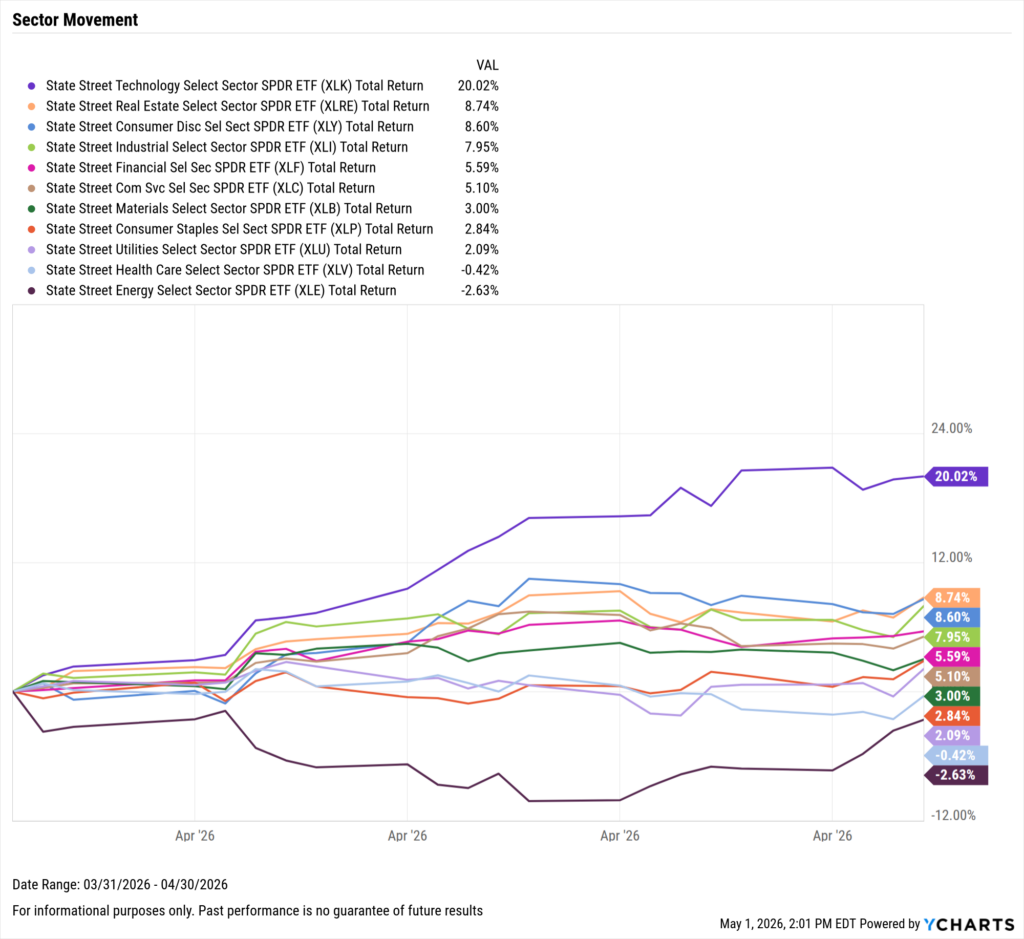
Sector performance experienced similar successes, though results were not uniform. Technology led by a wide margin, up more than 20%, followed by Real Estate in second, up 8.7%. Energy, which spiked by 10% in March, lagged in April, down 2.6% as work towards a resolution with Iran hangs in the balance.
The Federal Reserve’s next meeting is scheduled for June 17th, though expectations for any rate cut remain muted at less than 5%. Nonfarm payrolls grew by an unexpected 178,000 jobs in the same period which the unemployment rate dropped by 0.1 percentage points to 4.3%.
The Median Sales Price of Existing Homes increased to $408,800, as the US inflation rate increased by 0.90% MoM to 3.3%, its largest monthly jump since April 2021. Core inflation experienced a more modest increase of 0.10% to 2.60%.
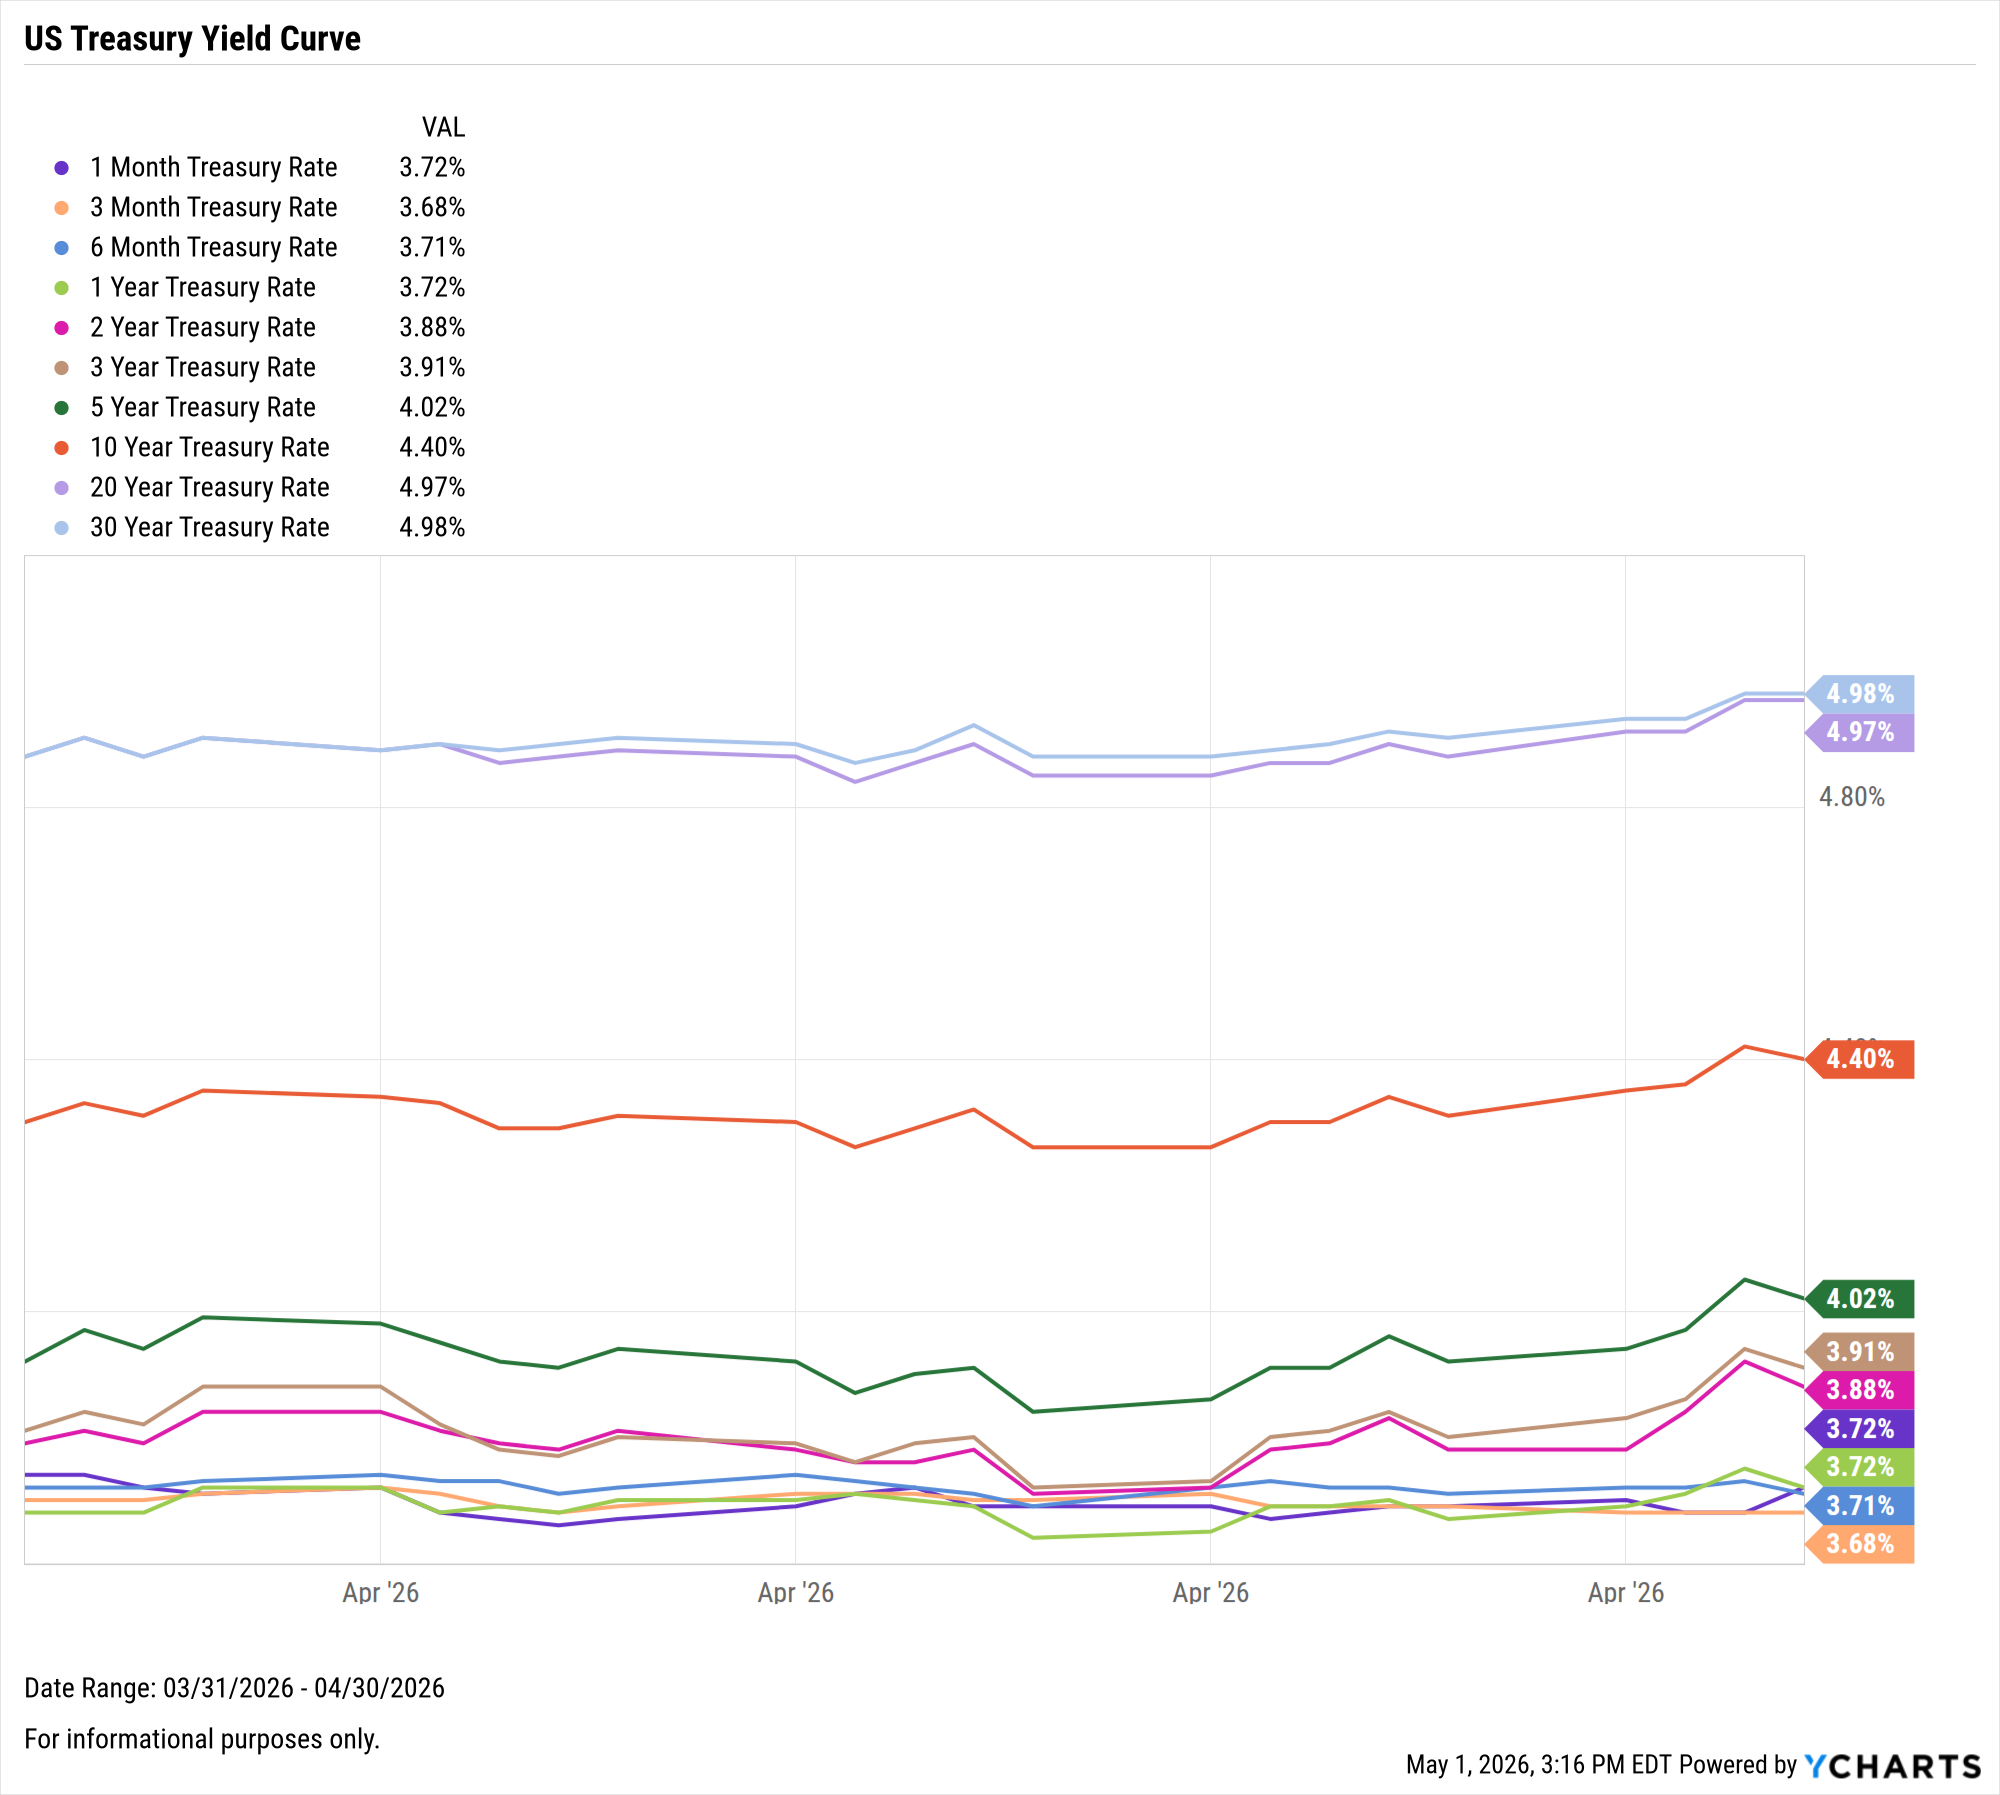
Treasury yields rose slightly in April, apart from the short end of the curve. The 3-, 5-, 10-, and 30-year all ticked up by exactly 10 basis points for the month, while the 6-month fell by a single basis point.
Jump to Fixed Income Performance
Want to create your own monthly recap, complete with these charts in a presentation deck that contains your firm’s branding? Start a Free Trial →
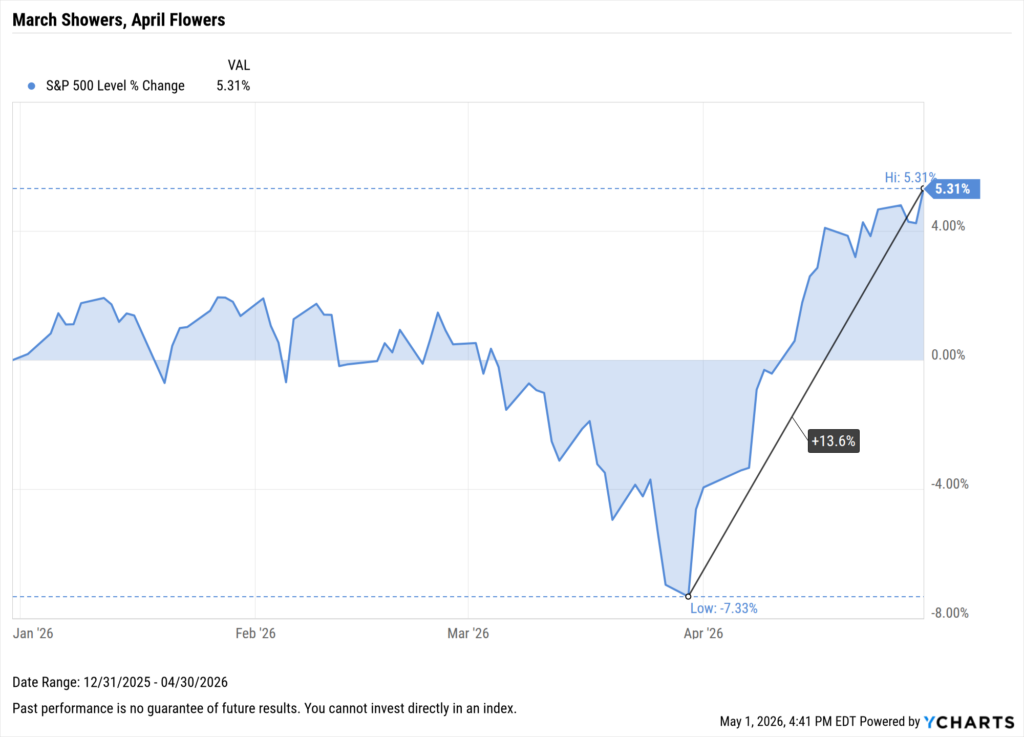
Off the YCharts! Best Month Since November 2020
The S&P 500 advanced by 10.4% in April, marking its best month since November 2020, after what was an uncomfortable first quarter of the year. The market entered the final day of Q1 down by more than 7%, and with investor sentiment at its lowest, one of the strongest runs in recent history was kick-started.
Download Visual | Modify in YCharts
March 31st began a run of seven consecutive positive closes on the S&P 500, effectively regaining the losses from the entire prior quarter, and setting the momentum that carried throughout April.
During the 21 trading days in April, the S&P was positive 15 times (71.4%), and never fell by more than 0.5% in a single day. The technology sector was the greatest beneficiary of this run, advancing by more than 20% alone, while the energy sector pulled back by nearly 3%.
The distance between March’s lows and April’s record highs was measured in weeks, an increasingly common result for markets where sentiment is driven by algorithms and instant access to information.
For clients, this is a reminder that the cost of reacting to uncertainty has consistently outweighed the discomfort of enduring it.
Equity Performance: All Major Indices Positive, Technology Surges 20% as Energy Falls Negative
Major Indices
Download Visual | Modify in YCharts | View Below Table in YCharts
| Index | 1 Month Total Returns | 3 Month Total Returns | 6 Month Total Returns | 1 Year Total Returns |
|---|---|---|---|---|
| Nasdaq Composite | 15.31% | 6.26% | 5.24% | 43.57% |
| MSCI Emerging Markets | 14.73% | 5.28% | 15.27% | 47.51% |
| Russell 2000 | 12.21% | 7.46% | 13.63% | 44.41% |
| S&P 500 | 10.49% | 4.19% | 6.03% | 31.05% |
| Russell 1000 | 10.11% | 4.07% | 5.77% | 30.42% |
| MSCI EAFE | 7.56% | 1.08% | 10.27% | 25.22% |
| Dow Jones Industrial Average | 7.24% | 1.97% | 5.26% | 24.17% |
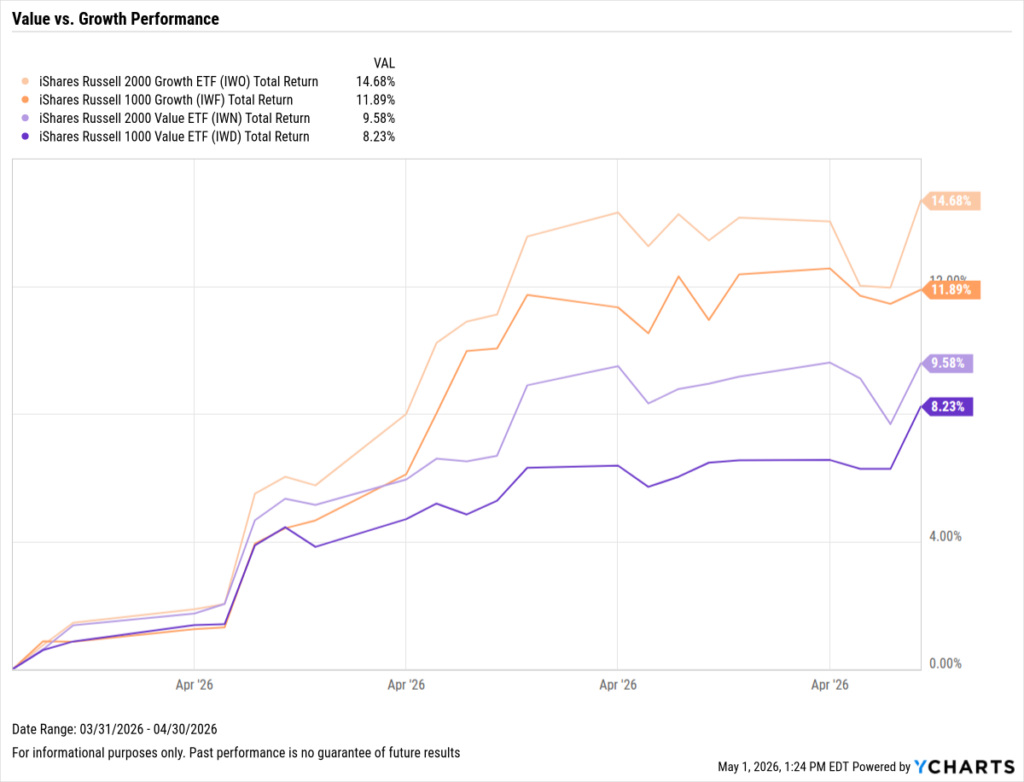
Value vs. Growth Performance
Download Visual | Modify in YCharts | View Below Table in YCharts
| Ticker | Name | 1 Month Total Returns | 3 Month Total Returns | 6 Month Total Returns | 1 Year Total Returns |
|---|---|---|---|---|---|
| IWO | iShares Russell 2000 Growth ETF | 14.68% | 7.03% | 9.10% | 42.62% |
| IWF | iShares Russell 1000 Growth | 11.89% | 2.48% | -1.56% | 30.56% |
| IWN | iShares Russell 2000 Value ETF | 9.58% | 7.45% | 18.29% | 46.03% |
| IWD | iShares Russell 1000 Value ETF | 8.23% | 5.58% | 14.02% | 29.11% |
US Sector Movement
Download Visual | Modify in YCharts | View Below Table in YCharts
| Ticker | Sector | 1 Month Total Returns | 3 Month Total Returns | 6 Month Total Returns | 1 Year Total Returns |
|---|---|---|---|---|---|
| XLK | Technology | 20.02% | 10.99% | 6.38% | 52.78% |
| XLRE | Real Estate | 8.74% | 7.88% | 10.47% | 11.21% |
| XLY | Consumer Disc | 8.60% | -2.14% | -0.96% | 20.93% |
| XLI | Industrial | 7.95% | 5.82% | 13.28% | 34.82% |
| XLF | Financial | 5.59% | -1.95% | 0.39% | 8.55% |
| XLC | Com Svc | 5.10% | -2.67% | 2.13% | 23.58% |
| XLB | Materials | 3.00% | 4.92% | 21.30% | 25.09% |
| XLP | Consumer Staples | 2.84% | 1.52% | 12.04% | 5.88% |
| XLU | Utilities | 2.09% | 9.07% | 6.68% | 22.11% |
| XLV | Health Care | -0.42% | -5.27% | 2.05% | 5.78% |
| XLE | Energy | -2.63% | 17.60% | 37.39% | 52.97% |
Hot Stocks: Top 10 S&P 500 Performers of April 2026
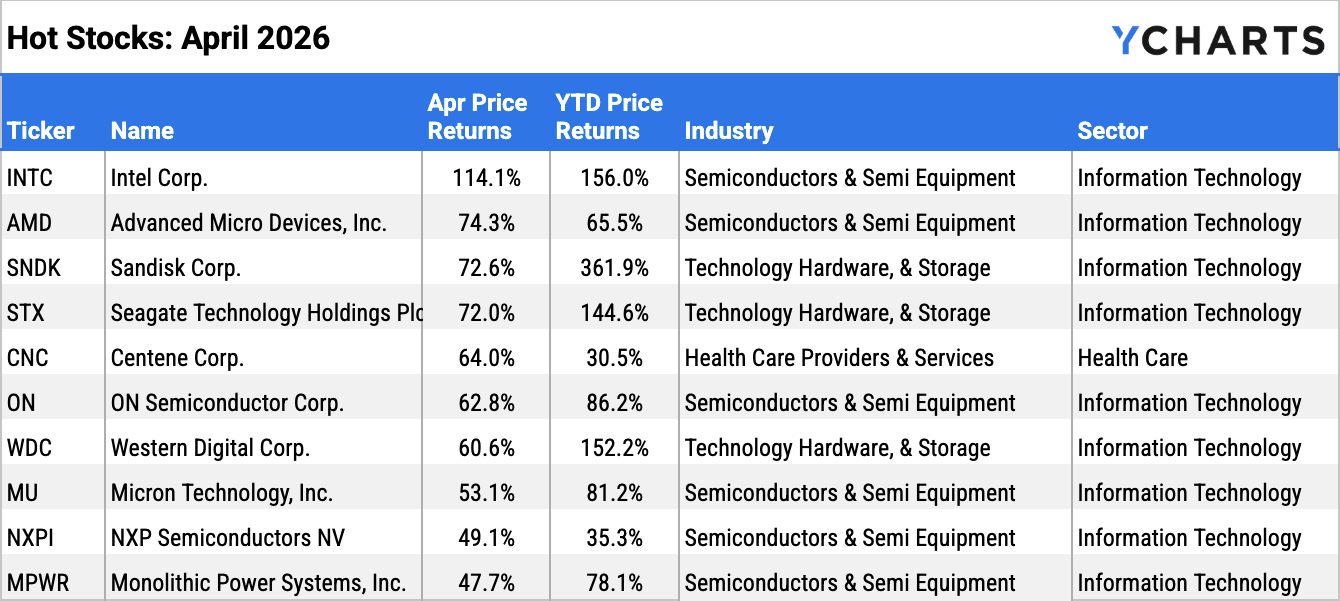
Download Visual | Modify in YCharts
| Symbol | Name | 1 Month Price Returns | YTD Price Returns | Industry | Sector |
|---|---|---|---|---|---|
| INTC | Intel Corp. | 114.1% | 156.0% | Semiconductors & Semiconductor Equipment | Information Technology |
| AMD | Advanced Micro Devices, Inc. | 74.3% | 65.5% | Semiconductors & Semiconductor Equipment | Information Technology |
| SNDK | Sandisk Corp. | 72.6% | 361.9% | Technology Hardware, Storage & Peripherals | Information Technology |
| STX | Seagate Technology Holdings Plc | 72.0% | 144.6% | Technology Hardware, Storage & Peripherals | Information Technology |
| CNC | Centene Corp. | 64.0% | 30.5% | Health Care Providers & Services | Health Care |
| ON | ON Semiconductor Corp. | 62.8% | 86.2% | Semiconductors & Semiconductor Equipment | Information Technology |
| WDC | Western Digital Corp. | 60.6% | 152.2% | Technology Hardware, Storage & Peripherals | Information Technology |
| MU | Micron Technology, Inc. | 53.1% | 81.2% | Semiconductors & Semiconductor Equipment | Information Technology |
| NXPI | NXP Semiconductors NV | 49.1% | 35.3% | Semiconductors & Semiconductor Equipment | Information Technology |
| MPWR | Monolithic Power Systems, Inc. | 47.7% | 78.1% | Semiconductors & Semiconductor Equipment | Information Technology |
Laggards & Losers: 10 Worst S&P 500 Performers of April 2026
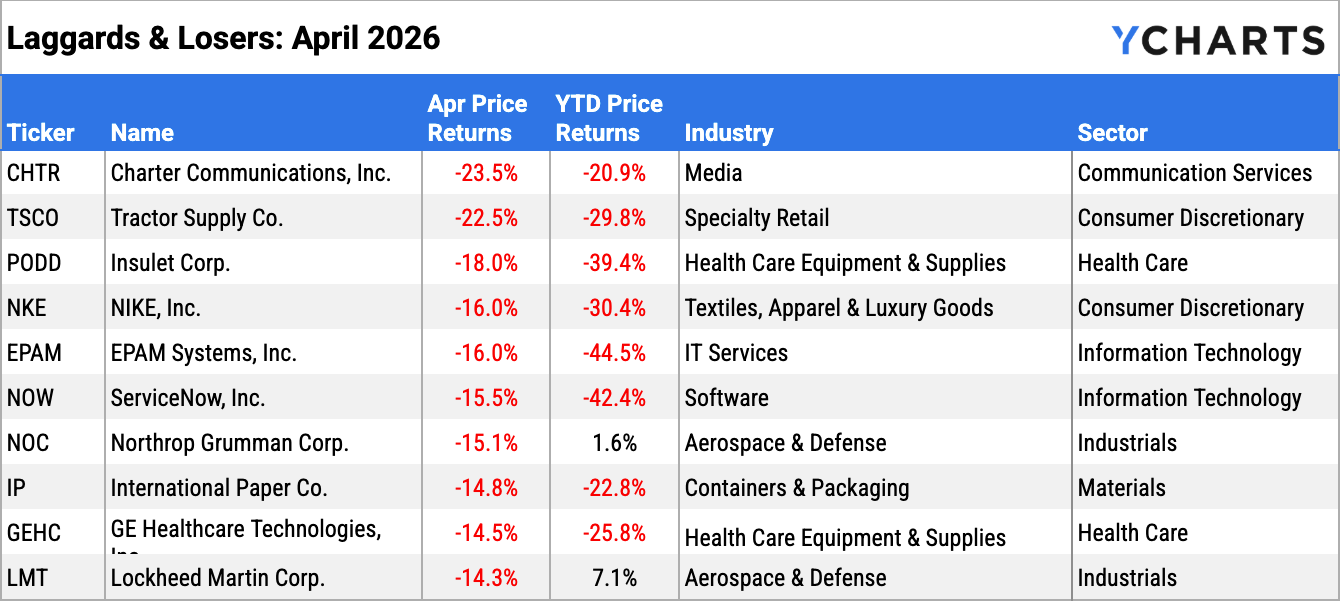
Download Visual | Modify in YCharts
| Symbol | Name | 1 Month Price Returns | YTD Price Returns | Industry | Sector |
|---|---|---|---|---|---|
| CHTR | Charter Communications, Inc. | -23.5% | -20.9% | Media | Communication Services |
| TSCO | Tractor Supply Co. | -22.5% | -29.8% | Specialty Retail | Consumer Discretionary |
| PODD | Insulet Corp. | -18.0% | -39.4% | Health Care Equipment & Supplies | Health Care |
| NKE | NIKE, Inc. | -16.0% | -30.4% | Textiles, Apparel & Luxury Goods | Consumer Discretionary |
| EPAM | EPAM Systems, Inc. | -16.0% | -44.5% | IT Services | Information Technology |
| NOW | ServiceNow, Inc. | -15.5% | -42.4% | Software | Information Technology |
| NOC | Northrop Grumman Corp. | -15.1% | 1.6% | Aerospace & Defense | Industrials |
| IP | International Paper Co. | -14.8% | -22.8% | Containers & Packaging | Materials |
| GEHC | GE Healthcare Technologies, Inc. | -14.5% | -25.8% | Health Care Equipment & Supplies | Health Care |
| LMT | Lockheed Martin Corp. | -14.3% | 7.1% | Aerospace & Defense | Industrials |
Featured Market News and YCharts Insights
What Happens After the Market’s Strongest Runs?
Why YCharts is the Best Investment Research Tool for Financial Advisors
Best Performing Mutual Funds of the Last 10 Years
When Clients Ask Why, You’ll Have an Answer with Factor Analysis in YCharts
The 10 Best Performing Stocks in the Last 25 Years
Economic Data Overview: Strong Job Additions, Inflation Worries as Oil Remains the Key
Employment
The unemployment rate fell by 0.1 percentage points to 4.3%, and the U.S. economy added 178,000 jobs according to the most recent nonfarm payrolls report, well above the Dow Jones estimate of 59,000. The US Labor Force Participation Rate decreased by 0.1 percentage points for the second straight month to 61.90%.
Consumers and Inflation
The US inflation rate increased by 0.90% MoM to 3.3%, the largest monthly jump since April 2021. Core inflation experienced a more modest increase of 0.10% to 2.60%. The CME FedWatch tool indicates less than a 5% of the first rate cut in 2026 during the FOMC’s next meeting on June 17th. Rates were held steady at 3.50-3.75% in April, during Jerome Powell’s final FOMC meeting as Fed Chair.
Production and Sales
The US ISM Manufacturing PMI went unchanged, sitting at 52.7 for the second consecutive month. The Services PMI fell by 2.1 points, though still sitting well above the expansion threshold. The YoY US Producer Price Index rose for a third month straight to 4.00%, while the US Retail and Food Services Sales also increased month-over-month.
Housing
Existing Home Sales dropped MoM by 3.63%, a fourth straight month of moves of 2.5% or greater in either direction. The Median Sales Price of Existing Homes increased by roughly $10,000 to $408,800, after two months of prices below $400,000.
Mortgage rates fell in April, ending the month at 5.64% for the 15-year and 6.30% for the 30-year. US New Single-Family Home Sales experienced its worst MoM decline in nearly 13 years, falling17.56% in January.
Commodities
Gold fell 1% in April, leaving the SPDR Gold Shares ETF (GLD) trading at $423.66 per share. Silver was hit slightly harder, down 2.1% to end the month.
Oil prices remained the standout story in April due to the conflict in Iran. Geopolitical tensions in the Middle East have strained oil supply, pushing Brent crude to $113.89 and WTI to $99.89 per barrel. Consumers are feeling this at the pump, with the US Retail Gas Price holding above $4 per gallon for the entire month of April.
Cryptocurrencies
Major cryptocurrencies pushed higher for a second consecutive month, as both Bitcoin and Ethereum advanced by more than 10%. Bitcoin rose by 13.6% to $75,774.89 per coin, and Ethereum by11.4% to $2,253.46.
Fixed Income Performance: Insights into Bond ETFs and Treasury Yields
US Treasury Yield Curve
1 Month Treasury Rate: 3.72%
3 Month Treasury Rate: 3.68%
6 Month Treasury Rate: 3.71%
1 Year Treasury Rate: 3.72%
2 Year Treasury Rate: 3.88%
3 Year Treasury Rate: 3.91%
5 Year Treasury Rate: 4.02%
10 Year Treasury Rate: 4.40%
20 Year Treasury Rate: 4.97%
30 Year Treasury Rate: 4.98%
Download Visual | Modify in YCharts
Bond Fund Performance
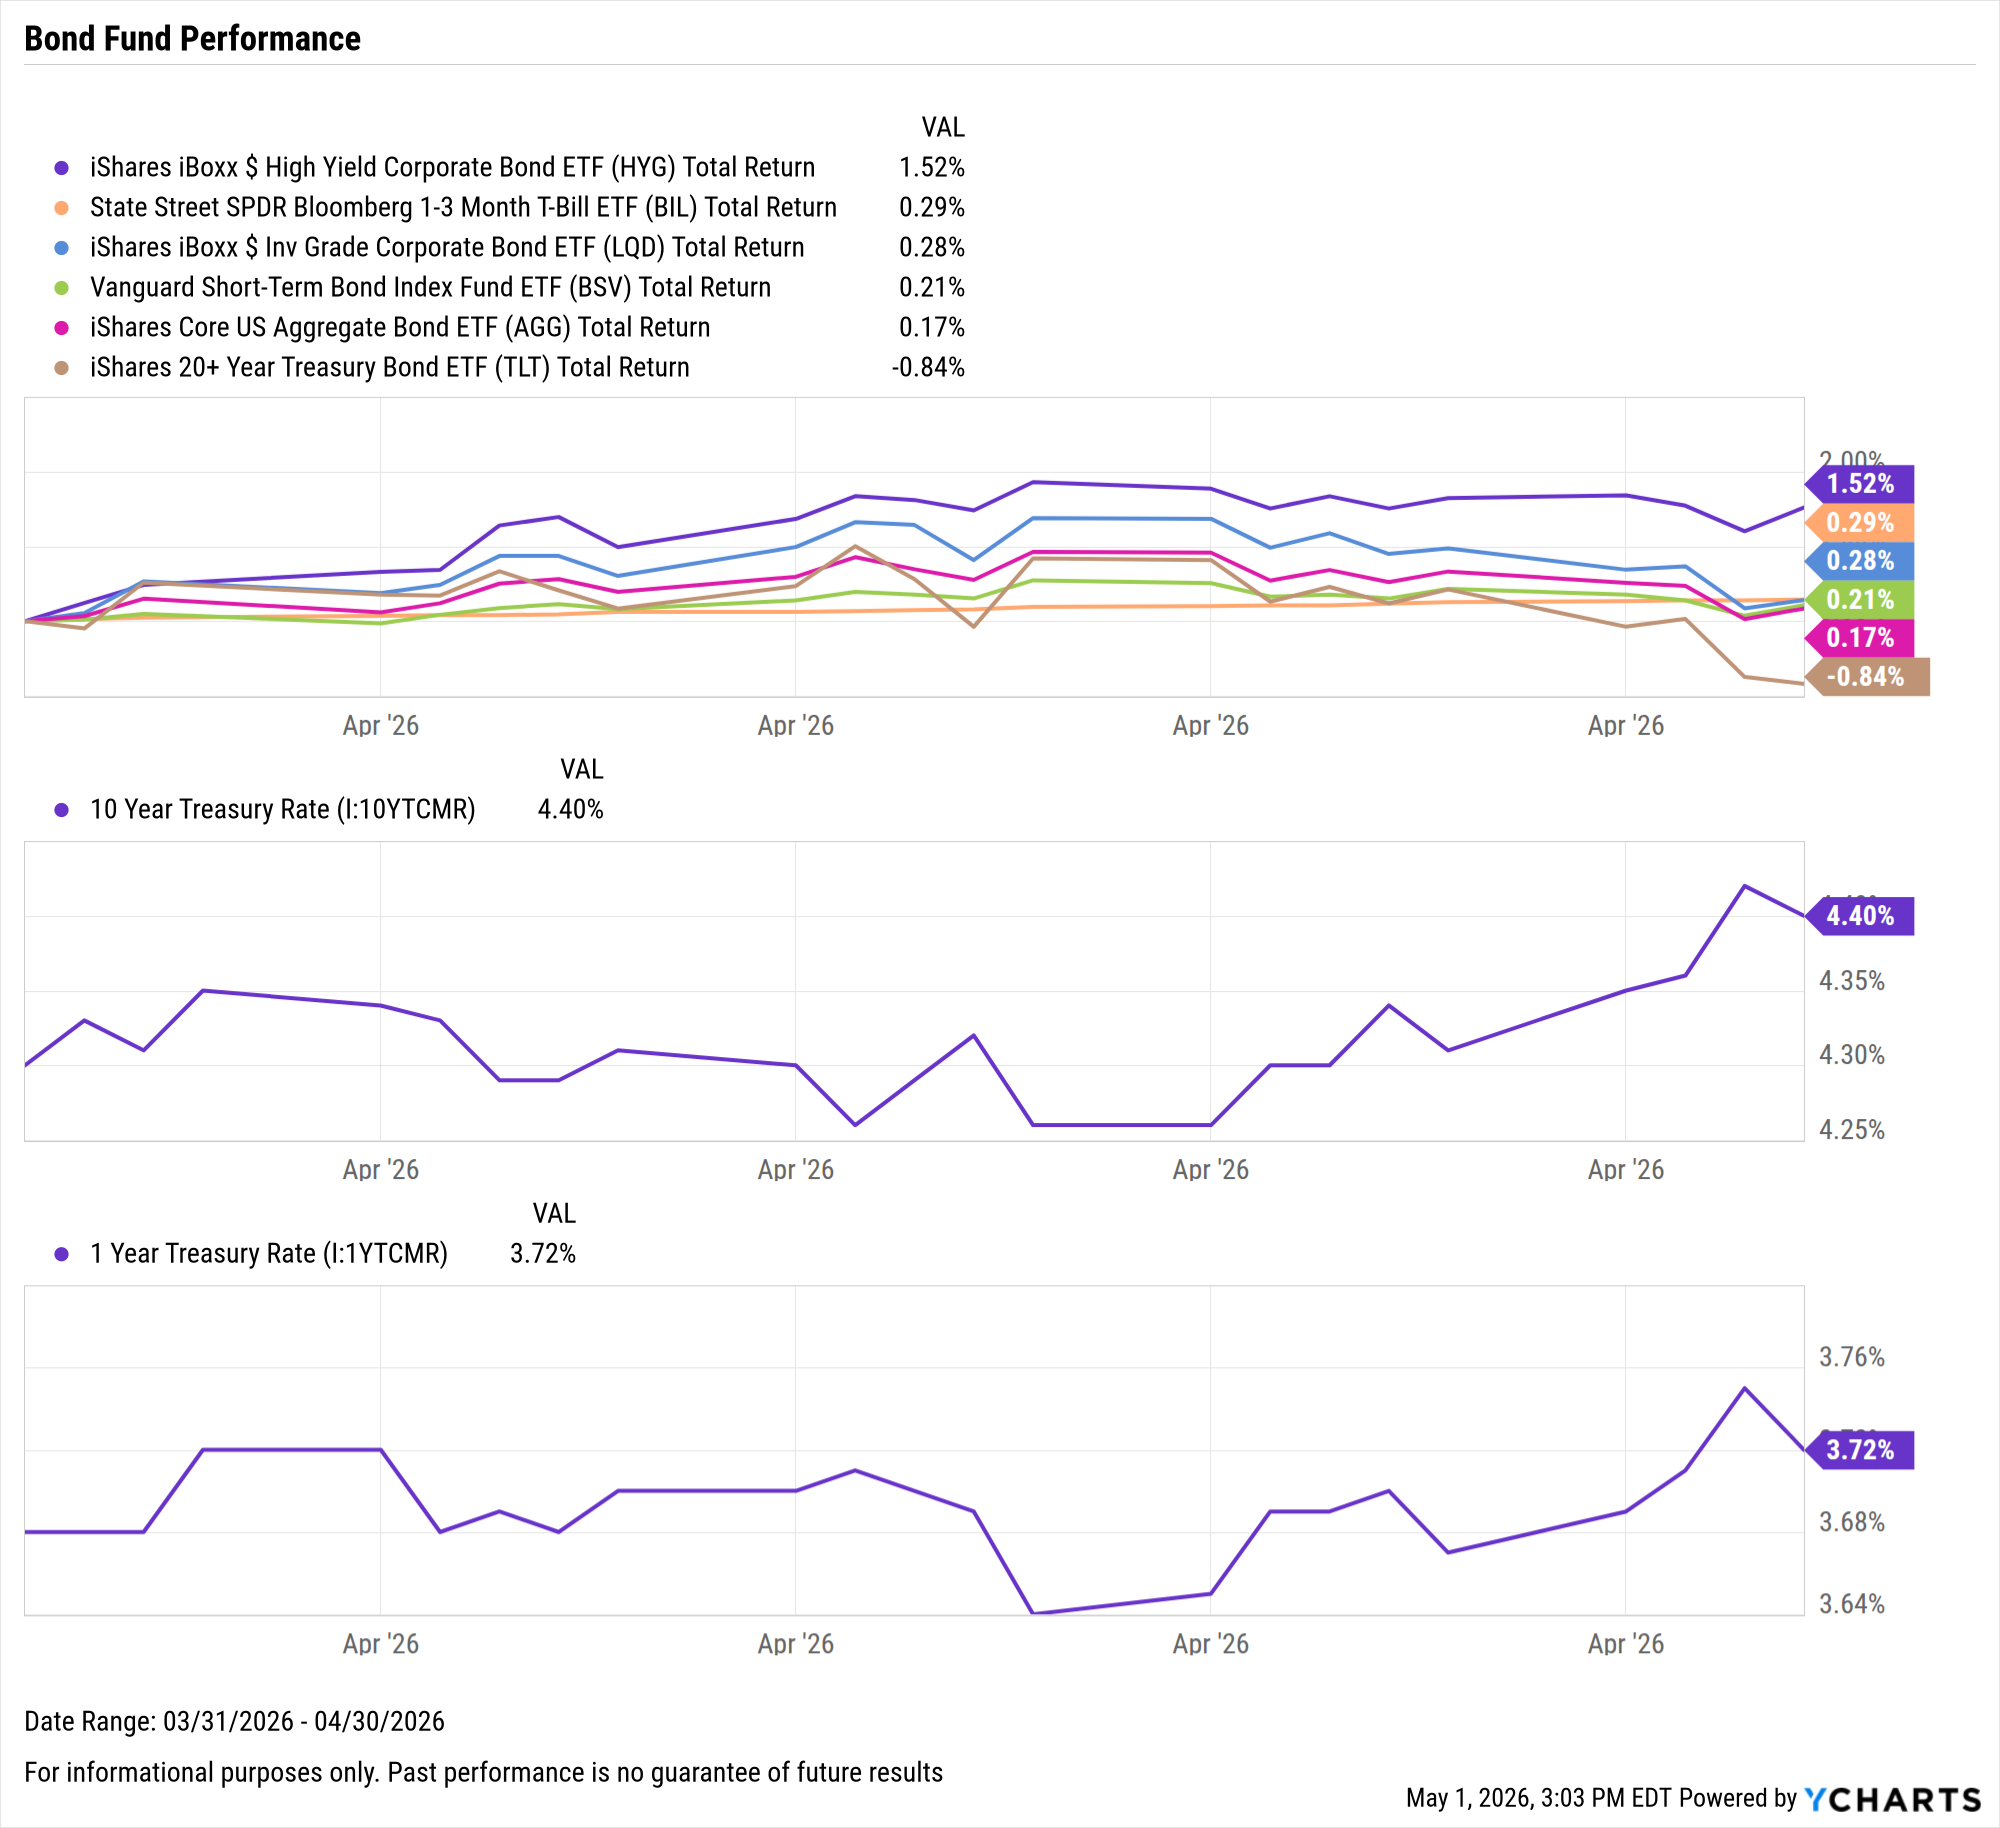
Download Visual | Modify in YCharts | View Below Table in YCharts
| Ticker | Name | 1 Month Total Returns | 3 Month Total Returns | 6 Month Total Returns | 1 Year Total Returns |
|---|---|---|---|---|---|
| HYG | iShares iBoxx $ High Yield Corporate Bond ETF | 1.52% | 0.55% | 2.42% | 8.39% |
| BIL | State Street SPDR Bloomberg 1-3 Month T-Bill ETF | 0.29% | 0.85% | 1.78% | 3.94% |
| LQD | iShares iBoxx $ Inv Grade Corporate Bond ETF | 0.28% | -0.44% | 0.09% | 5.46% |
| BSV | Vanguard Short-Term Bond Index Fund ETF | 0.21% | 0.20% | 1.16% | 3.36% |
| AGG | iShares Core US Aggregate Bond ETF | 0.17% | -0.06% | 0.52% | 4.09% |
| TLT | iShares 20+ Year Treasury Bond ETF | -0.84% | -0.63% | -3.03% | 0.05% |
Monitor the most important trends for clients as markets try to build on what was an incredible April. Download the visual aids directly from YCharts, and contact us for customized access to these charts.
Have a great May! 📈
Whenever you’re ready, there are three ways YCharts can help you:
1. Looking for a tool to help you better communicate market events?
Email us at hello@ycharts.com or call (866) 965-7552. You’ll be directly in touch with one of our Chicago-based team members.
2. Want to test out YCharts for free?
Start a no-risk 7-Day Free Trial.
3. Download a copy of the Monthly Market Wrap slide deck:
Disclaimer
©2026 YCharts, Inc. All Rights Reserved. YCharts, Inc. (“YCharts”) is not registered with the U.S. Securities and Exchange Commission (or with the securities regulatory authority or body of any state or any other jurisdiction) as an investment adviser, broker-dealer or in any other capacity, and does not purport to provide investment advice or make investment recommendations. This report has been generated through application of the analytical tools and data provided through ycharts.com and is intended solely to assist you or your investment or other adviser(s) in conducting investment research. You should not construe this report as an offer to buy or sell, as a solicitation of an offer to buy or sell, or as a recommendation to buy, sell, hold or trade, any security or other financial instrument. For further information regarding your use of this report, please go to: ycharts.com/about/disclosure
Next Article
What Happens After the Market's Strongest Runs?Read More →