Monthly Market Wrap: September 2023
Welcome back to the Monthly Market Wrap from YCharts, where we break down the most important trends for advisors and their clients in this monthly market review.
Want to use these visuals in your own presentations? Download our free Monthly Market Wrap slide deck, containing all charts featured in the Market Wrap and more in a shareable, presentation-ready format.
September 2023 Market Summary
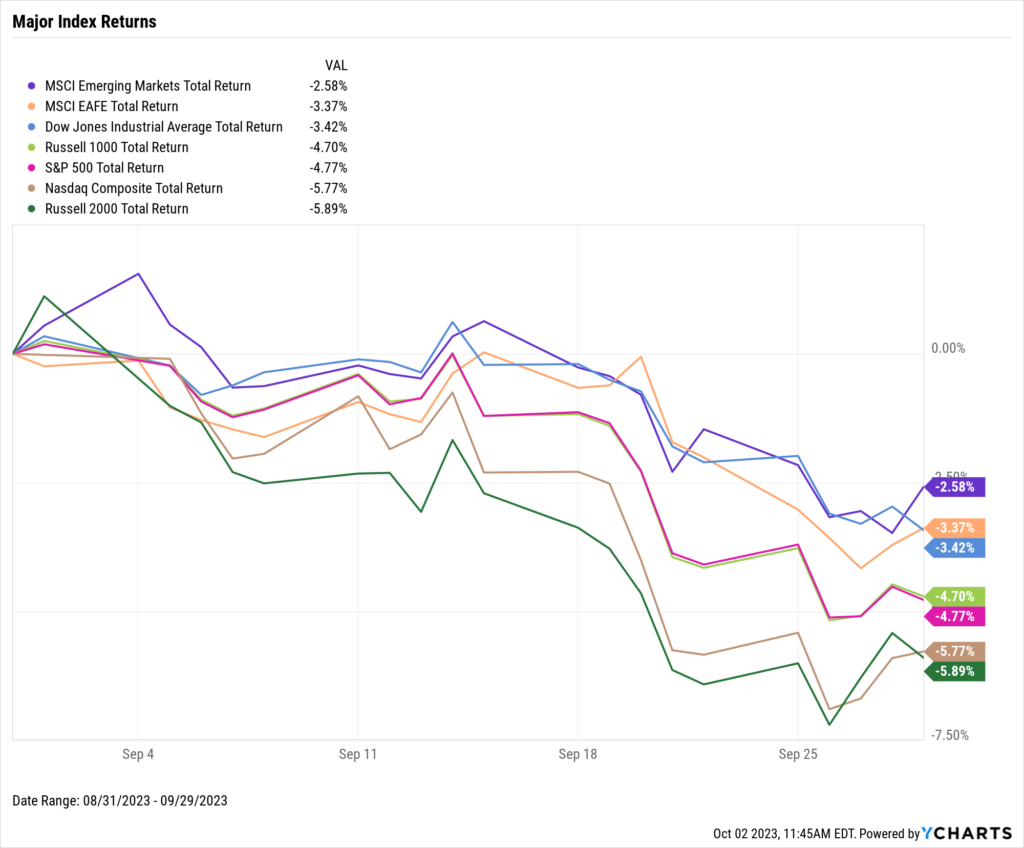
Stocks continued to decline in September as the Dow Jones Industrial Average fell 3.4%, the S&P 500 slipped 4.8%, and the NASDAQ ended 5.8% lower. Around the world, Emerging Markets were down 2.6%, and EAFE sank 3.4%. September’s declines dragged equities into the red for Q3. The Dow posted a 2.1% decline in Q3, the S&P 500 ended the quarter down 3.3%, and the NASDAQ 3.9% finished lower.
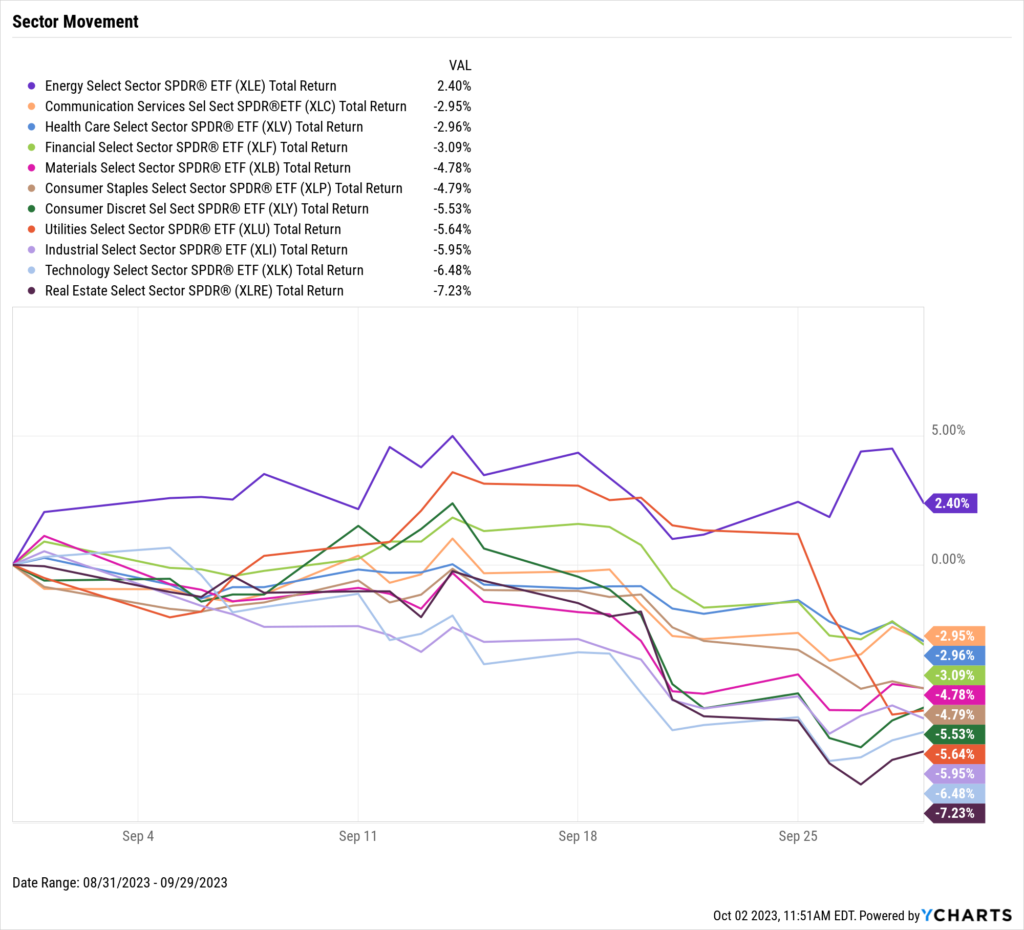
For the second straight month, Energy was the only US stock sector to post a positive return. Real Estate was the top laggard in September, tumbling 7.2%.
Regular gas prices topped $4 per gallon for the first time since October 2022. The higher gas prices resulted from a surge in crude oil prices. WTI crude oil briefly reached $90 per barrel in September–the first time since November 2022–while the price of Brent surged 7.7% to $94.01. Mortgage rates reached 20-year highs last month and pushed even higher in September. The 30-year mortgage rate surpassed 7% for the first time since April 2002.
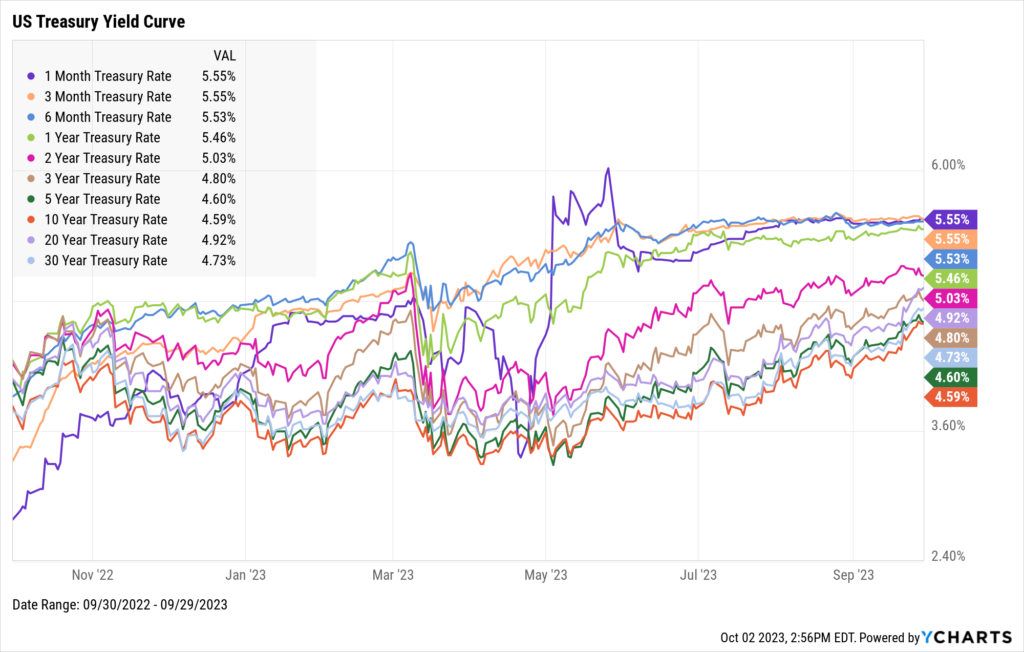
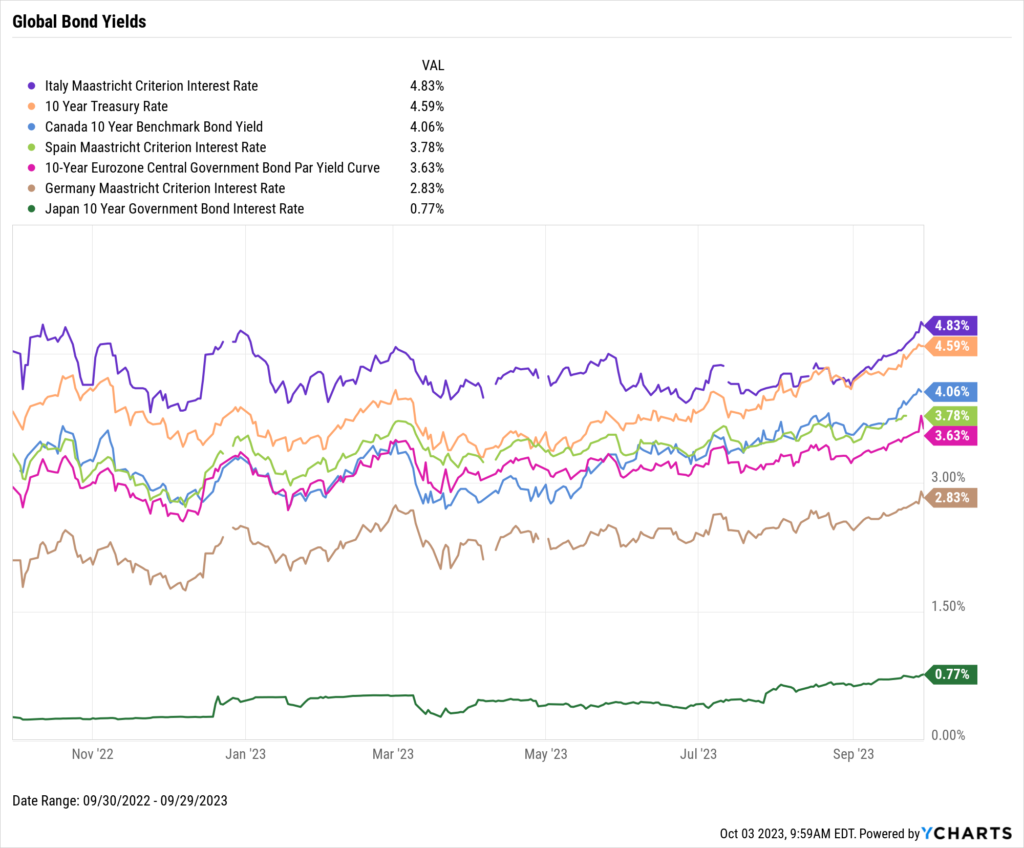
Yields on longer-term treasuries increased in September as T-Bills ended the month broadly unchanged. The 20-year and 30-year bonds each rose by 53 basis points. The 10-year’s 50 basis point increase helped reduce the inverted 10-2 treasury yield spread to -0.44%. Yields on global fixed-income instruments rose as well. Italy’s Long-Term Interest Rate surged 74 basis points, Canada’s 10-Year Benchmark Bond Yield jumped by 53 basis points, and Japan’s 10 Year Government Bond now yields 0.77%, an increase of 11 basis points.
Jump to Fixed Income Performance
Want to create your own monthly recap, complete with these charts in a presentation deck that contains your firm’s branding? Start a Free Trial →
Off the YCharts! Dollar-Cost Averaging NVIDIA
NVIDIA (NVDA) is the best-performing stock YTD in the S&P 500 and NASDAQ. The chipmaker giant is also the second-best performer across the Russell 1000 in 2023.
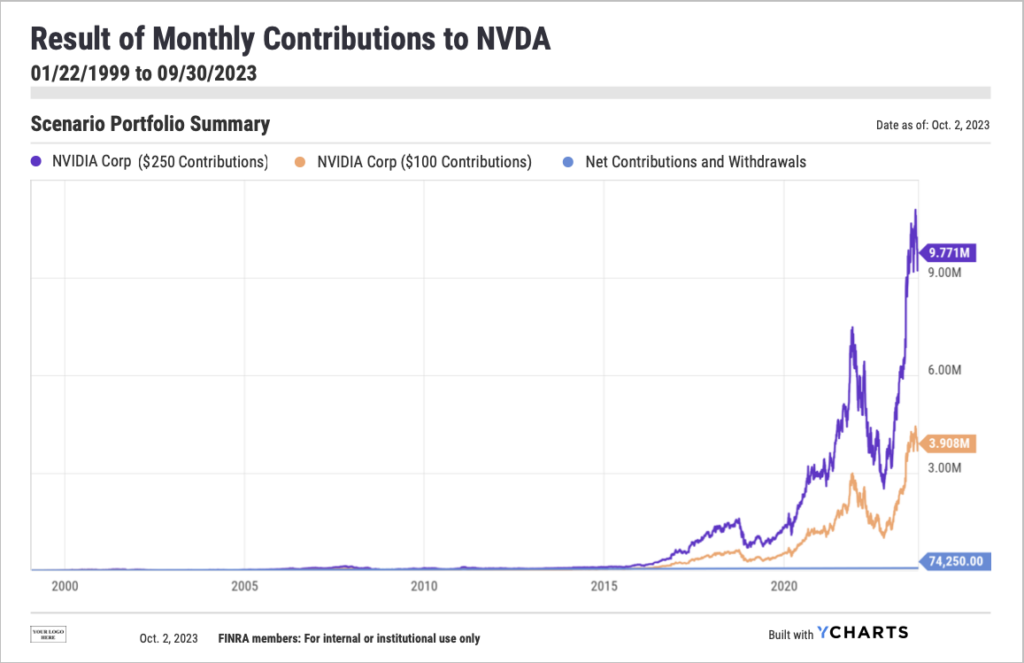
Last month, we highlighted the growth of a $10,000 investment into NVIDIA from its IPO through August 2023. What would have happened if you used dollar-cost averaging instead?
If you contributed $100 monthly to NVIDIA since its IPO, your balance would be a little over $3.9 million on a total contribution of $29,700. That balance would be close to $10 million if the monthly contribution increased to $250 ($74,250 total).
Though lump-sum investing in NVIDIA at its IPO would have generated a greater overall return, simply adopting the “set-it-and-forget-it” method of monthly dollar-cost averaging still produced a notable result while eliminating the worry about timing the market.
Download Visual | Create Your Own Scenarios
Equity Performance
Major Indexes
Download Visual | Modify in YCharts | View Below Table in YCharts
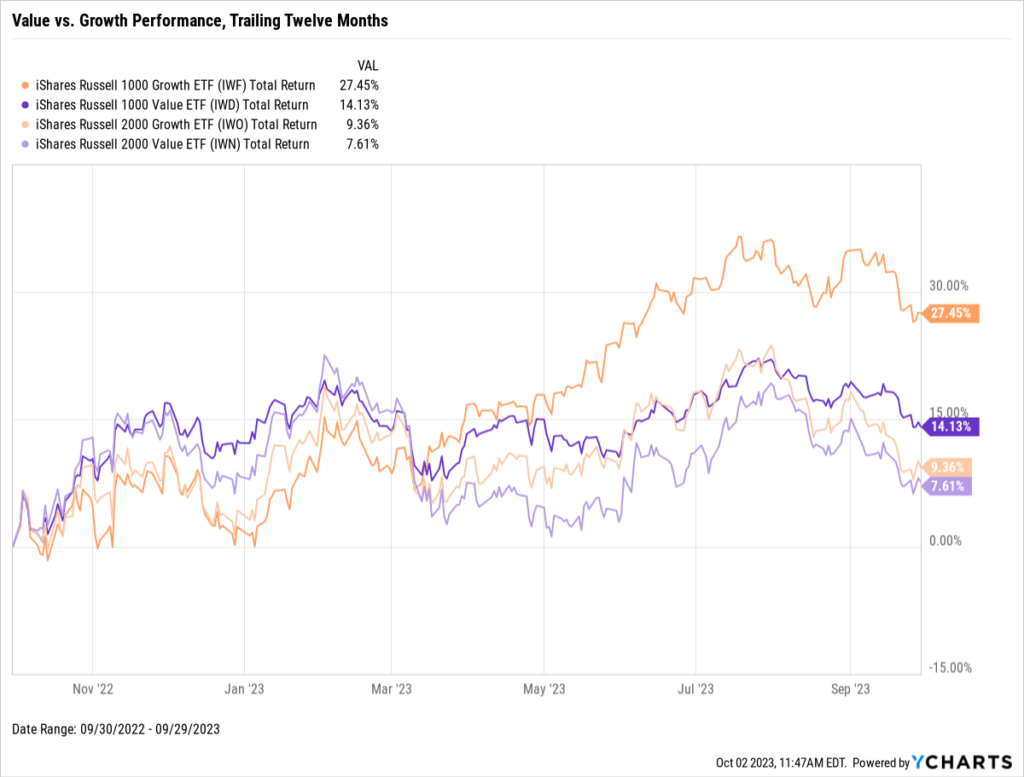
Value vs. Growth Performance, Trailing Twelve Months
Download Visual | Modify in YCharts | View in Comp Tables
US Sector Movement
Download Visual | Modify in YCharts | View Below Table in YCharts
Hot Stocks: Top 10 S&P 500 Performers of September 2023
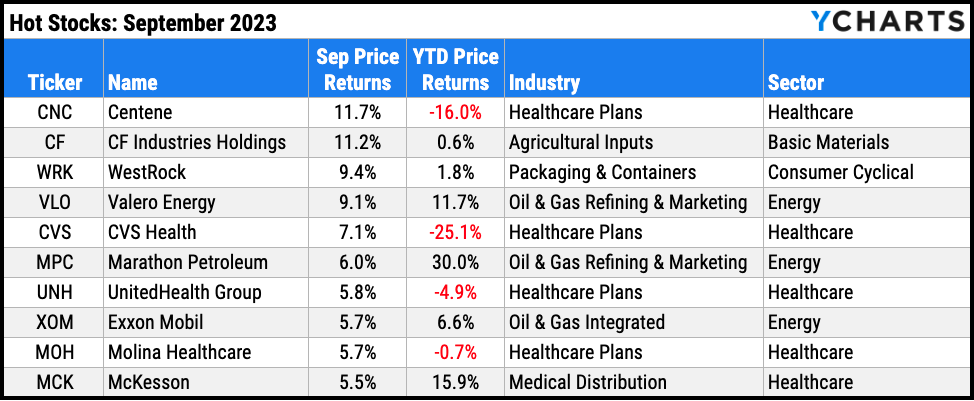
Download Visual | Modify in YCharts
Laggards & Losers: 10 Worst S&P 500 Performers of September 2023
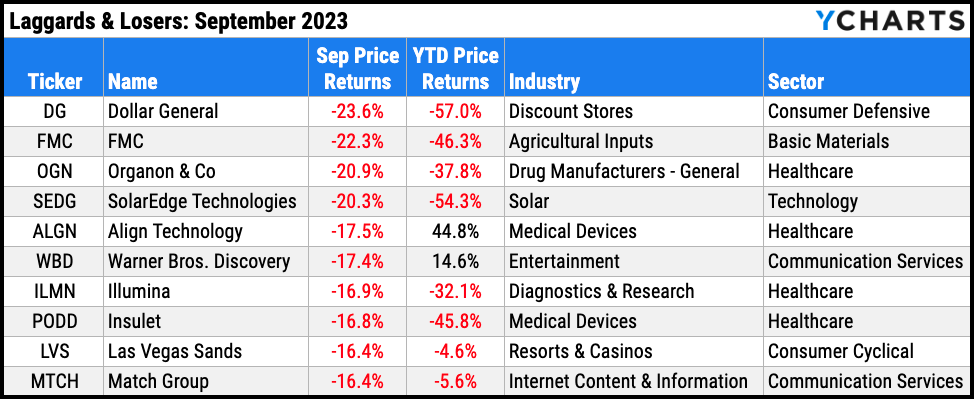
Download Visual | Modify in YCharts
Featured Market & Advisor News
Treasury Bills Yielding 5% Are a Big Hit With Retail Investors (FA-Mag)
The 10 Best Performing Stocks in the Last 25 Years (YCharts)
Advisors finally being forced to reckon with client cash (InvestmentNews)
What Happens After A Fed Rate Hike? (Or Pause)? (YCharts)
Gas, Interest Take Most Out Of American Incomes Since 2014 (WealthManagement.com)
NEW on YCharts: Proposals & Talking Points (YCharts)
Economic Data
Employment
August’s unemployment rate rose to 3.8%, three-tenths higher than July’s figure of 3.5%. However, the labor force participation rate grew by two-tenths to 62.8%. August nonfarm payroll data showed 187,000 jobs added, surpassing expectations of 170,000.
Consumers and Inflation
YoY inflation rose for a second straight month, from 3.18% in July to 3.67% in August. Conversely, Core Inflation fell to 4.35% in August, marking the fifth consecutive monthly decline. The US Consumer Price Index logged a monthly increase of 0.63% in August, its most prominent in the last 14 months. US Personal Spending was up 0.45% MoM. The Federal Reserve kept the benchmark Target Federal Funds Rate unchanged at 5.50% during its recent September 20th meeting.
Production and Sales
The US ISM Manufacturing PMI increased by 1.4 points in September to 49.0. This is the third consecutive monthly increase as the key manufacturing index approaches 50, the dividing line between expansion and contraction. US Retail and Food Services Sales grew by 0.56% MoM in August, and the YoY US Producer Price Index jumped to 1.6%.
Housing
US New Single-Family Home Sales contracted 8.7% in August, following a July in which new home sales grew by 8.0%. US Existing Home Sales sank for the third consecutive month, down 0.7%, and 17th out of the last 19. The Median Sales Price of Existing Homes inched 0.3% higher to $407,100, staying above $400,000 for the third straight month. Mortgage rates pushed higher in September; 15-year and 30-year Mortgage Rates ended the month at 6.72% and 7.31%, respectively.
Commodities
The price of Gold fell 3.7% in September, from $1,942.30 down to $1,870.50. WTI oil per barrel briefly reached $90 in September, ending the month at $89.68, an increase of 7.3%. Brent rose 7.7% in September to $94.01 per barrel. As a result, the average price of regular gas also eclipsed $4.00 per gallon in mid-September, settling at $3.96 as of September 25th.
Cryptocurrencies
The prices of Bitcoin and Ethereum ended September down slightly MoM. Bitcoin slipped 1.4% to $26,917.20, and Ethereum fell 2.2% to $1,667.99. Crypto assets gave back some of their year-long gains in Q3; Bitcoin ended Q3 down 11.7% and Ethereum 10% lower. Bitcoin is up 61.7% yearly, and Ethereum is 38.8% higher.
Fixed Income
US Treasury Yield Curve
1 Month Treasury Rate: 5.55%
3 Month Treasury Rate: 5.55%
6 Month Treasury Rate: 5.53%
1 Year Treasury Rate: 5.46%
2 Year Treasury Rate: 5.03%
3 Year Treasury Rate: 4.80%
5 Year Treasury Rate: 4.60%
10 Year Treasury Rate: 4.59%
20 Year Treasury Rate: 4.92%
30 Year Treasury Rate: 4.73%
Download Visual | Modify in YCharts
Global Bonds
Italy Long Term Bond Interest Rate: 4.83%
10 Year Treasury Rate: 4.59%
Canada 10 Year Benchmark Bond Yield: 4.06%
Spain Long Term Bond Interest Rate: 3.78%
10-Year Eurozone Central Government Bond Par Yield: 3.63%
Germany Long Term Bond Interest Rate: 2.83%
Japan 10 Year Government Bond Interest Rate: 0.77%
Download Visual | Modify in YCharts
Have a great October! 📈
Whenever you’re ready, there are 3 ways YCharts can help you:
1. Looking for a communication tool to show the impact of monthly market events?
Send us an email at hello@ycharts.com or call (866) 965-7552. You’ll be directly in touch with one of our Chicago-based team members.
2. Want to test out YCharts for free?
Start a no-risk 7-Day Free Trial.
3. Download a copy of the Monthly Market Wrap slide deck:
Disclaimer
©2023 YCharts, Inc. All Rights Reserved. YCharts, Inc. (“YCharts”) is not registered with the U.S. Securities and Exchange Commission (or with the securities regulatory authority or body of any state or any other jurisdiction) as an investment adviser, broker-dealer or in any other capacity, and does not purport to provide investment advice or make investment recommendations. This report has been generated through application of the analytical tools and data provided through ycharts.com and is intended solely to assist you or your investment or other adviser(s) in conducting investment research. You should not construe this report as an offer to buy or sell, as a solicitation of an offer to buy or sell, or as a recommendation to buy, sell, hold or trade, any security or other financial instrument. For further information regarding your use of this report, please go to: ycharts.com/about/disclosure
Next Article
A Wholesaler’s Guide to Minimize Distributions & Maximize AUMRead More →