The Ultimate Guide to Streamlining Your Financial Advisory Practice

In the dynamic world of financial advisory services, efficiency and effectiveness are paramount. Financial advisors face a myriad of tasks daily, from managing client portfolios to ensuring compliance with regulatory requirements.
Streamlining these operations can enhance client satisfaction, improve operational productivity, and, ultimately, business growth. This blog post explores the concept of streamlining financial advisory practices and highlights how YCharts can play a pivotal role in this transformation.
Challenges in Financial Advisory Services
Common Efficiency Roadblocks
Financial advisors often encounter several challenges that hinder efficiency. These include:
- Time Management: Juggling multiple tasks, such as client meetings, portfolio reviews, and administrative work, can be overwhelming. Advisors frequently find themselves stretched thin, which can lead to errors and reduced quality of service.
- Data Management: The financial industry generates vast amounts of data daily. Without the right tools, managing this data, ensuring its accuracy, and extracting meaningful insights can be daunting.
- Regulatory Compliance: Staying compliant with ever-evolving regulations requires constant vigilance and extensive documentation. This can be time-consuming and diverts attention from client-focused activities.
Impact of Inefficiencies
Inefficiencies in these areas can have far-reaching impacts:
- Client Relationships: Delays and errors can erode client trust and satisfaction. Clients expect timely, accurate, and insightful advice; any shortfall in these areas can damage relationships.
- Service Quality: The quality of service diminishes when advisors are bogged down by administrative tasks. This can lead to missed opportunities and suboptimal investment strategies.
- Business Growth: Inefficiencies hinder growth by consuming resources that could be better spent on expanding the client base and improving services.
YCharts Solutions for Streamlining Practices
Comprehensive YCharts Tools
YCharts offers a suite of tools designed to streamline financial advisory practices for analytical sales users:
Screeners allow advisors to quickly filter and identify securities based on specific criteria. This saves time and helps them make informed investment decisions. For example, DJ Hunt at Amarillo National Bank uses YCharts’ Screeners and the Excel Add-in to automate and improve their modeling process, reducing the time spent on manual data entry from an entire day to just a few minutes.
Watch how the Excel Add-in automates data processing in the short demo below.
The Dashboard is a centralized hub where advisors can monitor market trends, portfolio performance, and economic indicators. Its customizable nature ensures that advisors can tailor it to their specific needs, enhancing overall efficiency and client satisfaction. For instance, Ben Peters at Burton Enright Welch uses the Dashboard to quickly monitor their portfolios’ performance.
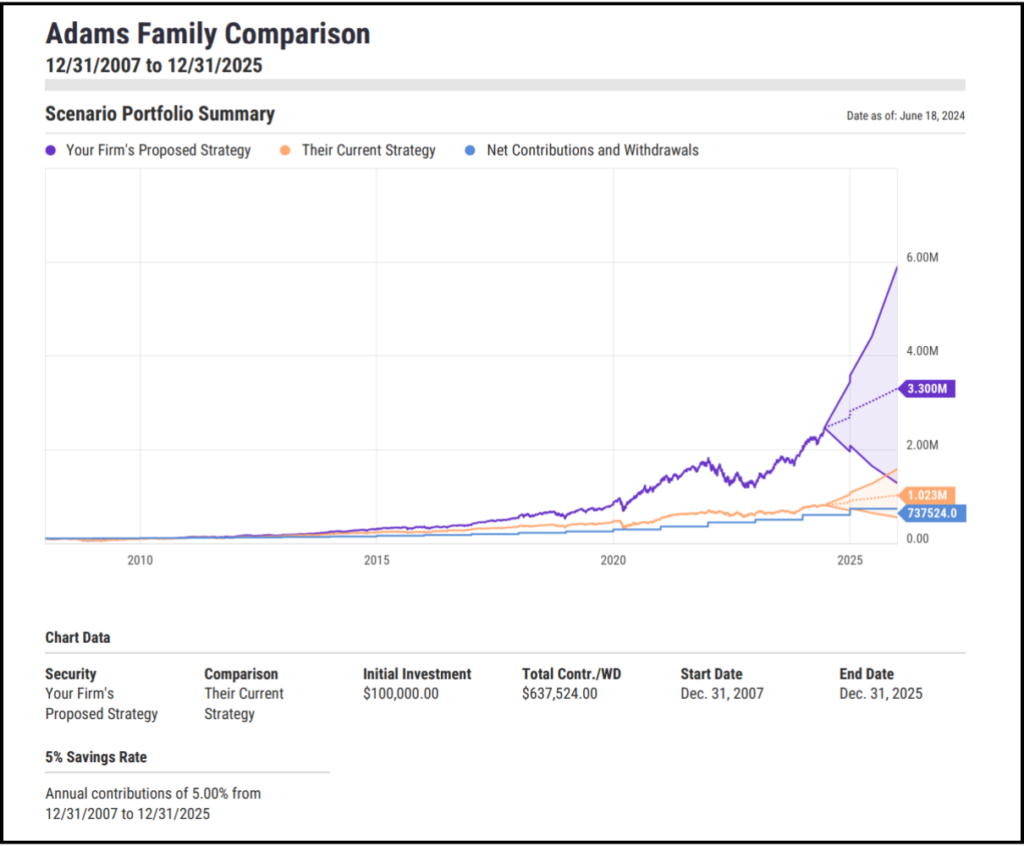
Scenarios enable advisors to model different market conditions and assess their impact on client portfolios. This tool is crucial for proactive risk management and strategic planning. Peters also leveraged YCharts’ Excel Add-In to create customized client presentations and reports, improving client communication and trust.
Connect With our Team to Build a Scenario
These tools integrate seamlessly to form a cohesive platform that simplifies daily tasks, from research and analysis to client reporting.
Enhancing Client Interactions with YCharts
Effective communication is crucial in financial advisory. YCharts enhances client interactions through:
- Easy-to-Understand Visuals: YCharts offers interactive visual-making tools that make complex data easily digestible. These visuals are invaluable during client meetings, helping clients understand their portfolios better. For example, Burton Enright Welch used YCharts’ data visualization tools to clearly explain investment strategies and demonstrate the importance of diversification to clients, enhancing client satisfaction and trust.
- Customizable Reports: Advisors can generate tailored reports that address specific client needs and concerns. These reports can be branded and formatted to reflect the advisor’s unique style and professionalism.

Connect With our Team to Generate a Report
Implementing YCharts in Your Daily Workflow
Integration into Existing Systems
YCharts offers seamless integration with various platforms, ensuring advisors can access all necessary information from a single interface. YCharts integrates with popular financial software, including iRebal, Redtail, Orion, Black Diamond, Addepar, and Pershing, among others. This unified workflow reduces the need to switch between different systems.
See an example of YCharts integration partners in action in the video below.
Moreover, YCharts provides comprehensive support and training to ensure smooth onboarding. Advisors can access webinars, user guides, and one-on-one training sessions to get the most out of YCharts.
Best Practices for Using YCharts
To get the most out of YCharts, consider these best practices:
- Set Up Alerts: Use YCharts to set up alerts for key market events and portfolio changes. This proactive approach ensures that you are always informed and can respond swiftly to market movements.
- Automate Routine Reports: Automate the generation of routine reports with out-of-the-box PDF templates. This frees up more time for client interactions and strategic planning.
Success Stories and Testimonials
Real-world success stories underscore the value of YCharts in streamlining financial advisory practices for analytical sales users.
DJ Hunt at Amarillo National Bank (ANB) replaced an outdated system with YCharts, resulting in significant time savings and improved accuracy. By automating and improving their Excel modeling process, ANB reduced the time spent on manual data entry from an entire day to just 20 minutes. This efficiency gain allowed more time for client interaction and strategic planning, leading to increased client satisfaction and business growth. Read more.
Ben Peters at Burton Enright Welch found YCharts to be a cost-effective solution for their practice. BEW used YCharts’ Excel Add-In and Model Portfolios to create customized client presentations and reports, saving time and improving the quality of client communications. The platform’s data visualization tools enabled BEW to clearly explain investment strategies and demonstrate the importance of diversification to clients, enhancing client satisfaction and trust. Read more.
Achieve Superior Client Service and Business Growth with YCharts
Streamlining a financial advisory practice with the help of YCharts offers numerous benefits. By addressing common efficiency roadblocks and enhancing client interactions, YCharts empowers advisors to provide superior service and drive business growth. The impact of efficient practice management on overall business success cannot be overstated.
Ready to transform your financial advisory practice? Sign up for a demo or start a free trial of YCharts today and experience firsthand how it can streamline your operations.
Whenever you’re ready, there are 3 ways YCharts can help you:
1. Looking to streamline your financial advisory practice, improve efficiency, and grow AUM?
Send us an email at hello@ycharts.com or call (866) 965-7552. You’ll be directly in touch with one of our Chicago-based team members.
2. Want to test out YCharts for free?
Start a no-risk 7-Day Free Trial.
3. Download a copy of the Top 10 Visuals for Client and Prospect Meetings slide deck:
Disclaimer
©2024 YCharts, Inc. All Rights Reserved. YCharts, Inc. (“YCharts”) is not registered with the U.S. Securities and Exchange Commission (or with the securities regulatory authority or body of any state or any other jurisdiction) as an investment adviser, broker-dealer or in any other capacity, and does not purport to provide investment advice or make investment recommendations. This report has been generated through application of the analytical tools and data provided through ycharts.com and is intended solely to assist you or your investment or other adviser(s) in conducting investment research. You should not construe this report as
Next Article
Achieving Compliance in Wealth Management: The Role of Standardized ReportsRead More →