How Asset Managers Can Showcase Unique Holdings with YCharts to Grow AUM
Differentiating strategies against passive and competitor approaches is vital for asset managers. With the surge in active ETFs and the broadening market leadership in 2024, YCharts provides the tools you need to stand out.
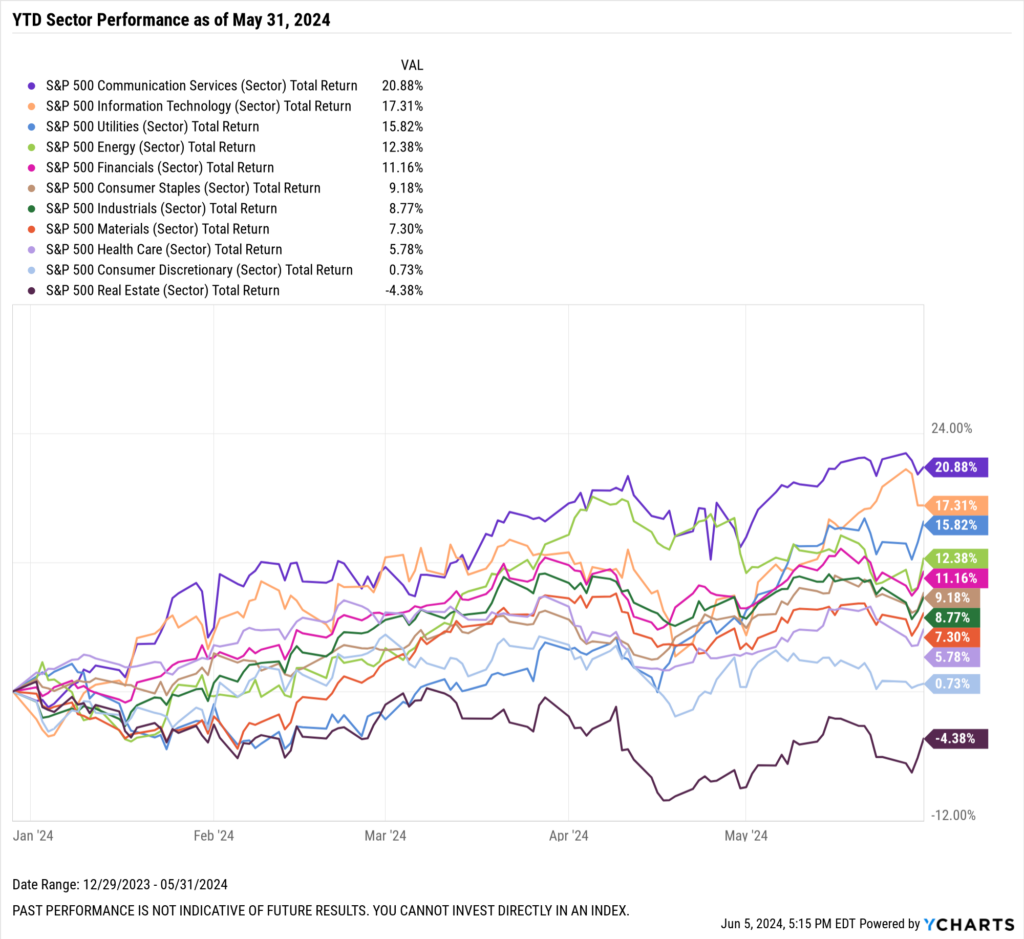
In 2023, big tech companies drove the stock market’s rise. As for 2024, market performance has been much broader, with all but one sector (Real Estate) posting positive returns through the first five months of the year.
Download Visual | Modify in YCharts
Active ETFs have gained significant traction, capturing nearly 30% of year-to-date equity ETF fund flows as of April 30, 2024, despite only making up 5% of equity ETF AUM. This surge in active management underscores the importance of providing differentiated value to advisors.
YCharts’ unique/common holdings feature lets you quickly highlight how your fund’s holdings differ from or align with passive strategies and competitors to showcase your strategy’s strengths and help you win AUM.
Using YCharts’ Fund Screener, we identified ETFs with sector allocations ranging from 20% to 80% of their holdings. The 80% threshold aligns with Section 35(d) of the 1940 Act, known as the Names Rule, which mandates that if a fund’s name implies a specific investment focus, it must allocate at least 80% of its assets accordingly.
Applying this filter allows us to screen for sector-agnostic funds with significant but not mandated sector exposure, ensuring a more balanced comparison of performance and strategy.
We then analyzed the performance of these ETFs over year-to-date, 1-year, and 3-year periods. Additionally, we compared the holdings of the top-performing ETFs to sector ETFs to identify the holdings driving their outperformance.
Click to jump to a section:
- ETFs with the Highest Communication Services Sector Exposure
- ETFs with the Highest Technology Sector Exposure
- ETFs with the Highest Utilities Sector Exposure
- ETFs with the Highest Energy Sector Exposure
- ETFs with the Highest Financials Sector Exposure
ETFs with the Highest Communication Services Exposure
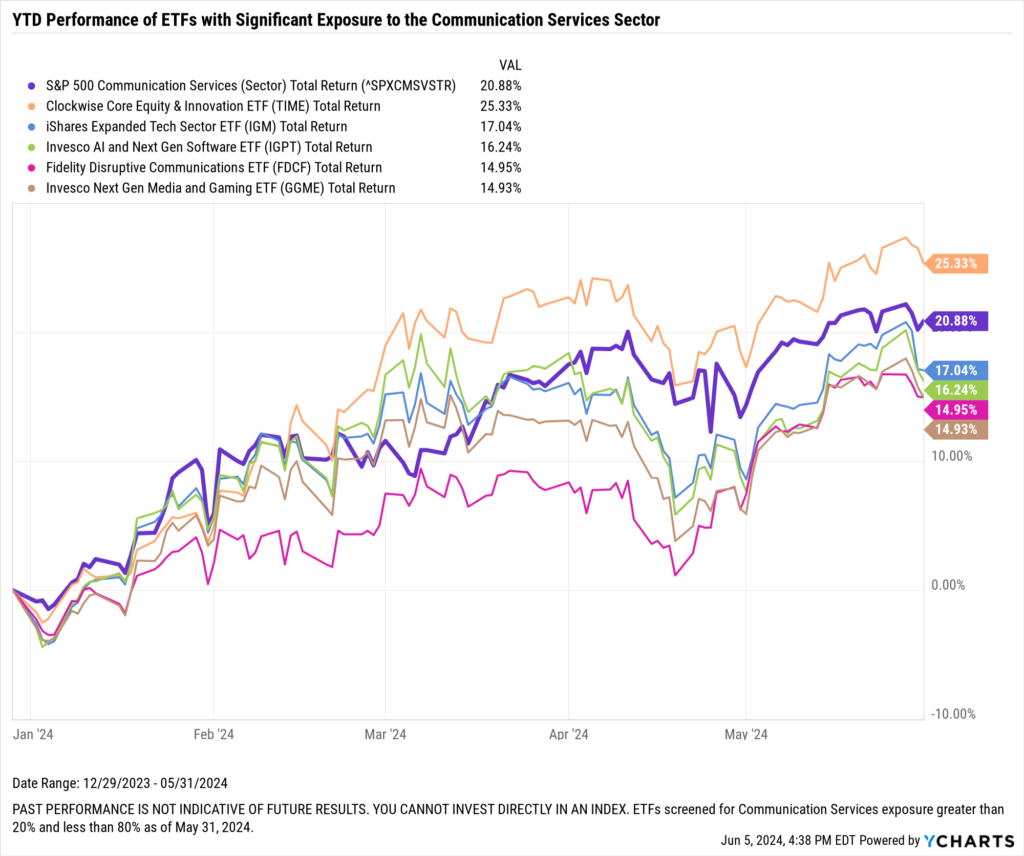
Through the end of May, the S&P 500 Communication Services index produced 20.9% YTD returns, the highest among sector indices.
As of May 31, 2024, the MUSQ Global Music Industry ETF (MUSQ) had a 76.63% exposure to the communication services sector, the highest among the 45 ETFs analyzed. View the complete list here.
Clockwise Core Equity & Innovation ETF (TIME) produced 25.3% YTD returns, the highest in the group as of May 31, 2024.
Download Visual | Modify in YCharts
On an annualized 1-year basis, TIME produced 50% returns, the highest among the ETFs analyzed. On a 3-year annualized basis, the iShares Expanded Tech Sector ETF (IGM) led the clubhouse with 11.8% returns.
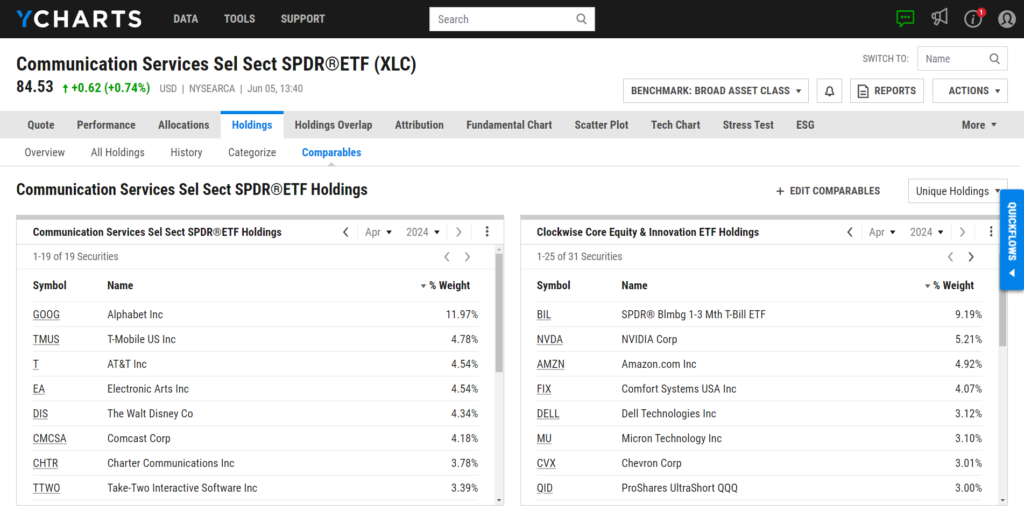
Of the 37 securities in TIME, 31 were unique holdings compared to the Communication Services Select Sector SPDR® ETF (XLC) as of April 30, 2024. These unique securities include NVIDIA Corp (NVDA), Amazon.com Inc (AMZN), and Comfort Systems USA Inc (FIX).
ETFs with the Highest Technology Exposure
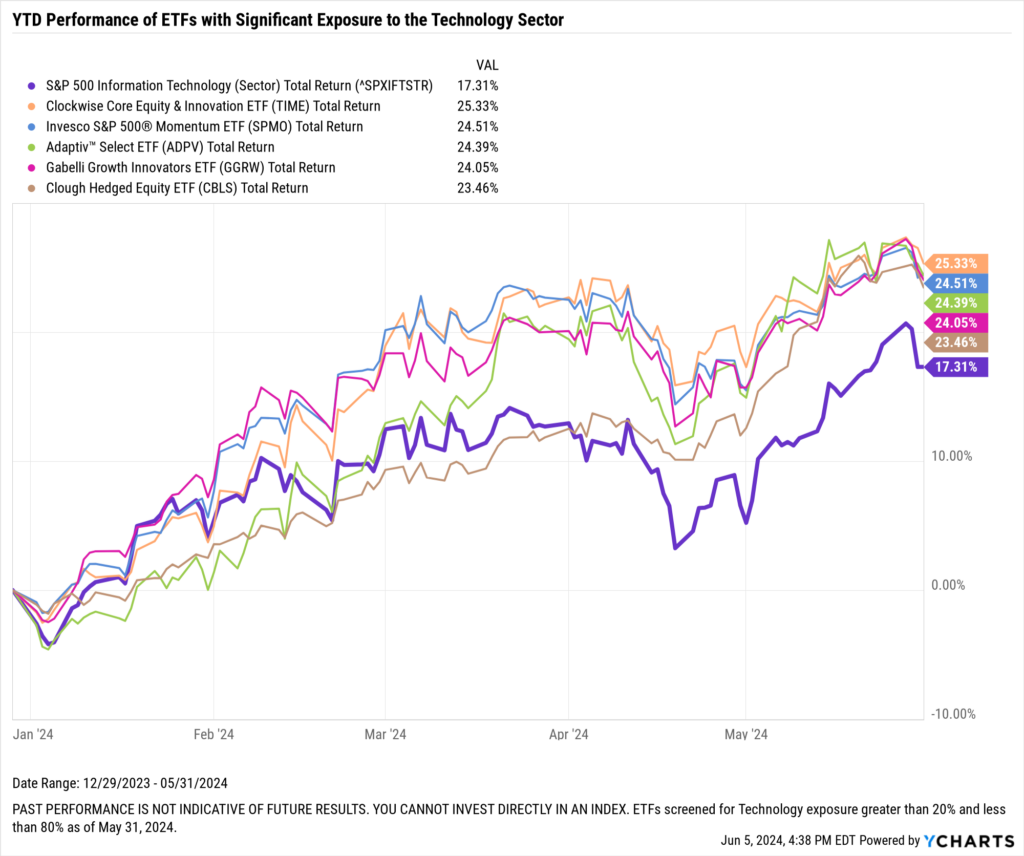
Through the end of May, the S&P 500 Information Technology index produced 17.3% YTD returns, the second highest among sector indices.
As of May 31, 2024, the WisdomTree Artificial Intelligence & Innovation ETF (WTAI) had a 79.08% exposure to the technology sector, the highest among the 567 ETFs analyzed. View the complete list here.
TIME’s 25.3% YTD return was also the highest among the Technology group as of May 31, 2024.
Download Visual | Modify in YCharts
On an annualized 1-year basis, the Invesco S&P 500® Momentum ETF (SPMO) produced 55.7% returns, the highest among the ETFs analyzed. On a 3-year annualized basis, the Hull Tactical US ETF (HTUS) led the clubhouse with 15.7% returns.
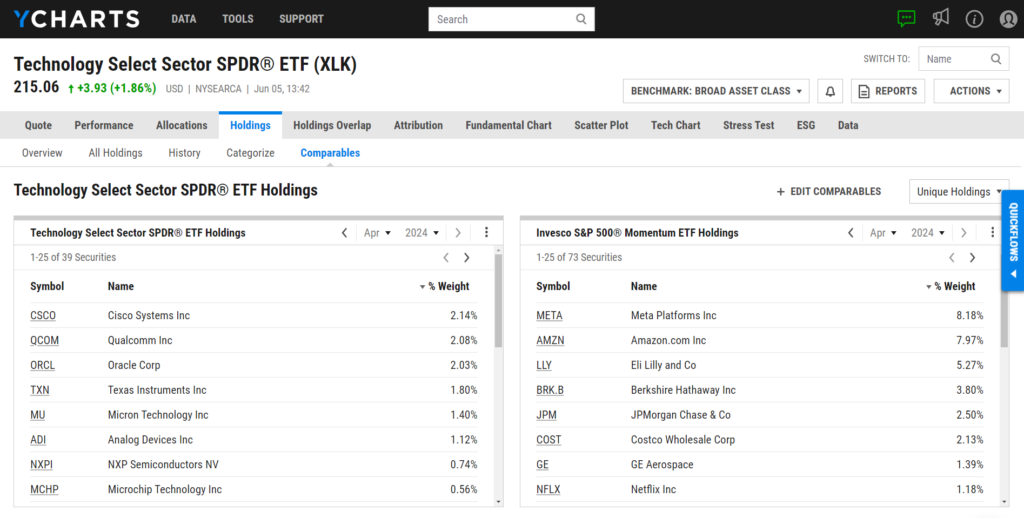
Of the 102 securities in SPMO, 73 were unique holdings compared to the Technology Select Sector SPDR® ETF (XLK) as of April 30, 2024. These unique securities include Meta Platforms Inc (META), Amazon.com Inc (AMZN), and Eli Lilly and Co (LLY).
ETFs with the Highest Utilities Exposure
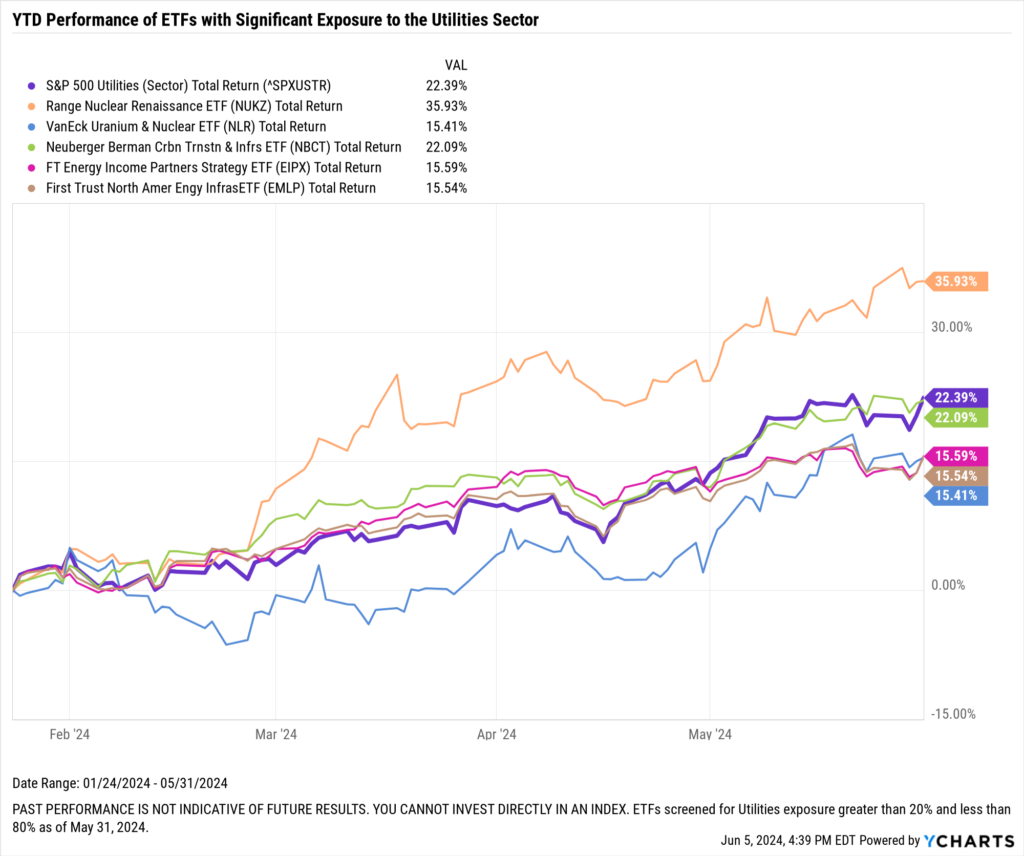
Through the end of May, the S&P 500 Utilities index produced 15.8% YTD returns, the third highest among sector indices.
As of May 31, 2024, the First Trust EIP Carbon Impact ETF (ECLN) had a 74.42% exposure to the utilities sector, the highest among the 47 ETFs analyzed. View the complete list here.
The Range Nuclear Renaissance ETF (NUKZ) produced 35.9% YTD returns, the highest in the group as of May 31, 2024.
Download Visual | Modify in YCharts
The VanEck Uranium & Nuclear ETF (NLR) produced the highest annualized 1- and 3-year returns at 66.1% and 20.2%, respectively.
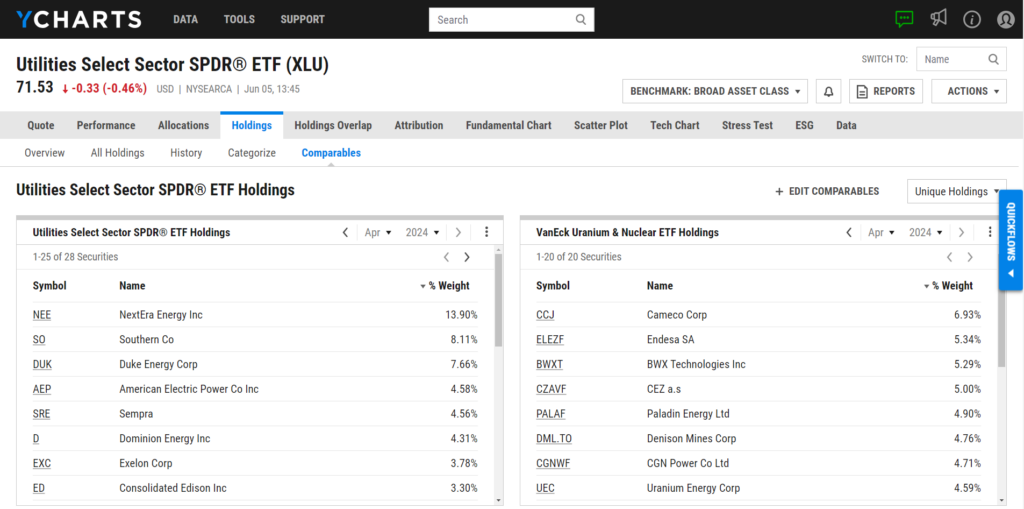
Of the 26 securities in NLR, 20 were unique holdings compared to the Utilities Select Sector SPDR® ETF (XLU) as of April 30, 2024. These unique securities include Cameco Corp (CCJ), Endesa SA (ELEZF), and BWX Technologies Inc (BWXT).
ETFs with the Highest Energy Exposure
Through the end of May, the S&P 500 Energy index produced 12.4% YTD returns, the fourth highest among sector indices.
As of May 31, 2024, the iShares North American Natural Res ETF (IGE) had a 78.14% exposure to the energy sector, the highest among the 50 ETFs analyzed. View the complete list here.
The SonicShares™ Global Shipping ETF (BOAT) produced 29.4% YTD returns, the highest in the group as of May 31, 2024.
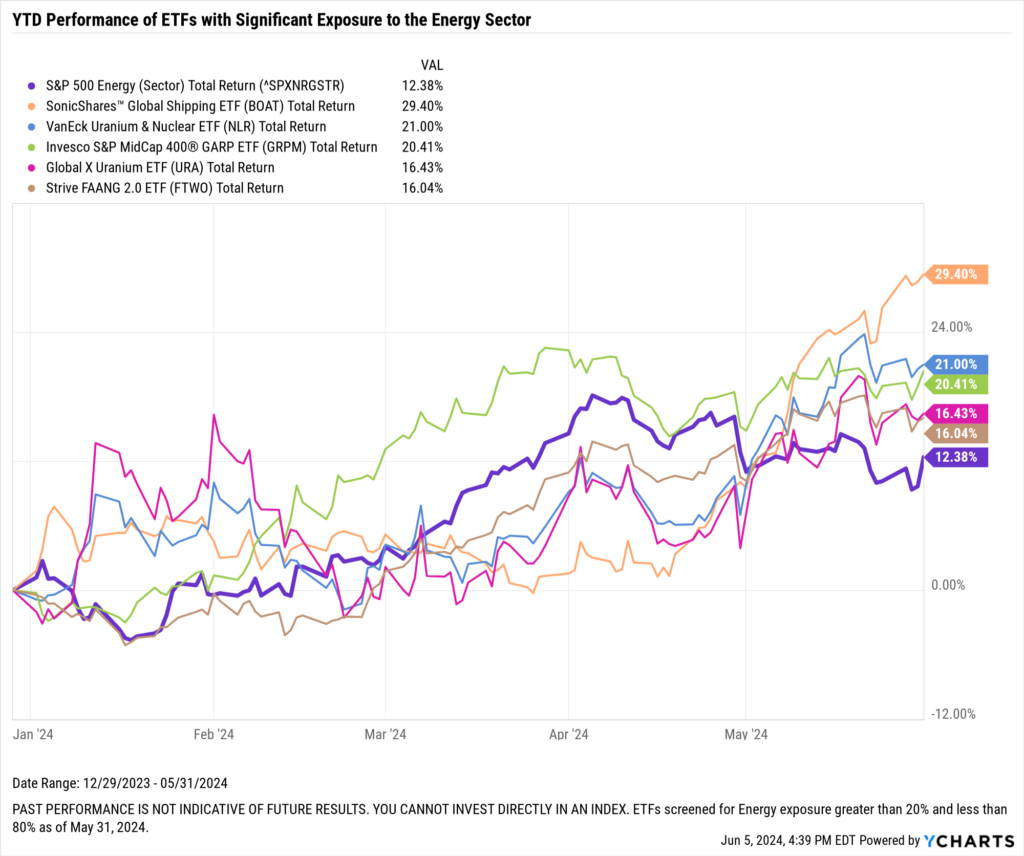
Download Visual | Modify in YCharts
On an annualized 1-year basis, the Global X Uranium ETF (URA) produced 72% returns, the highest among the ETFs analyzed. On a 3-year annualized basis, the VanEck Uranium & Nuclear ETF (NLR) led the clubhouse with 20.2% returns.
Of the 54 securities in URA, 41 were unique holdings compared to the Energy Select Sector SPDR® ETF (XLE) as of April 30, 2024. These unique securities include Cameco Corp (CCJ), NexGen Energy Ltd (NXE), and Paladin Energy Ltd (PALAF).

ETFs with the Highest Financials Exposure
Through the end of May, the S&P 500 Financials index produced 11.2% YTD returns, the fifth highest among sector indices.
As of May 31, 2024, the Fidelity Disruptive Finance ETF (FDFF) had a 66.91% exposure to the financial services sector, the highest among the 153 ETFs analyzed. View the complete list here.
The Adaptiv™ Select ETF (ADPV) produced 24.4% YTD returns, the highest in the group as of May 31, 2024.
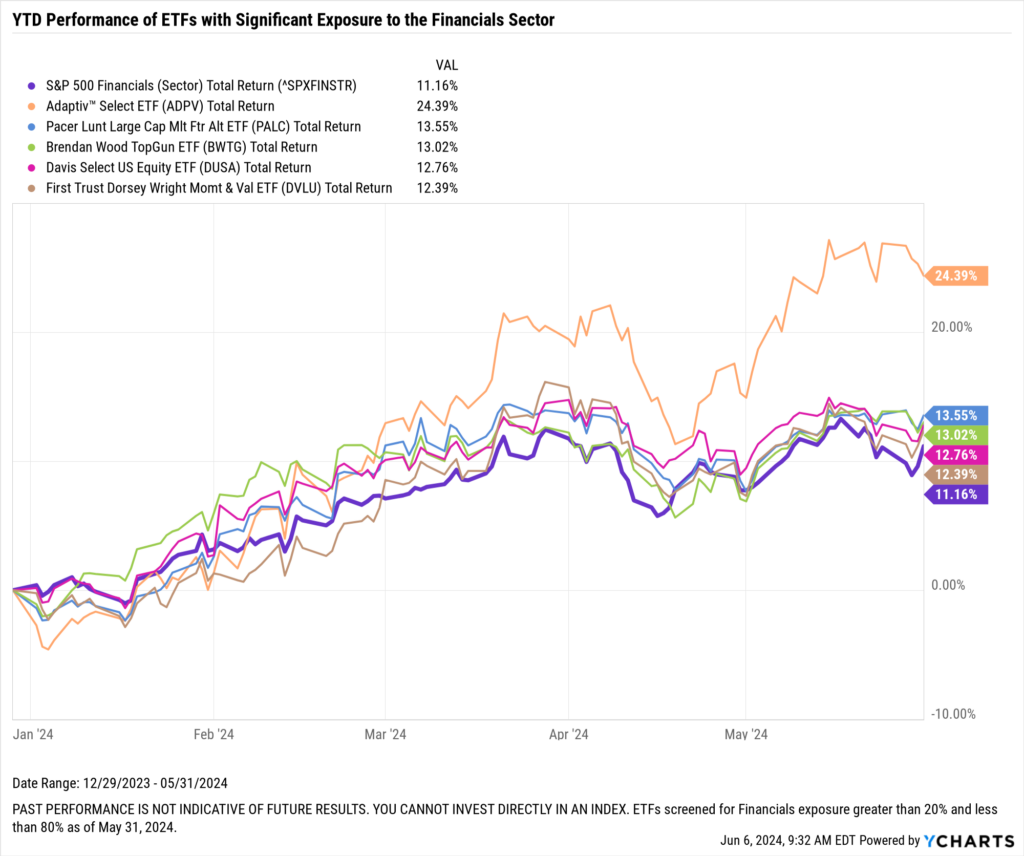
Download Visual | Modify in YCharts
The Global X Adaptive US Factor ETF (AUSF) produced the highest annualized 1- and 3-year returns at 38.2% and 12.3%, respectively.
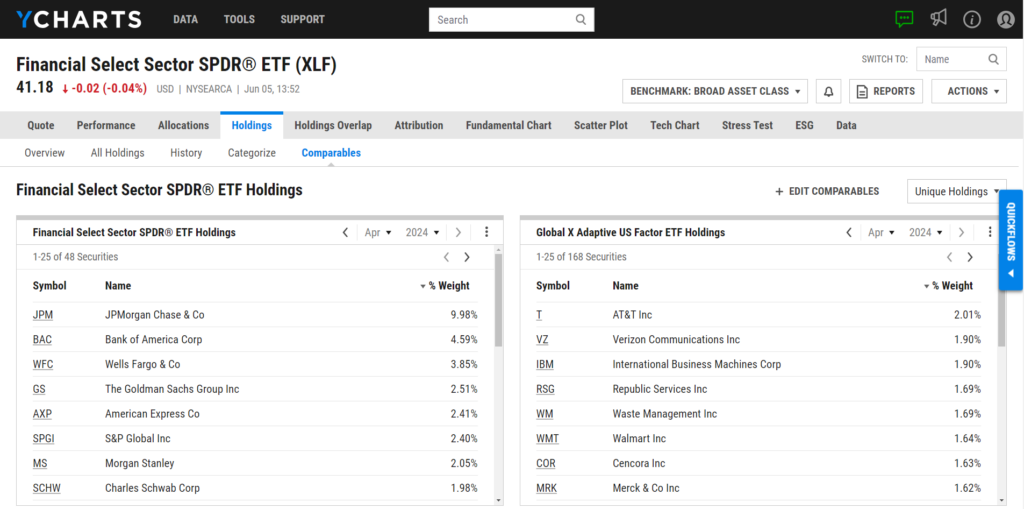
Of the 195 securities in AUSF, 168 were unique holdings compared to the Financial Select Sector SPDR® ETF (XLF) as of April 30, 2024. These unique securities include AT&T Inc ( T), Verizon Communications Inc (VZ), and International Business Machines Corp (IBM).
Using YCharts to Compare and Present ETFs to Advisors
Demonstrating to advisors that your strategy can place their clients in the right stocks at the right time is crucial for winning AUM in active, sector-specific, and sector-agnostic ETFs. Leveraging YCharts’ research and point-of-sale tools can streamline this process, providing you with the insights and visuals needed to showcase your strategy’s effectiveness and differentiate yourself in a competitive market.
Before meeting with financial advisors, asset managers can use a Comp Table or Fund Screener to understand their funds’ quantitative strengths and vulnerabilities. This can help better address potential advisor concerns and highlight competitive advantages.
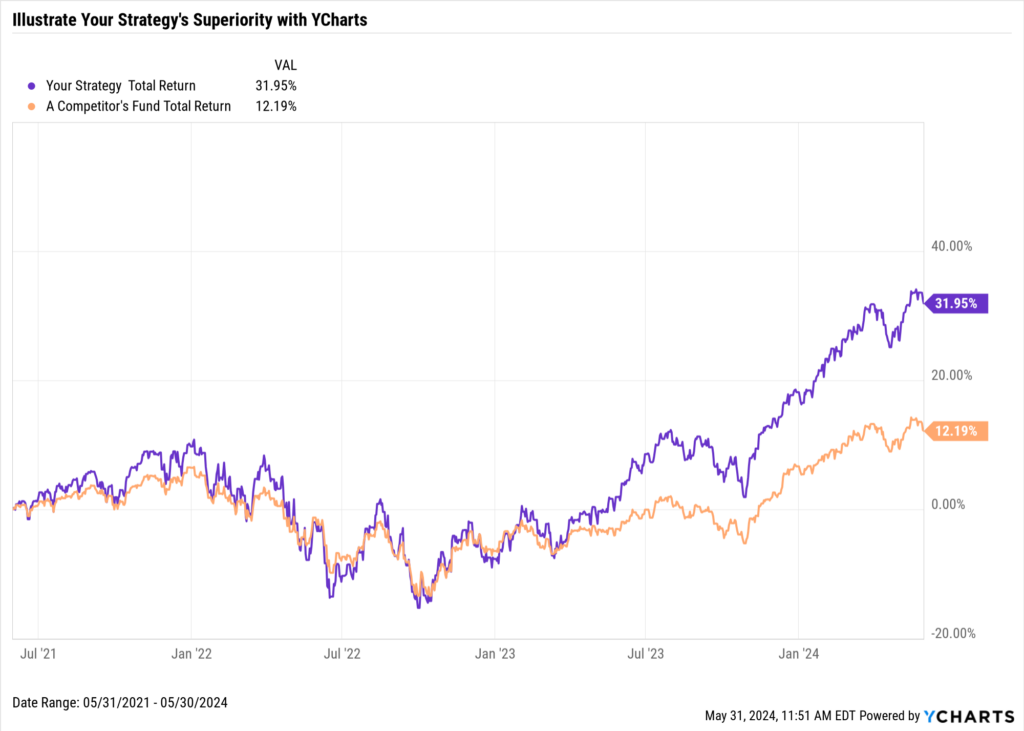
During discussions, wholesalers can employ Fundamental Charts in YCharts to visually demonstrate the superiority of their strategies over competitors.
Connect with an Asset Management Specialist
After personalizing visuals for one advisor, you can save and add them to your Dashboard. All visuals and Dashboards can be shared in YCharts so a regional director can create a centralized resource hub, ensuring consistency across all client interactions.
When dealing with advisors who already invest in similar funds, you can quickly toggle between the unique and common holdings of multiple mutual funds, ETFs, and Portfolios to differentiate your strategy in a crowded market.
Connect with an Asset Management Specialist
By incorporating an advisor’s holdings into Portfolios, asset managers can illustrate how their strategies enhance client portfolios. Whether it’s improving performance, enhancing risk mitigation, or lowering volatility, YCharts provides the tools to articulate, visualize, and quantify the specific benefits of your strategy tailored to the advisor’s client needs.
Whenever you’re ready, there are three ways YCharts can help you:
Have questions about leveraging YCharts to grow AUM in your Mutual Fund or ETF?
Email us at hello@ycharts.com or call (866) 965-7552. You’ll get a response from one of our Chicago-based team members.
Try out creating your own Visuals.
Dive into YCharts with a no-obligation 7-Day Free Trial now.
Talk to a member of our Asset Management team to see how YCharts can assist you in growing your business:
Disclaimer
©2024 YCharts, Inc. All Rights Reserved. YCharts, Inc. (“YCharts”) is not registered with the U.S. Securities and Exchange Commission (or with the securities regulatory authority or body of any state or any other jurisdiction) as an investment adviser, broker-dealer or in any other capacity, and does not purport to provide investment advice or make investment recommendations. This report has been generated through application of the analytical tools and data provided through ycharts.com and is intended solely to assist you or your investment or other adviser(s) in conducting investment research. You should not construe this report as an offer to buy or sell, as a solicitation of an offer to buy or sell, or as a recommendation to buy, sell, hold or trade, any security or other financial instrument. For further information regarding your use of this report, please go to: ycharts.com/about/disclosure
Next Article
Understanding Market Trends Through Economic Indicators: A Guide for Research-Oriented Financial AdvisorsRead More →