Tools
Game-changing financial advisor tools on a single, customizable platform.

Model Portfolios
Visualize your investment strategies to test and validate new investment ideas, compare performance & risk, and drive report-generation. Seamlessly import portfolio data via integration or file upload.
Learn More →

Talking Points
Leverage over 4,000+ metrics, including performance, risk, and more, to select attributes that best showcase the distinct value propositions of your strategy & creating tailored proposals and reports.
Learn More →

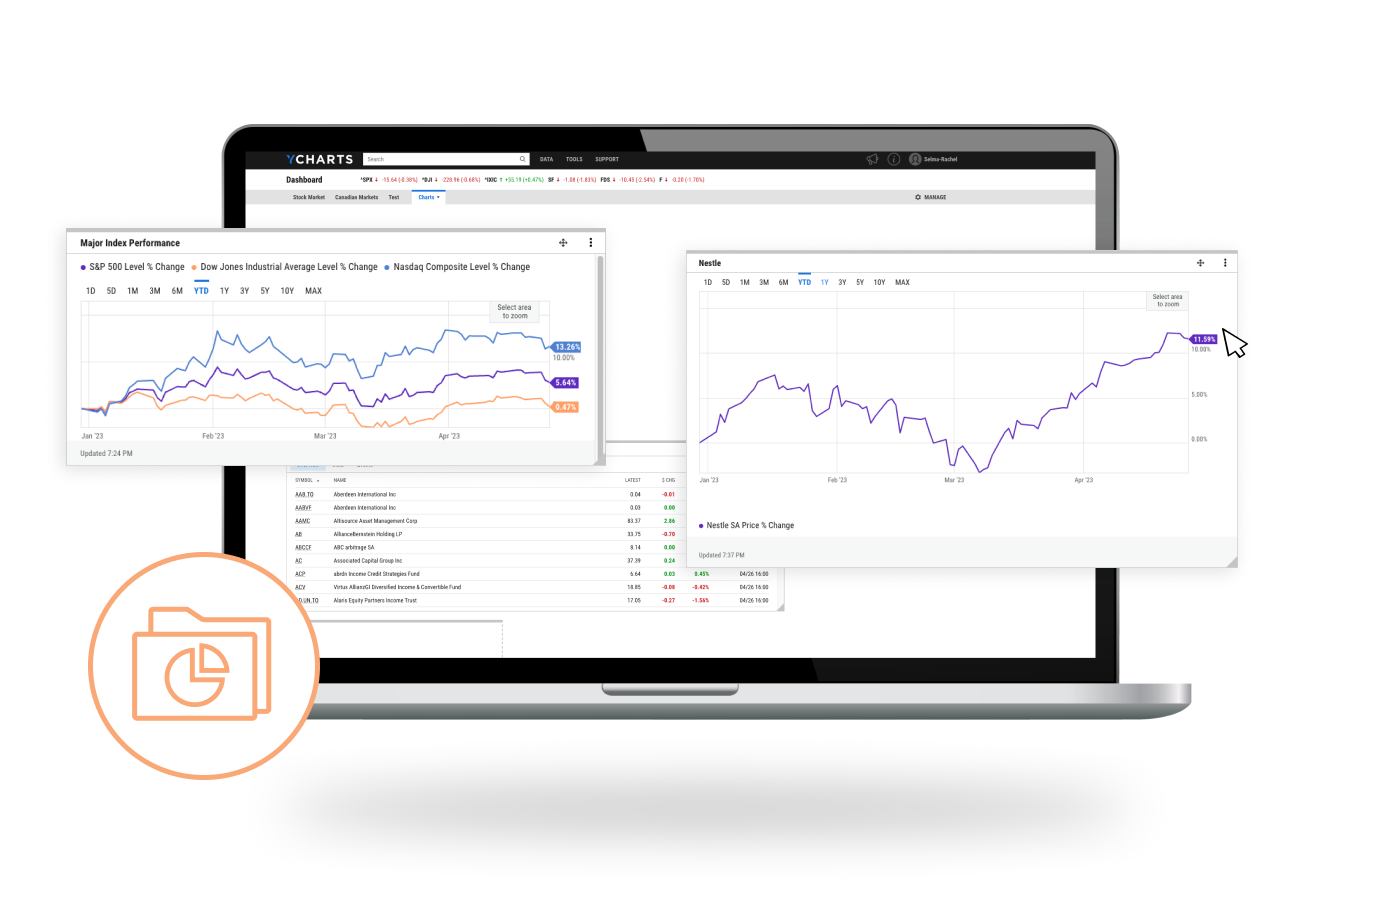
Dashboard
Keep your portfolios, top holdings, research lists, and favorite market & economic data front-and-center. Add watchlists, visuals, and earnings calendars & share with your team to stay aligned.
Learn More →

Fundamental Charts
Visualize any trend, any metric, and any security. From alpha to z-score & equities to SMAs, annotate charts with call-outs, overlay economic data, and add your firm’s logo and color scheme.
Learn More →

Report Builder
Leverage this intuitive, drag-and-drop designer to create your ideal report or presentation. Featuring 4 different report types, 30+ modules, and several templates to choose from–and counting.
Learn More →

Fund Screener
Narrow a universe of 45,000+ mutual funds, ETFs & CEFs using your chosen criteria like performance & risk metrics, category rankings, brokerage-availability, security exposures & more.
Learn More →
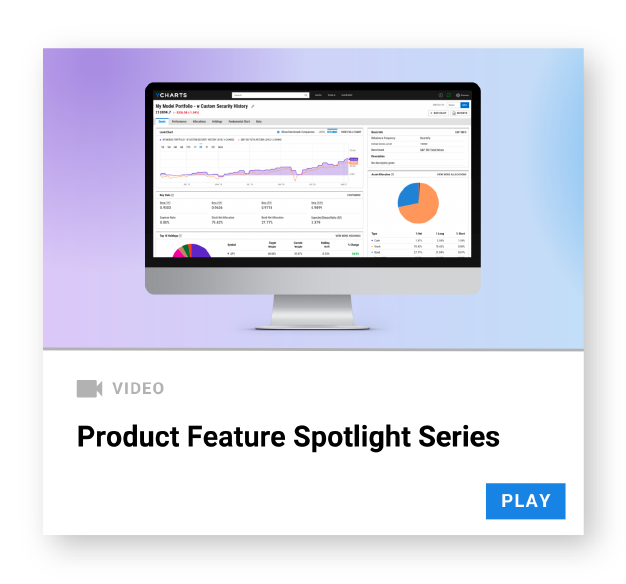
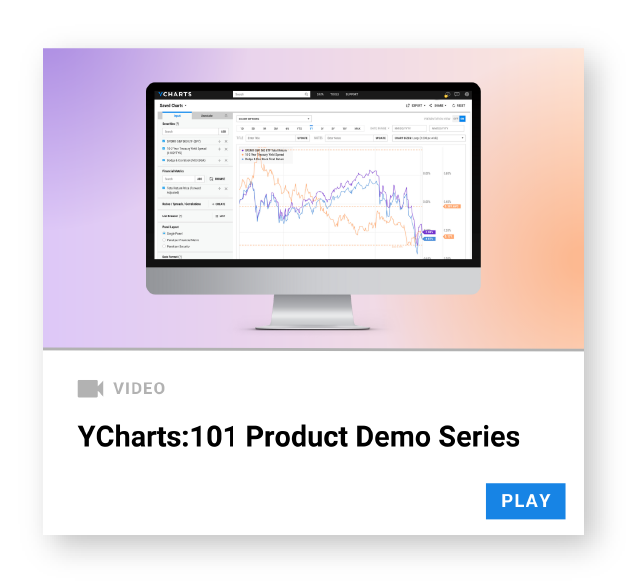
Watch to learn about the platform’s research and communication features

Stock Screener
Filter 20,000+ equities and ADRs using 4,500+ qualitative and quantitative metrics. Generate smarter ideas and construct better portfolios using custom Scoring Models & your choice of data.
Learn More →

Scenarios
Show the impact of withdrawals and deposits on a portfolio’s value. Add your investment strategy, define a time period and contribution type, and create compelling visuals for client conversations.
Learn More →

Portfolio Optimizer
Build the optimal allocation strategy to mitigate exposure to risk, maximize portfolio performance, and enhance data-driven decision-making for portfolio management.
Learn More →

Excel Add-in
Automatically populate your Excel models with live data, saving you hours per week. Leverage 40+ pre-built templates for portfolio, company, and fund comparisons, or work with our dedicated team to convert existing workbooks.
Learn More →

Quickflows
Highly impactful workflows, automated into single-click efforts via an easy-to-use and always-handy menu. Add any security to build visuals, comparison tables, economic impact scenarios, and more.
Learn More →

Custom Reports
Create an engaging experience for all your clients & prospects. Pre-built reports for portfolios, funds & stocks are customizable for length, data, visuals, and a logo & colors of your choosing.
Learn More →

Scatter Plot
Illustrate risk vs. reward for different securities, plot your portfolios against an efficient frontier, and understand how individual holdings are affecting portfolio-level metrics.
Learn More →

Comp Tables
Build comprehensive data tables to compare and contrast portfolios, funds, stocks, and other securities. Add custom Scoring Models with metrics and weights of your choosing, and export to shareable, formatted PDFs.
Learn More →

Custom Securities
Upload your own historical data to YCharts to use in Model Portfolios and visual creation. Add strategy return histories, non-public investment returns, and other proxies, then assign asset class information for use throughout the YCharts platform.
Learn More →

Email Reports
Construct tailored market updates with your portfolios, top holdings, and key economic data, sent straight to your inbox on a daily, weekly, or monthly cadence.
Learn More →

Technical Charts
Overlay price action with technical indicators and custom views to monitor your entries and exits. Leverage 30+ technical indicators and more than 28,000 equities and indices.
Learn More →

Timeseries Analysis
Quickly aggregate historical economic data or index performance, align unlike frequencies for cleaner comparisons, and export as a .csv, .xlsx, or to the YCharts Excel Add-in.
![]()
See what YCharts can do for you.
Talk to one of our experts.
Reach out for a personalized demo with a YCharts product specialist.